Abstract
Postharvest losses represent a significant challenge to the rice value chain and food security in Nigeria, with the majority of these losses occurring during harvesting phase. Traditional manual harvesting methods contribute notably to these losses. However, there is limited understanding of rice farmersâ preferences and willingness to pay for mechanized harvesting services. We investigate the drivers of farmersâ preferences and willingness to pay for mechanized harvesting services using two types of mechanized harvesters. We conduct a field survey employing the contingent valuation method and a two-stage approach to elicit farmersâ willingness to pay. Findings indicate a strong preference for mechanized harvesters over manual methods, with the large-sized mechanized harvester being the most favored. A double-hurdle model analysis reveals that while farmers are willing to pay for the mechanized harvesting services, their willingness is constrained by the affordability, as they demand highly discounted prices. Furthermore, both socio-economic characteristics and individual perceptions of post-harvest losses significantly influence preferences and willingness to pay. Survival analysis suggests that the demand for mechanized harvesting services is highly elastic. These finding underscore the potential for targeted policies promoting mechanized harvesters, which could reduce post-harvest losses and improve food security in Nigeria.
1. Introduction
Post-harvest losses (PHL) remain a major constraint to food security and poverty alleviation in Sub-Saharan Africa (SSA), particularly in the context of rapidly growing food demand. PHL refer to a measurable reduction in both the quantity and quality of food along the postharvest value chain, spanning from harvesting to consumption (Grolleaud, 2002; Kader, 2013; Kok and Snel, 2019). With SSAâs population projected to double by 2050, ensuring food security requires urgent interventions to minimize inefficiencies in agricultural production and distribution. However, persistent PHL exacerbate existing food insecurity, impeding progress toward the Sustainable Development Goals (SDGs), in particular zero hunger (SDG2) and no poverty (SDG 1) (Affognon et al., 2015; Hodges et al., 2011; Kumar and Kalita, 2017).
The scale of PHL is alarming. Estimates indicate that 20â40% of total food production in Africa is lost post-harvest, amounting to an annual economic loss of USD 4 billion, which is equivalent to the total cost of cereal imports in SSA (Abass et al. 2014; Affognon et al., 2015; Kumar and Kalita, 2017). Losses in staple crops such as maize, wheat, and rice are particularly detrimental, with rice losses alone accounting for 53% of total caloric losses, enough to meet the energy needs of over 48 million people (Kumar and Kalita, 2017).
The rice sector is particularly strategic for food security and poverty alleviation in Nigeria, where rice is the third most consumed stable crop and the fourth largest provider of calories (Cadoni and Angelucci, 2013). Nigeria is the largest rice producer in Africa, yet its rice value chain suffers from severe inefficiencies, particularly during harvesting (Castelein et al., 2022; Ogundele, 2022).
The postharvest segment of the rice value chain (VC) includes multiple stagesâharvesting, threshing, winnowing, transportation, drying, parboiling, processing, storage, and marketing (Castelein et al., 2022; Ogundele, 2022). Among these, harvesting is consistently identified as the stage with the highest proportion of losses (Castelein et al., 2022; Ogundele, 2022; Oguntade et al., 2014).1 However, estimated rice PHL in Nigeria vary significantly, with studies reporting rates ranging from 8 to 25% (Ogundele, 2022; Oguntade et al., 2014; Sani et al., 2022) equivalent to USD 153.24 million in economic losses (Castelein et al., 2022). Moreover, these losses have severe environmental consequences, as CO2-equivalent emission from PHL represent 0.4% of Nigeriaâs total greenhouse gas (GHG) emission (Castelein et al., 2022; Kumar and Kalita, 2017).
Historically, African government have implemented large-scale agricultural mechanization programs to modernize farming, notably during the 1960s and 1970s. However, these initiatives largely failed due to governance issues, lack of sustainability, and weak institutional support (Daum and Birner, 2020). In Nigeria, for instance, mechanized harvesters (MH) were introduced in previous decades, but adoption rates among smallholder farmers remained low due to economic and infrastructural constraints (Van Pham, 2016). Today, most farmers still rely on manual harvesting, typically using sickles, leading to high losses and labor inefficiencies (Kamai et al., 2020; Oguntade et al., 2014).
The low adoption of mechanized harvesting technologies stems from several barriers. Limited awareness and training prevent farmers from understanding and utilizing modern harvesting methods (Abass et al., 2014). The scarcity of mechanization service providers further restricts access to these technologies (Castelein et al., 2022). High costs and affordability constraints make the upfront investment prohibitive for smallholder farmers (Kumar and Kalita, 2017). Additionally, weak market linkages hinder demand aggregation, limiting cost-sharing opportunities that could facilitate adoption (Oguntade et al., 2014).
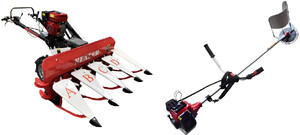
Recognizing these challenges, recent policy and development interventions have prioritized mechanization as a key strategy to reduce PHL and improve rice productivity and food security. In collaboration with development partners, the Japanese International Cooperation Agency (JICA) and the World Bank-funded FADAMA III project have introduced advanced mechanized harvesting technologies in the Nigeriaâs two rice development hubs.2 Through JICA initiatives, the rice reaper harvester (Figure 1, left) has been deployed in each of the rice hubs, while FADAMA III introduced the mini harvester (Figure 1, right) has been introduced in the Kano rice hub. These two technologies have been field-tested by extension services with the objective of large-scale dissemination among farmers. However, before scaling up, it is critical to understand farmersâ preferences and willingness-to-pay (WTP) for mechanized harvesting services to ensure sustainable adoption.

(Left) Reaper-harvester (source: shellermachine.com); (right) mini harvester (source: farmpays.com).
Citation: International Food and Agribusiness Management Review 29, 1 (2026) ; 10.22434/ifamr.1250
While extensive research exists on farmersâ preferences for storage technologies (e.g., Bokusheva et al., 2012; Channa et al., 2019; Gbénou-Sissinto et al., 2018), there is limited empirical evidence on farmersâ preferences and WTP for mechanized harvesting technologies. Recent work by Castelein et al. (2022) highlighted the impact of mechanized harvesting on reducing PHL and GHG emissions in Nasarawa State (Nigeria), showing that adoption of a mechanical reaper reduced paddy losses from 9.6% to 0.9%, increased output by 299 kg/ha, and boosted profits by USD 140.36 (â¦50â 531)/ha.3 However, this study did not examine farmersâ preferences, WTP, or determinants of technology adoption, critical factors that influence policy recommendations.
We fill this gap by proving a comprehensive analysis of rice farmersâ preferences and WTP for two MH services. Specifically, we (1) assess farmersâ preferences and WTP for two mechanized harvesting services using the mini-harvester and rice reaper, (2) identify socio-economic and behavioral factors influencing these preferences and WTP, and (3) estimate the own price elasticity of demand for the mechanized harvesting service, providing insights into price sensitivity. Following the existing literature on technology adoption in agriculture (e.g., Adesina and Baidu-Forson, 1995; Adesina and Zinnah, 1993; Channa et al., 2019; Gbénou-Sissinto et al., 2018; Horna et al., 2007; Lazaridou et al., 2019; Okello et al., 2023), we hypothesize that farmers will exhibit a strong preference for mechanized harvesting service over traditional methods. Their WTP will be influenced by socio-economic factors and their perceptions of PHL.
To achieve our research objectives, we conducted a field survey among a randomly selected, representative sample of rice farmers in Nigeriaâs two major rice hubs. A contingent valuation method combined with a two-stage approach was used to elicit farmersâ preferences and WTP. Additionally, a double hurdle model was employed to analyze the determinants of farmers preferences and WTP, while the own price elasticity of demand was estimated using survival analysis.
Results indicate that most farmers prefer the harvesting services over manual methods services, with a strong preference for the reaper, the larger MH. However, their WTP is significantly discounted, and they are highly responsive to price variation. Socio-economic characteristics and perceptions of PHL play a key role in shaping their preferences and WTP.
To the best of our knowledge, no prior study has specifically investigated farmersâ preferences for mechanized harvesting. The findings will provide critical information for rice stakeholder in the value chain in Nigeria. Policy decision-makers and development organizations can leverage these results to design more effective interventions that facilitate the adoption of mechanized harvesting. Finally, the study contributes to the limited body of research on farmersâ preferences for postharvest technologies, especially harvesting innovations.
This research advances three key areas of literature. First, it deepens our understanding of farmersâ preferences and WTP for post-harvest technologies services, addressing a gap in existing studies that have largely overlooked harvesting technologies. Second, it contributes to the growing field of behavioral agricultural economics by exploring how behavioral factors influence decision-making among agricultural value chain actors. Lastly, it enriches the literature on farming technology adoption by providing new insights into mechanized harvesting.
The rest of the paper is organized as follows. Section 2 provides a brief overview of recent development in rice mechanization in Nigeria. Section 3 describes the theoretical background and methods to estimate WTP, while Section 4 presents the methods and data collection process. Section 5 discusses the results, and Section 6 concludes with policy implications.
2. Recent developments in rice mechanization in Nigeria
The mechanization of rice harvesting in Nigeria has significant economic implications, especially in light of recent policy and investment trends.
After decades of stagnation, there has been renewed interest in agricultural mechanization as a strategy to improve food security and drive economic development. However, government investments have primarily targeted the production phase (pre-harvest) (Daum and Birner, 2020; Takeshima and Lawal, 2020) and, more recently, the processing sector, while critical post-harvest stage such as harvesting remain largely neglected. One key government initiative has been the provision of tractors at subsidized rates to farmers and/or private service providers, alongside the establishment of hiring schemes and assembly plants (Daum and Birner, 2020). Since 2018, the Nigerian Agricultural Mechanization Equipment Leasing Company has implemented an Agricultural Equipment Hiring Enterprises model, a Public-Private Partnership (PPP) aimed at improving access to mechanized equipment, including harvesters.4 While this model has expanded mechanization opportunities, its effectiveness in increasing MH adoption is hindered by three major limitations. First, the program remains predominantly focused on tractors rather than comprehensive mechanization solutions. Second, it is primarily deployed in areas with high existing demand for mechanization, leaving other areas underserved. Finally, it imposes financial constraints by requiring farmers or cooperatives to make a 20% equity deposit and repay the cost of the equipment over several years, which limits affordability for small-scale farmers.
In parallel, significant investments have been made in rice processing capacity, making a notable shift in the value chain. In 2023, Nigeria inaugurated the largest rice processing unit in Africa and the third largest globally. This unit, which produces the Eko Rice brand, has a processing capacity of 32 tons/h and an annual output of 2.8 million bags of 50 kg, with the potential to generate 1500 direct jobs and 254â 000 indirect jobs while reducing import dependency (Alade, 2023; Iwayemi, 2023). Additionally, private companies, such as OLAM International have invested in large-scale rice processing units to further strengthen local production capacity (Castelein et al., 2022).
Despite these advancements, mechanized harvesting remains largely absent from smallholder rice farmers, where manual harvesting continues to dominate (Kamai et al., 2020; Takeshima and Lawal, 2020). Given the critical role of harvesting in minimizing PHL and improving productivity, it is essential to investigate farmersâ preferences and WTP for mechanized harvesting services as a part of ongoing mechanization efforts. Understanding these preferences will provide valuable insights for designing effective policies and interventions that promote the adoption of mechanized harvesting technologies.
3. Theoretical background and methods for assessing WTP
The theoretical foundation for assessing willingness to pay (WTP) is rooted in the theory of utility maximization, which postulates that people make economic decisions to maximize their utility given their constraints (Stigler, 1950). Extending this concept, random utility theroy (Thurstone, 1927) incorporates stochastic elements into decision-making, recognizing that the choices are driven by the alternative yielding the highest perceived utility at the moment it is made. Several random utility models (RUM) have been derived from this theory (McFadden, 1986; Train, 2009), providing the foundation for discrete choice modeling in WTP estimation. In a RUM, a decision-maker makes a choice among a set of J alternatives. Each alternative J provides a level of satisfaction (utility) to the decision-maker i denoted as Uij, j=1,⦠J. The individual selects the alternative that provides the largest utility. Therefore, the behavioral model suggests that an alternative is chosen only and only if Uij>Uik Ɐ jâ k. This study is based on the random utility theory.
The literature provides two categories of methods to elicit WTP. First, stated preference methods include hypothetical methods such as hypothetical discrete choice experiments and contingent valuation methods (CVM) (Carson and Louviere, 2011). In these approaches, respondents directly state their value for a good or service or their preferences among a set of alternatives (Boxall et al., 1996). However, the main weakness of stated preference approaches is the hypothetical bias. It is defined as âthe potential error induced by not confronting the individual with an actual situation, i.e., an organized market with well-defined pricesâ (Schulze et al., 1981). Second, revealed preference methods derive consumersâ valuations for goods or services from their observed behavior in a real market situation (Mendelsohn, 2019). Because of the nature of the technology (MH) assessed and its availability at the time of the study, we used a CVM. CVM aims at identifying how subjects make economic tradeoffs to put a value on a good via survey questions (Carson, 2012; Carson and Louviere, 2011). These methods are more suitable for valuation research in agriculture and are popular in Sub-Saharan Africa (Durand-Morat et al., 2016; Horna et al., 2007).
The elicitation technique used in the CVM is paramount. The literature proposes several techniques to estimate WTP using CVM: an iterative bidding (IB) game, a payment card, a dichotomous choice (DC), a double-bounded dichotomous choice, a stochastic payment card, and randomized card sorting (Durand-Morat et al., 2016; Willis, 2002). We used the bidding game format as it provides many advantages and is preferable to other techniques. It combines the features of the DC and the double-bounded DC, and the technique is developed based on an English auction mechanism. In an IB game, a sequence of DC (Would you be willing to pay X dollars for this offer?) is asked to respondents, and it offers several rounds of bids. The bidding ends when the iterations have converged to a point estimate of WTP with the final question being open-ended (what is the maximum you will be willing to pay for this offer?) (Willis, 2002). IB games encourage respondents to consider their preferences carefully, provide relatively better results since it gives market context, and the researcher could obtain the maximum WTP value. In addition, it allows generating in detail the demand curve. This method is, nevertheless, subject to the anchoring bias, which occurs when the initial price influences an individualâs final WTP (Willis, 2002).
4. Methods
4.1 Study area and data collection
The study was conducted in the two rice development hubs in Nigeria as established by the National Cereal Research Institute (NCRI) in partnership with the Africa Rice Center (AfricaRice, 2011). Lafia rice hub includes Nasarawa and Benue states, while Kano rice hub includes Kano State. Throughout the rest of the paper, we will use Lafia to denote the Lafia rice hub and Kano to indicate the Kano rice hub. Random multistage sampling was used. Local governments, villages, and farmers were successively randomly selected. 296 farmers were sampled, including 192 and 104 farmers in Lafia and Kano, respectively. Before the data collection, from July to August 2017, a diagnostic survey was conducted in May 2017 to refine the research protocol and questionnaires.
4.2 Contingent valuation procedure
We designed and implemented the IB game following a rigorous procedure. First, focus group discussions were conducted to assess farmersâ perceptions on PHL, estimate the cost of the traditional method of harvesting, and investigate their perceptions about the cost of the service provided with a MH relative to the TH. The results indicate that farmers pay up to US D 55.55 (â¦20â 000) with an average of USD 47.22 (â¦17â 000) per hectare for harvesting service using TH, mainly sickles. Furthermore, farmers stated that the cost of a harvesting service using MH should be lower compared to the TH. Therefore, analogously to Houessionon et al. (2017), we applied a successive reduction rate of 12, 21, 29, 41 and 50% to the average cost of the harvesting service using TH. This process yielded the following WTP/ha points, respectively: USD 41.67 (â¦15â 000), USD 37.50 (â¦13â 500), USD 33.33 (â¦12â 000), USD 27.78 (â¦10â 000), and USD 23.61 (â¦8500).
In combination with the IB, we applied a two-stage approach and an upgrade method to elicit farmersâ WTP for mechanized harvesting services (Channa et al., 2019; Demont et al., 2012; Diagne et al., 2017). Moreover, we used the traditional method as the benchmark. The two selected MH were used as the upgraded methods. To create a real experience context of the MH, a video was shown for 30 seconds prior to the elicitation task. The video showed, for each technology, a real-life application of the MH on a rice farm. Based on our focus group, this duration was adequate for farmers to grasp how the technologies work and to gain realistic experience with the harvesters. This was done to reduce the hypothetical nature of the technology since most farmers may have never seen these two MH. Moreover, surveyors presented the main characteristics of the harvesters to farmers. The mini harvester is a small-size MH with a field capacity of 0.51 ha/day and a loss rate of 2.3% (Bora and Hansen, 2007). The reaper is a large-size MH with a capacity of 2â4 ha/day (IRRI, n.d.) and a loss rate of less than 0.5%. During the surveys, and for each MH, each farmer was asked if he/she prefers the MH to the traditional method. If he/she answered positively, then the IB game was presented to elicit his/her WTP/ha. If the answer was no, then the WTP is set to 0. The IB game started with the highest amount by asking the dichotomous question, âWould you be willing to pay at least USD 41.67/ha for a harvesting service using this equipment?â. If the answer is yes, we then ask the farmers an open-ended question to get the maximum amount. This provides the advantage of capturing the actual WTP instead of considering this first bid as the highest WTP. If the answer was no, we moved to the lower value, and the iteration stopped when the farmer answered yes to one of the bids. If he/she also answered no for the last bid, then we asked an open-ended question.
4.3 Empirical strategies
4.3.1. Farmersâ preferences and WTP
We used descriptive statistics to report farmersâ preferences and WTP. We computed farmersâ price premiums for the harvesting service using a MH relative to the traditional method. We also compared the price premium for the reaper harvester related to the mini harvester. Equations 1 and 2 present the formulas of the price premiums.
Citation: International Food and Agribusiness Management Review 29, 1 (2026) ; 10.22434/ifamr.1250
where MPPij denotes MH price premium of farmer i and for technology j (1=mini-harvester and 2=reaper), and CT the average cost of the TH method. RPPi represents price premium for reaper harvester. Therefore, MPP and RPP are expressed in proportion of the average cost of the traditional harvesting method.
4.3.2 Drivers of farmersâ preferences and WTP
Since there is a possibility of 0 WTP, the dependent variable is limited. The Tobit model is the most appropriate for this type of variable, which is mostly used in âcorner-solutionâ and censored data models. Although this approach is a good fit for models with a corner solution in the predicted variable, it assumes that the decision process is identical for those with 0 WTP and those with a greater WTP (Amemiya, 1984). This assumption is violated in our study since we used a two-step approach to elicit farmersâ WTP. The literature suggests the double hurdle model of Cragg (1971) as more suitable for two-stage data, and it provides a better result (Channa et al., 2019; Diagne et al., 2017; Saz-Salazar and Rausell-Köster, 2008). This model provides the advantage of isolating the process of âparticipatingâ from the valuation process. The double hurdle model was therefore used. Let us assume Dij, the variable representing the willingness to upgrade from the traditional harvesting method to the MH j for farmer i. Let WTPij denote the maximum amount this farmer is willing to pay for this MH. The two decision processes are presented in Equations 3 and 4 (Diagne et al., 2017):
Citation: International Food and Agribusiness Management Review 29, 1 (2026) ; 10.22434/ifamr.1250
where Xi is a vector of independent variables describing farmers socioeconomic and behavioral characteristics.
The first hurdle is the farmerâs decision of whether to use the MH. The probability that the respondent prefers the TH (WTPij = 0) is expressed by:
Citation: International Food and Agribusiness Management Review 29, 1 (2026) ; 10.22434/ifamr.1250
where Φ is the standard normal density function.
The second hurdle determines the effect of independent variables on WTPij, given WTPij >0. The distribution of WTPi conditional on being positive is truncated at zero with mean and variance Ï2. The second hurdle is formulated as:
Citation: International Food and Agribusiness Management Review 29, 1 (2026) ; 10.22434/ifamr.1250
In the first and the second hurdles, the dependent variable was regressed on the same set of explanatory variables. Evidence suggests that socio-economic variables influence farmersâ choices (Gbénou-Sissinto et al., 2018; Horna et al., 2007; Lazaridou et al., 2019). Furthermore, Adesina and Baidu-Forson (1995), Adesina and Zinnah (1993), and Affognon et al. (2015) have emphasized the need to consider perceptions in farmersâ adoption decisions. Farmersâ perceptions were therefore included in the independent variables. We asked farmers to rank the most important post-harvest activities, i.e., agricultural operations where PHL is the highest. A dummy variable was created, and it takes the value one when the farmer states harvesting as the first most critical post-harvest operation and 0 otherwise. Similarly, we asked farmers about the principal causes of PHL and generated a dummy variable for each of them.
4.3.3 Elasticity estimation
The own price elasticity of demand for a harvesting service using each MH was estimated. We used farmersâ WTP for harvesting service using each technology to estimate the market demand curve. We evaluated the market demand curve using survival analysis. Following StataCorp (2015) and Channa et al. (2019), the demand was estimated as the proportion of farmers willing to pay for the service at different price levels. The formula of this proportion, the product-limit estimate of the survivor function, is as follows (Channa et al., 2019; StataCorp, 2015).
Citation: International Food and Agribusiness Management Review 29, 1 (2026) ; 10.22434/ifamr.1250
where nk denotes the number of farmers willing to pay for the service at price level k, dk represents number of farmers whose WTP are less than k. The standard error of the proportion Sj is computed using the following formula.
Citation: International Food and Agribusiness Management Review 29, 1 (2026) ; 10.22434/ifamr.1250
The own price elasticity of demand for harvesting service using MH represents the elasticity of the proportion of farmers and is computed as follow:
Citation: International Food and Agribusiness Management Review 29, 1 (2026) ; 10.22434/ifamr.1250
Since WTP for the harvesting services using a MH was based on 1 ha, we generate the elasticity with the assumption that each farmer pays for the harvesting service for only 1 ha.
5. Results and discussion
5.1 Descriptive statistics
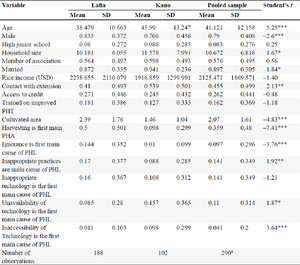
Table 1 presents the respondentsâ characteristics and perceptions, with the difference between the two study hubs, Lafia and Kano, analyzed using a two-tailed paired t-test. The farmers surveyed are middle-aged adults, with an average age of 41.12 years, though there is a significant age difference between hubs. Rice production remains male-dominated, with 83.5 % of farmers being male in Lafia compared to 70.6% of farmers in Kano. Marriage is prevalent among respondents, with nearly 90% of farmers married, and a statistically significant variation between hubs. These demographic patterns are consistent with prior studies, such as Horna et al. (2007). Household size averages 10.67 members, though it varies significantly between hubs. Less than 50% of farmers (45.5%) have access to extension services, with a nobly higher proportion in Kano (53.9%). Similarly, 57.6% of respondents are members of an agricultural association. The average cultivated area across the sample is 2.07 ha, with farmers in Lafia cultivating significantly larger plots than those in Kano.
Farmersâ socioeconomic characteristics and perceptions
Citation: International Food and Agribusiness Management Review 29, 1 (2026) ; 10.22434/ifamr.1250
On average, farmers report an annual rice income of USD 2125.471, though income levels differ significantly between hubs. Farmersâ perceptions of PHL vary between hubs. In Lafia, 50% of farmers identify harvesting as the most critical postharvest activity, compared to only 10% in Kano. Perceptions regarding the primary causes of PHL also differ. While 14.4% of farmers in Lafia cite ignorance as the leading cause of PHL, this proportion is only 1% in Kano, indicating substantial variation in awareness. Additionally, 14% of farmers attribute inappropriate postharvest practices and technology as the main drivers of losses. The unavailability of technology is identified as the principal cause of PHL by 11% of the farmers, with a significant discrepancy between hubs. These results reveal the heterogeneous perceptions of PHL across hubs, which may influence technology adoption.
5.2 Farmersâ preferences and WTP for mechanized harvester services
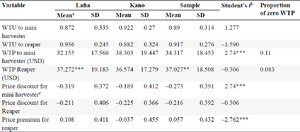
Table 2 presents the results of farmersâ preferences and WTP, as well as price premium for mechanized harvesting services. All values are expressed per hectare. Farmers stated a strong preference for mechanized harvesting service over traditional methods. On average, 89% of farmers are willing to adopt the mini harvester, while 91% prefer the reaper harvester over the manual harvesting. The preference for the reaper harvester is particularly pronounced in Lafia, where a higher proportion of farmers express willingness to pay more for reaper services than for mini harvester services. The average WTP for a mini harvester service is USD 34/ha, although this value varies significantly between hubs. In Lafia, farmers are willing to pay an average of USD 32.15, whereas in Kano, the WTP is higher at USD 38.30/ha. For the reaper harvester, the average WTP is USD 37.03/ha, with no statistically significant difference between hubs.
Rice farmersâ willingness to upgrade, WTP/ha, price discount and price premium for service using mini harvester and the reaper.
Citation: International Food and Agribusiness Management Review 29, 1 (2026) ; 10.22434/ifamr.1250
Unlike the mini harvester, farmers in both hubs exhibit similar WTP for a reaper harvesting service, suggesting a more consistent demand for this service across different contexts. However, despite their stated preference for mechanized harvesting, farmers significantly discounted the service price for both harvesters. The mini harvester was discounted by 27.3% compared to the cost of traditional harvesting. This discount rate is significantly higher in Lafia (31.9%) than in Kano (18.9%), reflecting variations in cost sensitivity. Farmers also discounted the reaper service by 21.6%, which is 5.7 percentage points lower than the discount applied to the mini harvester. These findings suggest that while farmers are willing to pay more reaper services, they still expect price reductions to facilitate adoption. These findings are consistent with Paudel et al. (2019), who reported that farmers in Nepal were willing to pay 31% less than the actual cost of the mini-tiller.
A significant proportion of farmers (80%) prefer the reaper harvesting service, though there is a notable gap between the two hubs (Figure 2). In Lafia, 90% of farmers prefer the reaper, whereas in Kano, this proportion is approximately 70%. Despite the strong preference for the reaper, a non-negligible percentage of farmers, particularly in Kano, still prefer the mini harvester. This variation highlights the importance of region-specific pricing strategies and financial support mechanisms to encourage broader adoption of mechanized harvesting technologies.
Farmersâ preferences for harvesters per hub and in the study area.
Citation: International Food and Agribusiness Management Review 29, 1 (2026) ; 10.22434/ifamr.1250
5.3 Determinants of farmersâ willingness to upgrade and to pay for mechanized harvesting service
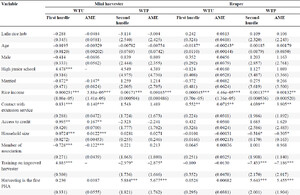
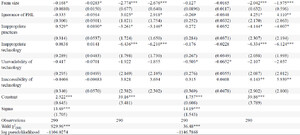
The double hurdle model estimates presented in Table 3 provide insights into the determinants of farmersâ willingness to use the MH service (first hurdle) and their WTP for these services (second hurdle). The analysis is conducted separately for the mini harvester and the reaper harvester, and the table also presents the average marginal effects for the two hurdles.
Determinants of farmersâ willingness to upgrade and WTP for service using mechanized harvesters.
Citation: International Food and Agribusiness Management Review 29, 1 (2026) ; 10.22434/ifamr.1250
Rice income and contact with extension services increase farmersâ likelihood of preferring each of the MH over their traditional methods. Farmers who attended high-junior schools, had access to credit, or received training on improved harvesters were more likely to choose the mini harvester. Additionally, farmers who identified inappropriate practices as the first main cause of PHL were more inclined to prefer the mini harvester. On the other hand, no common factors significantly reduce the likelihood of choosing either MH. However, the results indicate that married farmers, association members, and those with larger farm sizes are less likely to adopt the mini harvester. Additionally, the likelihood of choosing the reaper harvester declines with increasing age, while farmers who perceive a lack of available mechanized harvesting services exhibit a similar reluctance. These findings align with prior studies highlighting the positive effects of access to credit and extension services in technology adoption (e.g., Adegbola and Cornelis, 2007; Gbénou-Sissinto et al., 2018; Horna et al., 2007; Saz-Salazar and Rausell-Köster, 2008; Uaiene, 2011). Similarly, the effects of education and rice income are consistent with Horna et al. (2007) and Gbénou-Sissinto et al. (2018). The positive effect of household size corroborates findings from Horna et al. (2007), who observed a similar trend in Nigeria and Benin regarding improved rice varieties.
The second hurdle estimates show the partial effect of each independent variable on farmersâ WTP. Rice income has a positive and statistically significant impact on WTP for both technologies, although its economic significance remains limited. This result is consistent with findings of Saz-Salazar and Rausell-Köster (2008), who found income to be a key determinant for Spanish consumersâ valuation of urban green areas. Similarly, Horna et al. (2007) concluded that higher income levels positively affect farmersâ preferences for improved production technologies in Nigeria. Given that technology adoption requires financial investment, this relationship is not surprising. Farmers who perceive harvesting as the most important postharvest activity or ignorance of PHL as the main cause of PHL pay more for the mini harvester and the reaper services. On average, those who consider harvesting as the most critical postharvest activity are willing to pay USD 5.68 more for the mini harvester services and USD 5.46 more for the reaper services. Likewise, those who attribute PHL to ignorance are willing to pay an additional USD 2.92 for the mini harvester and USD 4.11 for the reaper compared to farmers with different perspectives. Farmers in contact with extension services who think that inaccessibility of technology is the first cause of PHL were willing to pay a premium of USD 3.90 for the reaper and USD 5.94 for the mini harvester. These effects are in line with findings of Uaiene (2011), Saz-Salazar and Rausell-Köster (2008), and Horna et al. (2007).
However, some factors are negatively correlated with farmersâ WTP. The farm size has a decreasing and highly significant effect on WTP, as each additional hectare in rice farm size reduces WTP by USD 2.68 for the mini harvester services and USD 1.98 for the reaper services. This result is similar to those of Gbénou-Sissinto et al. (2018) for improved storage technology in Benin, suggesting that larger-scale farmers expect price reductions for mechanized services. Moreover, farmers who perceived appropriate postharvest practices and the use of inappropriate technologies also discount the maximum amount they are willing to pay for the services. Specifically, for the reaper services, two additional variables contribute to lower farmersâ WTP. First, household size negatively affects WTP, with each additional member reducing WTP by USD 0.31 on average. Although this effect is barely statistically significant, it has modest economic importance. Second, farmers trained on improved harvesters are willing to pay USD 7.19 less for harvesting services using the reaper. This result suggests that training programs may help farmers realize the cost-effectiveness of mechanized harvesting, leading them to adjust their perceived value of the service.
5.4 Demand elasticity
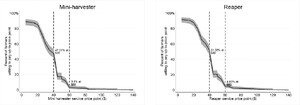
The demand curves for mechanized harvesting services using the mini harvester and reaper harvester, respectively, are presented in Figure 3. To estimate demand elasticity, we applied the arc elasticity method, which is particularly suited for cases where price differences are substantial. This approach also ensures consistency in elasticity estimates, preventing distortions as demand shifts between different price points along the curve. The proportion of farmers (SE in parentheses) demanding harvesting service at a price of USD 40/ha is 47.59% (8.3%) for mini harvester and 51.38% (8.57%) for the reaper. When the price increases to USD 60/ha, these proportions decline sharply to 3.1% (9.44%) and 4.85% (8.6%), respectively. The estimated price elasticity of demand for the mini harvester service is â4.39%, meaning that a 1% increase in the service price leads to a 4.39% decrease in demand when the price ranges from USD 40 to USD 60. Similarly, the elasticity of demand for the reaper harvester is â4.14%, indicating that a 1% increase in the price results in a 4.14% decline in demand over the same price range. These values suggest that demand for mechanized harvesting services is highly elastic, meaning that farmers are highly responsive to changes in services costs. These elasticities are similar to the findings of Channa et al. (2019), who reported a price elasticity of â4.3 for the Purdue Improved Crop Storage (PICS) bag in Kenya. However, based on the demand curves, the demand is highly elastic up to the price of USD 60. Afterward, it appears to be less responsive to price change. These findings underscore the importance of pricing policies in promoting mechanized harvesting adoption. Given the high price sensitivity, subsidies, price reductions, or alternative financing mechanisms could significantly increase the uptake of mechanized harvesting technologies. Policymakers and service providers should consider tiered pricing strategies, rental models, or cost-sharing initiatives to enhance affordability and encourage broader adoption among smallholder farmers.
(Left) Proportion of farmers demanding harvesting service. (Right) Proportion of farmers demanding harvesting service using mini harvester at different price levels using reaper at different price levels. The estimates represent the proportion of respondents willing to pay at or above a given price. The gray shaded region represents 95% confidence interval.
Citation: International Food and Agribusiness Management Review 29, 1 (2026) ; 10.22434/ifamr.1250
The study has three main limitations. First, we used a hypothetical experiment to elicit WTP. Even though hypothetical bias is ubiquitous in stated preferences approaches (Durand-Morat et al., 2016; Fang et al., 2021), hypothetical studies yield similar results compared to non-hypothetical preferences methods, particularly when the experiment design is appropriate, pertinent, and suitable for respondents (Fuster et al. 2021), as it is the case in this study. Most studies in the agricultural economics literature show that hypothetical bias tends to inflate WTP (Penn and Hu, 2018, 2019). This means that farmersâ WTPs reported in this paper are likely higher than their actual WTPs, amplifying their discount rate relative to the cost of harvesting service using TH. Second, the study is limited in geographical scope, as it focuses on only three states, restricting the generalization of the findings to the national level. Finally, we collected our data in 2017, and it is possible that farmersâ behavior regarding MH may have changed over the last years. However, in line with the slow change in mechanization adoption over the past decades (Daum and Birner, 2020; Takeshima and Lawal, 2020), we expect negligible change in farmersâ responses. Since this study only focused on the services themselves, future research could investigate farmersâ valuation for mechanized harvestersâ attributes.
6. Conclusion and policy implications
Post-harvest losses in Nigeriaâs rice value chain significantly undermine food security. We investigate the factors that influence rice farmersâ preferences and willingness to pay for mechanized harvesting services, focusing on two mechanical harvesters, the reaper and the mini harvester in Nigeria. We also estimate the own-price elasticity of demand for these services to assess farmersâ price responsiveness.
Results show that most farmers prefer mechanized harvesting services over manual harvesting services, with the reaper being the most favored option. However, despite their preference, farmers highly discounted their WTP, indicating affordability constraints. Both socio-economic characteristics and perceptions related to PHL significantly influence their choices and WTP. Furthermore, the demand for mechanized harvesting services exhibits high price elasticity, meaning that even modest price fluctuations can significantly impact adoption rates.
Our findings have important policy implications for enhancing food security in Nigeria. First, we provide evidence that rice income, contact with extension services, and access to credit are all positively associated with farmersâ preferences for harvesting services using mechanized harvesters. Increasing income from rice production could indirectly stimulate mechanization adoption, as more financially secure farmers are better positioned to invest in productivity-enhancing technologies. To facilitate this, targeted agricultural programs aimed at increasing rice farmersâ earnings should be prioritized. Furthermore, specific financing schemes, in collaboration with private agribusinesses, development organizations, and government agencies, could be designed to help farmers overcome financial barriers. Credit mechanisms tailored for small-scale farmers, including low-interest loans and leasing options, could improve affordability and encourage adoption. Access to credit and financial assistance would empower farmers to invest in mechanized harvesting, thereby increasing rice production and food availability, which are crucial to national food security. Additionally, we show that farmersâ perceptions about the primary causes of PHL have a considerable impact on their WTP for the mechanized services. Extension programs could address this by offering community-based and field-based training to improve farmersâ understanding of mechanized harvesting advantages. For instance, Castelein et al. (2022) found that adopting the reaper could offset its cost through yield gain, leading to profits of USD 140.36 (â¦50â 531)/ha. However, many farmers may not be aware of these potential gains, highlighting the need for targeted training programs. Capacity-building initiatives for lead farmers and opinion leaders in rice-production areas could further reinforce mechanization knowledge dissemination and promote widespread adoption.
Second, we report that farmersâ WTP for mechanized harvesting service is lower than the estimated market price, and that demand is highly price sensitive. This suggests government institutions, development organizations, and other non-profit entities should explore subsidy programs to bridge the affordability gap.
Current estimates suggest that renting a reaper costs around USD 48.61 (â¦17â 500), excluding fuel and labor costs (Castelein et al., 2022). Given that this price exceeds many farmersâ WTPs, a pricing mismatch between suppliers and demand-side affordability is evident. Without intervention, private service providers may struggle to reach widespread adoption. Subsidies could play a significant role in reducing costs and enabling private service providers to set a price aligned with smallholder farmersâ WTP. In Nigeria, tractors subsidies have been implemented for several years (Daum and Birner, 2020), and a similar subsidy model for MH could be introduced. Moreover, given the high price elasticity of demand, price adjustments should be made cautiously and only when the adoption rate has reached a sustainable level. Financial support for service providers should also be considered to encourage long-term investment in mechanization services, ensuring an adequate supply of mechanized harvesting options.
Overall, by addressing key barriers to mechanized harvesting adoption, strategic policy interventions could significantly reduce PHL in Nigeriaâs rice sector. Given that up to 25% of total losses occur during harvesting, improving mechanization rates would directly contribute to increase domestic rice production, reduce reliance on imports and enhance national food security.
Our study is the first to investigate the demand for mechanized harvesting services among small-scale farmers in the rice value chain in Nigeria. Future research could extend this analysis in several ways. First, exploring farmersâ preferences and WTP for postharvest technologies, including MH, in a non-hypothetical market setting would enhance the accuracy of demand estimation. Second, analyzing the supply-side dynamics â such as the willingness of youth to engage in mechanized harvesting as an agribusiness â could provide insights into how services provision could be expended. A deeper understanding of private sector engagement and business models for mechanization services would be valuable for designing effective mechanization policies.
Acknowledgements
We are grateful for the CGIAR Rice Agri-food system CRP (RICE) program for funding this research. The authors declare no conflicts of interest.
References
Abass, A.B., G. Ndunguru, P. Mamiro, B. Alenkhe, N. Mlingi and M. Bekunda. 2014. Post-harvest food losses in a maize-based farming system of semi-arid savannah area of Tanzania. Journal of Stored Products Research 57: 49â57.
Adegbola, P., and G. Cornelis. 2007. The effect of information sources on technology adoption and modification decisions. Agricultural Economics 37(1): 55â65.
Adesina, A.A., and J. Baidu-Forson. 1995. Farmersâ perceptions and adoption of new agricultural technology: evidence from analysis in Burkina Faso and Guinea, West Africa. Agricultural Economics 13: 1â9.
Adesina, A.A. and M.M. Zinnah. 1993. Technology characteristics, farmersâ perceptions and adoption decisions: a Tobit model application in Sierra Leone. Agricultural Economics 9: 297â311.
Affognon, H., C. Mutungi, P. Sanginga and C. Borgemeister. 2015. Unpacking postharvest losses in sub-Saharan Africa: a meta-analysis. World Development 66: 49â68.
Alade, A. 2023. 7 months after commissioning, Imota mill produces only 50,000 bags of rice. Daily Trust, available online at https://dailytrust.com/7-months-after-commissioning-imota-mill-produces-only-50000-bags-of-rice/ (accessed 8 February 2025).
Amemiya, T. 1984. Tobit models: A survey. Journal of Econometrics 24: 3â61.
Bokusheva, R., R. Finger, M. Fischler, R. Berlin, Y. MarÃn, F. Pérez and F. Paiz. 2012. Factors determining the adoption and impact of a postharvest storage technology. Food Security 4(2): 279â293.
Bora, G.C. and G.K. Hansen, 2007. Low cost mechanical aid for rice harvesting. Journal of Applied Sciences 7(23): 3815â3818.
Boxall, P.C., W.L. Adamowicz, J. Swait, M. Williams and J. Louviere. 1996. A comparison of stated preference methods for environmental valuation. Ecological Economics 18(3): 243â253.
Cadoni, P. and F. Angelucci. 2013. Analysis of incentives and disincentives for Rice in Nigeria. FAO, Rome.
Carson, R.T.C. 2012. Contingent valuation: a practical alternative when prices arenât available. The Journal of Economic Perspectives 26(4): 27â42.
Carson, R.T., and J.J. Louviere. 2011. A common nomenclature for stated preference elicitation approaches. Environmental and Resource Economics 49(4): 539â559.
Castelein, R.B., J. J. Broeze, M.M. Kok, H.H. Axmann, X.X. Guo and J.H. Soethoudt. 2022. Mechanization in rice farming reduces greenhouse gas emissions, food losses, and constitutes a positive business case for smallholder farmersâResults from a controlled experiment in Nigeria. Cleaner Engineering and Technology 8: 100487.
Channa, H., A.Z. Chen, P. Pina, J. Ricker-Gilbert and D. Stein . 2019. What drives smallholder farmersâ willingness to pay for a new farm technology? Evidence from an experimental auction in Kenya. Food Policy 85: 64â71.
Daum, T. and R. Birner. 2020. Agricultural mechanization in Africa: Myths, realities and an emerging research agenda. Global Food Security 26: 100393.
Demont, M. 2013. Reversing urban bias in African rice markets: A review of 19 National Rice Development Strategies. Global Food Security 2(3): 172â181.
Demont, M., E. Zossou, P. Rutsaert, M. Ndour, P. Van Mele and W. Verbeke. 2012. Consumer valuation of improved rice parboiling technologies in Benin. Food Quality and Preference 23(1): 63â70.
Diagne, M., M. Demont and M. Ndour. 2017. What is the value of rice fragrance? Consumer evidence from Senegal. African Journal of Agricultural and Resource Economics 12(2): 99â110.
Durand-Morat, A., E.J. Wailes and R.M. Nayga Jr. 2016. Challenges of conducting contingent valuation studies in developing countries. American Journal of Agricultural Economics 98(2): 597â609.
Fang, D., R.M. Nayga Jr, G.H. West, C. Bazzani, W. Yang, B.C. Lok, C.E. Levy and H.A. Snell. 2021. On the use of virtual reality in mitigating hypothetical bias in choice experiments. American Journal of Agricultural Economics 103(1): 142â161.
Fuster, A., G. Kaplan and B. Zafar. 2021. What would you do with $500? Spending responses to gains, losses, news, and loans. The Review of Economic Studies 88(4): 1760â1795.
Gbénou-Sissinto, E., Y.P. Adegbola, G. Biaou and R.C. Zossou. 2018. Farmersâ willingness to pay for new storage technologies for maize in northern and central Benin. Sustainability 10(8): 2925.
Goshu, D., B. Kassa and M. Ketema. 2013. Is food security enhanced by agricultural technologies in rural Ethiopia? African Journal of Agricultural and Resource Economics 8(1): 58â68.
Grolleaud, M. 2002. Post-harvest losses: discovering the full story. FAO, Rome.
Hodges, R.J., J.C. Buzby and B. Bennett. 2011. Postharvest losses and waste in developed and less developed countries: opportunities to improve resource use. The Journal of Agricultural Science 149(S1): 37â45.
Horna, J.D., M. Smale and M. Von Oppen. 2007. Farmer willingness to pay for seed-related information: rice varieties in Nigeria and Benin. Environment and Development Economics 12(6): 799â825.
Houessionon, P., W.M. Fonta, A.Y. Bossa, S. Sanfo, N. Thiombiano, P. Zahonogo, T.B. Yameogo and B. Balana. 2017. Economic valuation of ecosystem services from small-scale agricultural management interventions in Burkina Faso: A discrete choice experiment approach. Sustainability 9(9): 1672.
Iwayemi, Z. 2023. 10 things you need to know about the Imota Rice Mill. Nairametrics, available online at https://nairametrics.com/2023/01/28/10-things-you-need-to-know-about-the-imota-rice-mill/ (accessed 8 February 2025).
IRRI. n.d. Reaping. IRRI, available online at http://www.knowledgebank.irri.org/step-by-step-production/postharvest/harvesting/harvesting-operations/reaping#mechanical-cutting (accessed 3 April 2017).
Kader, A.A. (2013). Postharvest technology of horticultural crops â An overview from farm to fork. Ethiopian Journal of Applied Science and Technology (1): 1â8.
Kamai, N., L. Omoigui, A. Kamara and F. Ekeleme. 2020. Guide to rice production in Northern Nigeria. International Institute of Tropical Agriculture, Ibadan.
Kumar, D., and P. Kalita. 2017. Reducing postharvest losses during storage of grain crops to strengthen food security in developing countries. Foods 6(1): 8.
Kok, M. and H. Snel. 2019. Food loss measurements in the rice supply chain of Olam Nigeria: Analysis of the pilot study results. Wageningen University and Research Report WCDI 19-084-43. WUR, Wageningen.
Lazaridou, D., A. Michailidis and K. Mattas. 2019. Evaluating the willingness to pay for using recycled water for irrigation. Sustainability 11(19): 5220.
McFadden, D. 1986. The choice theory approach to market research. Marketing Science 5(4): 275â297.
Mendelsohn, R. 2019. An examination of recent revealed preference valuation methods and results. Review of Environmental Economics and Policy 13(2): 267â282.
Ogundele, F. 2022. Post harvest losses and food security in Nigeria: an empirical review. Food Science 5(3): 77â89.
Oguntade, A.E., D. Thylmann and S. Deimling. 2014. Post-harvest losses of rice in Nigeria and their ecological footprint. GIZ, Bonn.
Okello, A.O., D.J. Otieno, J.M. Nzuma, M.M. Kidoido and C.M. Tanga. 2023. Smallholder farmersâ willingness to pay for commercial insect-based chicken feed in Kenya. International Food and Agribusiness Management Review 26: 67â87.
Paudel, G. P., D.B. Kc, N.P. Khanal, S.E. Justice and A.J. McDonald. 2019. Smallholder farmersâ willingness to pay for scale-appropriate farm mechanization: Evidence from the mid-hills of Nepal. Technology in Society 59: 101196.
Penn, J.M. and W.Y. Hu. 2018. Understanding hypothetical bias: an enhanced meta-analysis. American Journal of Agricultural Economics 100: 1186â1206.
Penn, J.M. and W.Y. Hu. 2019. Cheap talk efficacy under potential and actual hypothetical bias: a meta-analysis. Journal of Environmental Economics and Management 96: 22â35.
Sani, A., U. Ibrahim and S. Ibrahim. 2022. Analysis of post-harvest losses and technical efficiency of rice farmers in Middle Rima Valley Irrigation Scheme (Mrvis), Sokoto State, Nigeria. FUDMA Journal of Agriculture and Agricultural Technology 8(1): 142â150.
Saz-Salazar, S.D. and P. Rausell-Köster. 2008. A Double-Hurdle model of urban green areas valuation: dealing with zero responses. Landscape and Urban Planning 84(3): 241â251.
StataCorp. 2015. Stata Survival Analysis Reference Manual, Release 14. StataCorp, College Station, TX.
Stigler, G.J. 1950. The development of utility theory. I. Journal of Political Economy 58: 307â327.
Schulze, W.D., R.C. Dâarge and D.S. Brookshire. 1981. Valuing environmental commodities: some recent experiments. Land Economics 57: 151â172.
Takeshima, H. and A. Lawal. 2020. Evolution of agricultural mechanization in Nigeria. In X. Diao and H. Takeshima, and X. Zhang (eds), An evolving paradigm of agricultural mechanization development: How much can Africa learn from Asia. IFPRI, Washington, DC, pp. 423â456.
Thurstone, L.L. 1927. A law of comparative judgment. Psychological Review 34(4): 273â286.
Train, K.E. 2009. Discrete choice methods with simulation, 2nd edn. Cambridge University Press, Cambridge.
Uaiene, R.N. 2011. Determinants of agricultural technology adoption in Mozambique. Paper read at the 10th African Crop Science Conference, 10â13 October 2011, Maputo, Mozambique.
Willis, K.G. 2002. Iterative bid design in contingent valuation and the estimation of the revenue maximising price for a cultural good. Journal of Cultural Economics 26(4): 307â324.
Corresponding author
Harvesting is an important phase in the postharvest system since it marks the beginning of a series of logically related functions after production operations. Furthermore, it has a considerable impact on the final yield and quality of the final product (Affognon et al., 2015).
For more information on Rice Development Hub, see https://www.africarice.org/rice-sector-development-hubs.
1 USD=â¦360. Naira (â¦) is the local currency.


