Abstract
In light of the achievement gap that widened during the pandemic, this study aimed to develop a diagnostic assessment for teachers to identify students at risk of underachievement. Based on the national curriculum and assessment criteria as a framework, attributes composing achievement criteria were identified and micro-level learning progressions were established about three core ideas in physical science. Through iterative reviews, 116 items were developed and administered, resulting in 355 responses from primary and lower secondary school students. Student responses to most of the items were consistent with the levels of assessment criteria, showing a micro-level learning progression. A few inconsistencies provided insight into modifying learning progressions to align with students’ thinking patterns. They also showed learning challenges that require extra support for student learning. Implications for teacher professional development and further research topics are suggested.
1 Introduction
Polarization in student achievement has emerged as a social problem in South Korea over the last 2 decades as academic calendars have been disrupted due to the emergence of the coronavirus pandemic (COVID-19). Considering the social distancing required to reduce the spread of the disease, face-to-face classes in schools were reduced and partially replaced with online classes that students could take at home, where parental or guardians’ support and study-conducive environments are a prerequisite. Inequality in learning opportunities quickly became an issue of public concern, and these concerns ended up being realized. According to recent national academic achievement evaluation reports, the proportion of Level 1 achievement, which corresponds to below grade-level achievement, increased between 2019 and 2020 in various subjects: in lower secondary school Korean language evaluations from 4.1% to 6.4%; in lower secondary school math evaluations, from 11.8% to 13.4%; and in lower secondary school science evaluations, from 8.4% to 9.8%. The level of outstanding achievement during that period, however, increased from 4.5% to 8.7%, showing a marked polarization in academic achievement (Ahn et al., 2020; Kim et al., 2021).
There have been many studies on diagnosis and treatment of underachievement in language and mathematics education, but little research has been conducted in science education (Chou, 2017; Kim & Park, 2010). Underachievement in science learning is a matter of equity in the current society. Since daily life is full of scientific phenomena that require understanding and proper decision making, a lack of basic knowledge of science deprives students of the potential to fully enjoy their lives (VanUitert et al., 2022). Thus, all science students should be equipped with the basic knowledge and skills for functional scientific literacy. In this regard, the recent increase in students’ underachievement below the grade level in South Korea has raised a national concern. One of the ways to address the problem in the classroom is to identify underachieving students and discover the learning challenges they have and then tailor instruction to the needs of students.
Students’ achievement is measured by assessments based on the curriculum students are supposed to learn in schools. Research on students’ conceptions and reasoning skills can inform the starting points of students’ science learning, whereas the analysis of knowledge and practices of science can provide the end goal of science learning in the curriculum. Students’ understanding lies between these two points during the learning process, and learning progression (LP) is conceptualized as pathways from the starting conceptions and skills to the learning goal taught in schools (Duschl et al., 2007). By informing teachers what students grasp with ease and what challenges they face in learning specific topics in the science classroom, LP can help teachers know what they can anticipate from students during science instruction. Thus, teachers can tailor teaching moves to students’ learning needs.
Research on LPs has been conducted on various topics, but most of the studies have examined cross-grade curriculum standards rather than within-grade or within-unit progressions (Fulmer et al., 2014; Jung et al., 2020; Kaldaras et al., 2021; Morell et al., 2017; Todd et al., 2017; Yao et al., 2017). Furthermore, low rungs of the ladder of LP are rarely sophisticated enough for identifying underachieving students and discovering learning challenges they have and for tailoring instruction to the needs of students.
This study aimed to identify students at risk of underachieving in science and their learning challenges so that teachers can provide proper intervention to prevent students from falling behind curricular standards. For this goal, we first developed assessment items in alignment with the curricular goals to see if students’ achievement patterns were consistent with the LPs assumed in the curriculum. For the assessment, we analyzed cut scores for teachers to use in identifying students at risk of struggling in learning science. By analyzing students’ responses to the items, we also identified learning challenges that students have in the LP.
2 Literature Review
2.1 Science Learning Progression
Decades of research on science learning demonstrates that students bring various cognitive assets to the science classroom such as preconceptions, ideas about the nature of science, and reasoning skills about the physical world (Duschl et al., 2007; Hammer & Elby, 2003; Smith et al., 1993). The pathways of these cognitive assets moving to the learning goals specified in the curriculum have been studied as LPs. Thus, LPs involve both top-down (analysis of disciplinary structures and methods) and bottom-up (analysis of students’ conceptions and learning trajectories) analyses of student learning in science and examine student achievement on the way.
The notion of LP emphasizes core ideas, in other words, overarching theoretical frameworks of science areas, around which pathways of student learning and the scope and sequence of the science curriculum need to be built. In doing so, LPs in several core scientific ideas such as energy, nature of matter, genetics, force and motion, and ecosystems have been researched (Alonzo & Steedle, 2009; Fulmer et al., 2014; Jung et al., 2020; Kaldaras et al., 2021; Kim et al., 2016; Morell et al., 2017; Todd et al., 2017; Yao et al., 2017). These studies have addressed topics by unit (e.g., Alonzo & Steedle, 2009), by years of secondary school (e.g., Todd et al., 2017), or by school level (e.g., Fulmer et al., 2014; Smith et al., 2006). These different grain sizes have different implications in that LPs of larger grain sizes are useful for sequencing content in the curriculum and large-scale assessments whereas LPs of small grain sizes are useful for instructional design and classroom assessment (Harris et al., 2022).
While LPs, whether validated or hypothesized, are rooted in empirical studies about student learning, the scope and sequence of science curricula are rooted in the analysis of disciplinary structures and educational policy agendas centered around personal growth and national or state competitiveness. Thus, curricular learning goals provide upper anchors for LPs, while LPs show the most probable ways of reaching learning goals through classroom instruction. Thus, not only research on LPs but also analysis of curricular goals and content are necessary for understanding student progress in science learning through classroom instruction.
The Next Generation Science Standards (NGSS) of the United States provides an early example of LPs guiding science curriculum development (NGSS Lead States, 2013). How LPs were used in the NGSS was elaborated in its framework (National Research Council, 2012). The framework presented scientific and engineering practices (SEPs), crosscutting concepts, and core ideas in four areas: physical sciences, life sciences, earth and space sciences, and engineering, technology, and applications of science. For example, five core ideas were presented in physical science: matter and its interactions, motion and stability, force and interactions, energy, and waves and their applications in technologies for information transfer. Each of these core ideas has components such as forces and motion, types of interactions, and electromagnetic radiation. These components were further divided in the NGSS as performance expectations and sequenced across four grade bands (K–2, 3–5, 6–8, 9–12) in combination with scientific and engineering practices and crosscutting concepts. Most of these sequences, however, were hypothetical rather than empirically validated trajectories of students’ actual learning.
Since LPs are defined as students’ learning pathways from naïve to more sophisticated competence in science through instruction, students’ learning opportunities are influential in their actual learning trajectories. In this sense, there is an issue of fairness in that not all LPs in a topic can be established with consideration of various learning opportunities students may have (Harris et al., 2022). Thus, given the learning goals set by the nation or state, not only LPs but also proper instructional interventions for all students need to be promoted.
Most LPs currently available have shown the macro-level trends that can guide sequencing science competencies in the curriculum, but few have shown micro-level trends that can guide classroom teaching for a unit, a semester, or a year. Alonzo and Steedle’s (2009) study is one of the few that showed a unit scale LP. In their study about force and motion LP for lower secondary school grades, they found five levels: off track (Level 0); force is recognized but not necessarily related to motion (Level 1); force is related to motion acting in the same direction (Level 2); the net force is understood in moving and nonmoving objects (Level 3); and the net force is related to acceleration (Level 4). Among those levels, only level 4 connotes completely scientifically sound ideas about force and motion. With the addition of two-dimensional motion to the LP developed by Alonzo and Steedle, Fulmer et al. (2014) examined the LPs of upper secondary school and university non science-major students, finding that few high school students achieved Level 4, and Levels 1 and 2 were difficult to distinguish in the data, implying reconsideration of the low levels of LP. Similarly, Level 0 was not addressed in either study, completely leaving out those who do not understand items about force and motion at the secondary level. More sophisticated LP at the lower level would help teachers facilitate students who are below average in lesson progress. Similarly, Kaldaras et al.’s (2020) study of electrostatics LP for ninth graders demonstrated insensitivity to assessing lower-level understandings. Taken together, not only the grain sizes defined as the period for an LP but also the grain sizes defined as how many conceptual jumps are made between levels need to be carefully examined so that LPs can assess all levels with similar sensitivity.
Gao et al.’s (2020) approach to studying the LP of buoyancy demonstrates a way to make the LP model more sensitive to lower-level understanding. The study examined students’ learning of buoyancy taught in eighth grade science. They used seven fine-grained attributes that compose the concept in a hierarchy (e.g., the direction of buoyant force and the force acting on a floating object) and found four levels of understanding that have a different number of attributes to reach each level. In doing so, the levels show the degree of completeness of students’ understanding, allowing teachers to easily identify how to move students’ levels along the LP by addressing missing attributes. The attribute approach would be a way to refine low levels of LP.
In identifying the LP of buoyancy using attributes, Gao et al. (2020) reported the influence of the curriculum that students experienced. Since the students had learned density the prior year, they found that the only attribute mastered by students at the lowest level was density. This was different from the hypothesized LP. As LP is defined as students’ learning pathways from their existing states to the goal states through classroom instruction, the influence of the curriculum that students experience is expected. Thus, in understanding students’ learning pathways there should be consideration of the curriculum they experience. Alternatively, LPs should be established along with the curriculum that students learn.
2.2 Science Achievement Polarization
The onset of the COVID-19 in 2020 created major disruptions in schooling based on mass face-to-face interactions. Most schools initially closed their buildings, later adopting online or distance learning in some form or another, while some schools coordinated online and offline classes in a hybrid learning format (e.g., Bailey et al., 2021; Kang & Seo, 2021). In the face of such an unprecedented event, schools within and across nations and states responded differently, particularly given the variance in their infrastructure for online schooling. School systems with the infrastructure to conduct online classes were better positioned to respond quickly to the pandemic situation, managing to provide quality learning opportunities that others, lacking the infrastructure, were unable to. Similarly, at the individual student level, those from economically advantaged families with the resources required by pandemic situations were able to continue learning. The pandemic, therefore, exacerbated existing achievement gaps due to different socioeconomic statuses (Hammerstein et al., 2021; Schult et al., 2022). When online or distance learning is offered, students with insufficient or unstable access to the internet, those without connected devices, and/or those lacking a proper learning environment at home have poor learning opportunities. Estimates of how the pandemic affected students’ academic achievement have shown that school closures or online learning systems did not necessarily have a negative impact on all students (Bailey et al., 2021; Meeter, 2021; Schult et al., 2022). In some cases, distance learning seems to have facilitated the learning of students who had additional support from their families or proper educational technologies, resulting in higher achievement compared to traditional schooling. Thus, the achievement gap widened more than ever.
Morgan et al. (2016) discussed three possible paths to science achievement gaps: stable, cumulative, or compensatory trajectories. Children’s lack of exposure to science long before learning it in school leads to an early achievement gap, which remains stable over time. Additionally, these initial gaps in achievement can be exacerbated over time if science learning in school is of poor quality. However, supportive or compensatory learning opportunities can help decrease early achievement gaps. In longitudinal data from the United States, Morgan et al. (2016) found that early science achievement gaps remained stable, pointing to the importance of early remediation in closing achievement gaps. In the same vein, the considerable learning loss from educational disruptions due to the pandemic situation needs to be attended to promptly and properly.
The differential effects of schooling during the pandemic on students’ science achievement have been observed in South Korea. As described in the Introduction, recent national science achievement evaluation results found that the proportion of students who were achieving below the standards increased while the proportion of students who were achieving above the standards also increased, resulting in a polarization of academic achievement (Ahn et al., 2020; Kim et al., 2021). To address the polarization of science achievement, it is important to diagnose where students fail to meet the standards and figure out how to guide them toward curricular learning goals. This study aims to develop a diagnostic tool for teachers to identify students who are on the verge of falling behind in the pathways to curricular learning goals and provide proper intervention to close the gap.
3 Methods
3.1 Diagnostic Assessment Development
3.1.1 The Science Curriculum and LP
South Korea has adopted a national curriculum that provides the basis for all textbooks approved by the Ministry of Education. Thus, students are expected to learn the content of the curriculum in the scope and sequence manifested in science textbooks. For this study, the research team examined primary and lower secondary school science curricula (Grades 3 to 9) along with corresponding textbooks to choose core ideas addressed in physical science. Force and Motion (FM), Heat and Energy (HE), and states of matter (SM) were identified as core ideas that are addressed across the years of compulsory science courses. In the curriculum, components of each core idea are presented as achievement criteria clustered and sequenced as a unit for each grade. These achievement criteria supply upper anchors of LPs for each unit for the grade (Appendix A).
3.1.2 Assessment Framework
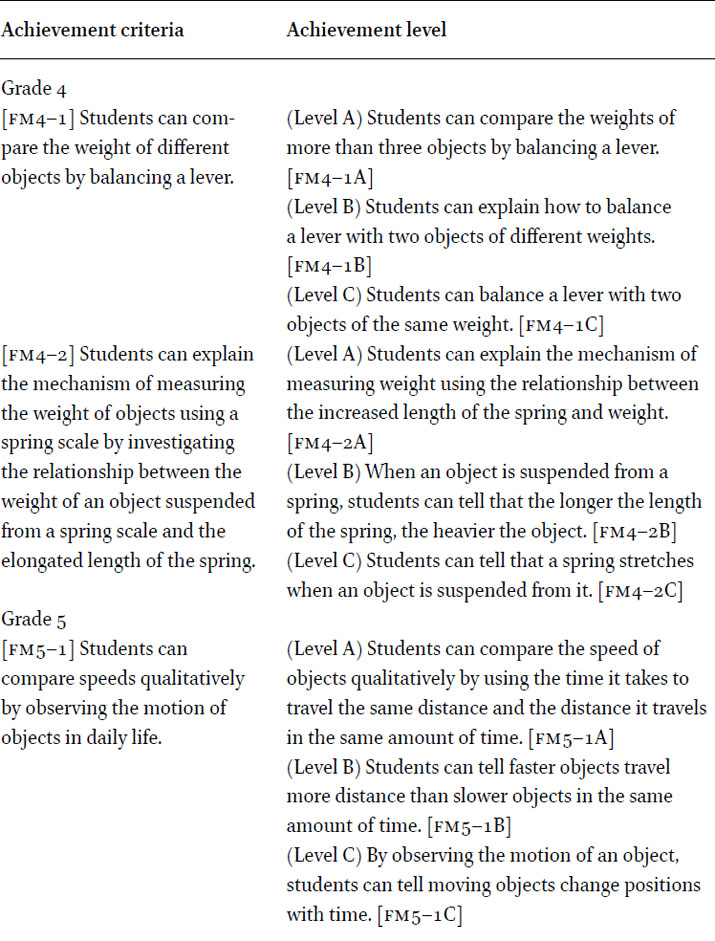
For the yearly implementation of national academic achievement evaluation, the Korea Institute of Curriculum and Evaluation developed assessment criteria that divided each achievement criterion into three levels of achievement (Kim, Lee et al., 2016): meeting the criterion (Level A), approaching the criterion (Level B), and below the criterion (Level C). These assessment criteria were based on both the sequences of the curriculum content and science learning research results (Kim, Lee et al., 2016). An example is provided in Appendix B.
In identifying the LP of core ideas in a unit for each grade, we applied the notion of attributes (Gao et al., 2020), in that each core idea for a grade is a collection of achievement criteria and each achievement criterion is a collection of achievement Levels A, B, and C. Then, achievement criteria and the levels are hierarchically related (Figure 1). In creating a diagnostic tool for identifying students at risk, the study focused on lower achievement levels for each grade. Therefore, we culled Levels B and C of each achievement criterion as assessment frameworks for developing diagnostic items.

Attribute hierarchy example for Force and Motion (partial)
Citation: Asia-Pacific Science Education 8, 2 (2022) ; 10.1163/23641177-bja10049
Since the attributes were connected by the same core idea (e.g., force and motion), achievement levels at the lower grade become the basis of the upper grade. For example, achievement level [FM4–2B] (When an object is suspended from a spring, students can tell that the longer the length of the spring, the heavier the object.) is the achievement Level C of [FM7–1] (Students can tell that the force of gravity pulling an object is the weight of the object.). In this case, assessment items for measuring Level B of a lower grade can be used as assessment items for measuring Level C of an upper grade.
3.1.3 Assessment Item Development
Seven science teachers and university faculty members with science education expertise along with a specialty in physics or chemistry developed assessment items that require knowledge and skills of each achievement level. For each achievement level, three or more items were developed in multiple-choice, short-answer, and true-or-false formats that were appropriate for the knowledge and skills assessed. Items were designed based on stated achievement levels in the curriculum, textbooks, and teacher guides provided by textbook publishers.
Once initial items were developed, three primary teachers and six lower secondary school teachers (three physics and three chemistry teaching certificate holders), each with more than five years of teaching experience, reviewed the items for their readability and difficulty at the different grade levels. In deciding on difficulties of assessment items, teachers were asked whether more than 50% of students would correctly answer the question created for Level B and whether more than 80% of students would answer the items created for Level C. The teachers also determined whether the contexts used in the assessment items would be familiar to students. Items determined to be inappropriate by more than two teachers were revised. The revised items were then reviewed again for meeting the goal of revision. After these iterative review processes, 116 items were finalized (38 items for FM, 32 items for HE, and 46 items for SM). Example items for Levels B and C are provided in Table 1.
Assessment item examples (Force and motion, Grade 4, Levels B and C)
Citation: Asia-Pacific Science Education 8, 2 (2022) ; 10.1163/23641177-bja10049
3.2 Data Collection
3.2.1 Participants
Eight teachers from one primary school and three teachers from two lower secondary schools participated in providing student evaluations and administering the assessment. A total of 355 responses from primary and lower secondary school students were collected. Since the study focuses on students at risk, participants were purposefully recruited from schools located in middle to low socioeconomic areas in two mid-sized cities.
When recruiting the teachers, we explained the purpose of the study and the goal of the data collection, and those who agreed to participate in the study were asked to administer the assessment in a manner such that students understood the diagnostic purpose of the assessment to ensure that test results were not related to course grades. For that reason, neither teachers nor students were provided with the results of the assessment.
3.2.2 Data Source
The teachers were asked to provide their students’ achievement levels by dividing students into three achievement levels: A (100% to 50%), B (50% to 90%), and C (10% or below). These evaluations were first used to validate assessment item difficulties, and we used teachers’ identification of the bottom 10% achievement in deriving cut scores for identifying at-risk students.
The number of student responses from each grade group ranged from 50 to 77. Students responded to the assessment items after they learned the content. They were therefore expected to correctly respond to most of the Level C items that were below the grade level and some or all Level B items according to how much of that content they had mastered in the science classroom. If students failed to respond to Level C items, they could be identified to be at risk and needed supplementary intervention. To quantify this, we assigned 1 point for a correct answer to a Level C item and 2 points for the correct answer to a Level B item.
3.3 Data Analysis
First, descriptive statistics and correct answer rates were examined. Then, to obtain cut scores we conducted receiver operating characteristic (ROC) curve analyses. ROC curve analysis was conducted in the R statistical environment using the pROC package (Robin et al., 2011; Weinberg et al., 2020). ROC curve analysis is a method for deriving cut scores for determining membership between two groups (e.g., underachieving or other) and is a dominant method for identifying students with learning difficulties (Clemens et al., 2016). In identifying students at risk, accuracy refers to correctly classifying students who turn out to be at risk (true positives) and not at risk (true negatives). Because not all screening is perfect, some proportion of students will be wrongly classified. Thus, cut scores should be determined to maximize the proportion of students who are really at risk (true positives) among those classified as at-risk students (sensitivity), or they should be determined to maximize the proportion of students who are actually not at risk (true negatives) among those classified as not at risk (specificity). An ROC curve is a plot of the rate of true positives against the rate of false positives across a range of potential cut scores. Each point on the curve represents a sensitivity (true positive rate) and a specificity (true negative rate) pair. A perfect classification means the area under curve (AUC) = 1, while AUC = 0.7 means there is a 70% chance that the model distinguishes between positive and negative groups. According to Hosmer et al. (2013), an AUC value between 0.7 and 0.8 is acceptable, between 0.8 and 0.9 is excellent, and above 0.9 is outstanding in the discrimination of the two groups (VanDerHeyden et al., 2017, p. 177).
To use cut scores in identifying students at risk, cut scores should be obtained for each grade level and for each unit of the grade. Thus, ROC curve analyses were conducted by grade and by unit.
4 Results
4.1 Descriptive Statistics
Consistent with the intended design, student scores were relatively high in that students of all grades gained mean scores that were more than 70% of the full score. The highest mean was 84% of the full score (Table 2).
Descriptive results
Citation: Asia-Pacific Science Education 8, 2 (2022) ; 10.1163/23641177-bja10049
4.2 Achievement Patterns and LPs Assumed in the Curriculum
4.2.1 Individual Item Analysis
We examined the correct answer rates of each item to validate predetermined difficulty levels based on the LPs assumed. By design, items of Level C were expected to have more than 80% correct answer rates, and items of Level B were expected to have above 50% correct answer rates. Also, for the same achievement criterion, correct answer rates of Level C items should be higher than those of Level B items.
Out of 116 items, 10 items showed much lower correct answer rates than assumed, showing inconsistency between achievement patterns and the LPs assumed in the curriculum. Thus, these items informed what students experienced with difficulties, how to modify LPs for the unit, teaching approaches, and additional interventions in teaching. In one case of the force and motion learning goal (FM9–3), one item designed as Level C obtained 48.0%. The item was about if acting force on an object resulting in no motion would qualify as scientific work. This was in contrast with above 80% of correct answer rates in items where objects move. Scientific work occurs if there is movement in the direction of the force. Students seem to be able to easily apply the definition to situations when objects move, even not in the direction of force, but they have difficulty in applying it to situations where objects are not moving. A twist on the definition or alternative framing challenges students. Thus, assessment criteria that require this kind of thinking should be considered challenging. Knowledge structure and student thinking patterns should be taken into consideration in creating learning sequences and achievement levels. In this case, understanding work related to moving objects would qualify for the basic level of achievement while understanding work related to objects that are standing still even with force would qualify for the upper level of achievement.
Other inconsistent cases included learning goals in heat and energy (HE8–1) and states of matter (SM7–3). They were designed as Level B but had correct answer rates of a little more than 20%. These items asked students to explain heat conduction or changes of states with a particle model, which turned out to be too challenging. The low correct answer rates indicate using the particle model for explaining physical changes at the middle school level is more challenging than expected. A finer division of achievement levels about using particle models for explaining phenomena might better support students learning, which in turn suggested a revision of LP regarding particle models of matter. Regardless, the data suggest that students need special support in learning the particle model.
4.2.2 Achievement Level Analysis
Sets of items at each level were examined and several inconsistencies with the LP expectations were found (Table 3). First, there were achievement criteria where correct answer rates at Level C were akin to those found for Level B. Item sets for [FM4–2], [FM9–4], [HE5–2], and [SM4–2] were such cases. In the case of [FM4–2], which is about using the spring scale to understand the concept of weight, 93–100% of students correctly answered questions at Levels B and C. This seems to be an easy topic for the fourth graders. On the other hand, seventh-grade students (FM7–1) responded to items about weight and gravity (78.8% for a Level B item) and weight and mass (55.8% for a Level B item) as expected. Thus, the achievement expectation for the fourth grade on the topic of weight should be raised for appropriate challenges.
Inconsistent correct answer rates: Achievement level analysis
Citation: Asia-Pacific Science Education 8, 2 (2022) ; 10.1163/23641177-bja10049
In the case of [HE5–2], which is about thermal equilibrium, students also performed very similarly in both Level B and Level C items. The two levels were distinguished by an understanding of thermal equilibrium, an understanding of temperature changes as the lower level, and an understanding of thermal equilibrium as the upper level. However, the correct answer rates of items for both levels were mixed in that the correct answer rates of two items at Level B were higher than expected (83.1% each), whereas the correct answer rate of one item at Level C was lower than expected (76.3%; Table 3). Looking at the patterns of student answers, students performed well when asked about thermal equilibrium between the same materials. For students, thermal equilibrium in mixing hot and cold water was straightforward. However, they had difficulties in understanding the thermal equilibrium between two different objects (e.g., boiled eggs cooling in water). Therefore, the achievement levels need to be distinguished not by the conceptual structure but by their applications or context of applications.
Another pattern was that some students were confused by the question phrase, “The temperature of ice increases when contacting …” by showing a correct response rate of 69.5%, which is much lower than those of the other items. The result implies that students are unfamiliar with different temperatures of ice.
Taken together, understanding thermal equilibrium depended on application cases. Concerning this topic, therefore, applicable cases need to be considered in dividing achievement levels rather than conceptual structures.
In the case of [FM9–4] and [SM4–2], certain concepts assumed at the same level seemed to be different to students. As for [FM9–4], correct response rates of items about kinetic energy are consistently higher than those of items about gravitational potential energy, implying a need for revising the LP. Instead of combining the two concepts into one level, the lowest level needs to be about kinetic energy, and the next level can be the transformation between kinetic and potential energy with an emphasis on potential energy. Similarly, in the case of [SM4–2], correct response rates of items about boiling were consistently higher than those of items about evaporation. Instead of combining the two concepts into one level, they should be distinguished as having different levels of challenges. Boiling needs to be assigned to the lowest level, and evaporation and comparison with boiling need to be at the next level. Both of these cases seem to suggest that observable phenomena (kinetic energy and boiling) are easier for students to understand.
There were instances where correct answer rates of Level C items were lower than those of Level B. Item sets for [FM5–1] and [SM3–3] were such cases. In the case of [FM5–1], students were able to compare the speed of objects in motion much better than they were able to identify moving objects in daily life. The Level C items asked students to choose those objects in the picture that were in motion, meaning those that changed their positions after some time lapse. The Level B items asked students to compare different speeds where all objects were moving. Students did better at Level B items than Level C items, indicating that teaching must have focused more on the speed of moving objects rather than on identifying the meaning of motion.
In the case of [SM3–3], the achievement criteria included a combination of conceptual understanding (gas has weight) and experimental design for measuring the weight of the gas. Student answers showed that questions about experimental design (e.g., this experiment is about the weight of what?) were more difficult than questions about conceptual understanding (e.g., predicting experimental results). This is the reverse of the expected achievement levels. Even though the assessment items utilized experiments addressed in students’ textbooks, students showed that they had difficulties understanding the experimental design. This might reveal a lack of opportunities for students to learn about the experiment.
4.3 Cut Score
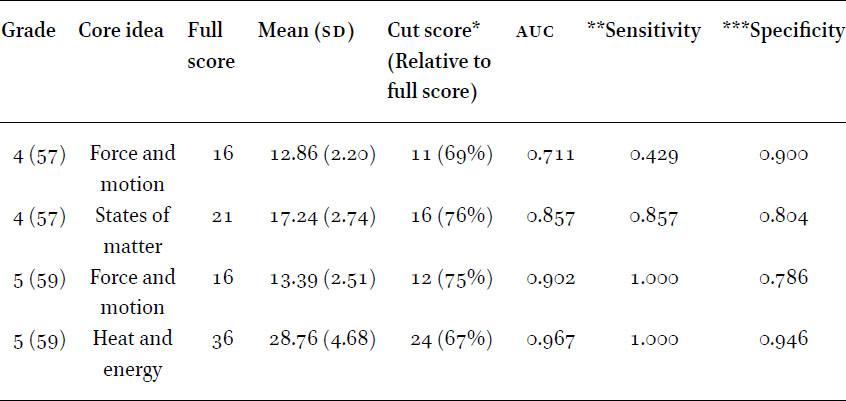
To identify students at risk, cut scores should be obtained for each grade level and each unit. ROC curve analyses by grade were conducted and the optimal AUC was determined. Each AUC turned out to be larger than 0.8 (Table 4), meaning the assessment tool could be useful for identifying students at risk. Likewise, the sensitivity of most cases was very high. Exemplary ROC curves that had the smallest and the largest AUC are shown in Figure 2.
Cut score by grade
Citation: Asia-Pacific Science Education 8, 2 (2022) ; 10.1163/23641177-bja10049
Exemplary ROC curves (third and fifth grades)
Citation: Asia-Pacific Science Education 8, 2 (2022) ; 10.1163/23641177-bja10049
Cut score by unit
Citation: Asia-Pacific Science Education 8, 2 (2022) ; 10.1163/23641177-bja10049
Among the assessment for each grade, the fourth-, fifth-, and seventh-grade assessments address two core ideas, meaning two instructional units. Among these, the fourth- and the fifth-grade assessments have enough items for ROC curve analyses. Thus, we obtained cut scores by instructional unit for two grades (Table 5). The relatively low AUC of the fourth grade force and motion unit might be due to the ease that students had in solving spring scale problems resulting in less discrimination power.
The cut score for each grade level can be used to identify students at risk near the end of the school year and then provide supplementary intervention before students move on to the next grade, while the cut scores for units can be used when teachers want to identify students at risk quickly after finishing a unit and provide supplementary intervention.
5 Discussion
Given the achievement gap that widened during the pandemic, this study developed assessment tools for teachers to identify students at risk of struggling in learning science. Based on the national curriculum and assessment criteria, attributes composing achievement criteria were identified and micro-level LPs were established about three core ideas in physical science. Through iterative reviews, 116 items were developed and administered resulting in 355 responses from primary and lower secondary school students.
Student answers to most of the items were consistent with the achievement levels based on the curriculum, showing LPs were mostly aligned with the expected achievement levels. On the other hand, a few inconsistencies provided insight into modifying LPs to be in alignment with students’ thinking patterns and showed challenging topics required for extra instructional support as summarized in the considerations noted in Appendix A. First of all, students demonstrated difficulties in solving problems that were framed atypically. Similarly, they showed different levels of achievement across application contexts. Thus, LPs should consider not only the conceptual levels but also how problems are framed or contextualized. Conversely, teachers should pay attention to introducing various ways of conceptualization and diverse contexts of applying concepts so that students grasp concepts as generalizable across various contexts.
Regarding challenging topics, particle models for explaining macroscopic phenomena turned out to be more challenging than expected. This is consistent with the previous research findings that applying particle models for explaining physical changes is challenging to lower secondary school students and might have multidimensional progression routes (Morell et al., 2017). A fine-grained division of achievement levels on this topic should be developed while teachers should be on alert to that they may need to provide additional support when teaching this topic. In contrast, the use of the spring scale for understanding gravitational force in the fourth-grade achievement criterion turned out to be easy, indicating more challenging levels should be added to the learning pathway.
The findings also showed that in learning certain concepts students demonstrated challenges different from disciplinary structures: kinetic energy vs. potential energy, boiling vs. evaporation, comparing speed vs. identifying objects in motion, and work done on moving objects vs. standing still objects. Whereas these sets of concepts are considered to be at the same level of disciplinary hierarchy, students understood one more easily than the other. Students seemed to understand concepts drawn from conspicuous phenomena with more ease. However, this might also be because instruction on those topics tends to focus on dynamic aspects such as comparing various speeds and calculating work done. Thus, students might answer questions about these dynamic phenomena well. In this sense, for example, comparing the speed of objects is easier than differentiating objects in motion from objects not in motion. Knowing this, teachers could anticipate that students need additional support for understanding static aspects of the phenomena under study or avoid heavy focus on the dynamic nature of phenomena.
Taken together, these findings show a need for continuing efforts to identify and refine LPs at the unit level to support student learning. In sequencing topics and lessons, teachers and curriculum developers should pay attention to students’ thinking patterns more than they do to conceptual structures. Diagnostic and formative assessment tools such as the one developed in this study would assist such efforts.
Correct response rates lower than expected in understanding experimental design revealed a need for teaching about experiments for their own sake. This is supported by the findings of other studies about scientific practices manifested in science textbooks used in South Korea. Studies found that science textbooks in South Korea tend to focus on data interpretations and explanations while mostly leaving out opportunities for students to find inquiry problems or design experiments (Kang et al., 2022; Oh & Kang, 2019). This seems related to the finding that students responded to questions about experimental results better than they did questions about experimental design.
Given the lack of attention to lower levels of LP, this study developed assessment items targeting middle and lower levels of achievement criteria. Thus, correct answer rates were relatively higher than in typical tests, but items were still able to distinguish different levels of achievement. More research on lower levels of LP on a micro-scale (e.g., instructional unit) is necessary for understanding the challenges that students at risk have in learning science.
The cut scores in this study were drawn not only to identify students at risk but also to provide targeted intervention to prevent students’ underachievement. Teachers can identify students at risk and analyze their answers to items and thereby understand what they need further support on to meet the achievement criteria. In this sense, professional development for enhancing science teachers’ capabilities to use assessment tools for identifying and supporting students at risk should be promoted. Teachers should understand ways to interpret student responses to the assessment items and come up with ways to provide supplementary learning opportunities when students fail to answer correctly. The teacher learning community would help facilitate developing such competencies from diverse perspectives. Also, teachers should understand the LPs of each core idea so that they know what they can anticipate from students during science instruction (Furtak & Heredia, 2014). This would help teachers be flexible and tailor their instruction to students’ learning needs.
Given that LPs are shaped by instructional interventions, it is not surprising that student responses are aligned with the levels of achievement criteria set by the curriculum sequence. Similar research in other countries with different curricular sequences may demonstrate different LPs. Comparisons of LPs from different curricular contexts would shed light on how instructional interventions are related to LPs.
As a cross-sectional study, this study has a limitation in understanding multi-grade LPs. The findings from the analysis of the inconsistencies between the expected and actual correct answer rates need to be applied to revising some test items and deriving new cut scores. With such revisions, longitudinal studies and cross-units and cross-grades LPs need to be developed.
Abbreviations
| AUC | Area under curve |
| FM | Force and motion |
| HE | Heat and energy |
| LP | Learning progression |
| NGSS | The Next Generation Science Standards |
| ROC | Receiver operating characteristic |
| SM | States of matter |
Ethical Consideration
Approval to conduct this study was granted by the Korea National University of Education Ethics Review Board. The data collected from this project were obtained with the necessary clearance from the partner institutions, guardians, and the students involved in the study.
About the Authors
Nam-Hwa Kang is a professor at the Korea National University of Education (KNUE), Cheongju, South Korea. Before she joined KNUE in 2012, she was an assistant and an associate professor at Oregon State University, Corvallis, Oregon, United States, and an assistant professor at the University of Nevada, Las Vegas, Nevada, United States. Her research centers on science teaching practices in relation to epistemic cognition in science. She has published papers that address connections between science teacher beliefs about science learning, science inquiry, modeling in science, and scientific argumentation and teaching practices. Currently, she is the director of the Innovation Institute for Future Education at KNUE, the editor-in-chief of the journal Innovation and Education, and an associate editor of Asia-Pacific Science Education.
Hyunju Yoon is a physics teacher at Cheongwon High School, Cheongju, South Korea. She received her BS from the Department of Physics Education from KNUE and is currently pursuing her master’s degree in science education at KNUE. Her research interests include physics teaching using programming and physical computing and formative assessment.
References
Ahn, Y., Lee, J., & Kim, D. (2020). 2019 National Academic Achievement Assessment Results-Middle School Science. Korea Institute for Curriculum and Evaluation.
Alonzo, A. C., & Steedle, J. T. (2009). Developing and assessing a force and motion learning progression. Science Education, 93(3), 389–421. https://doi.org/10.1002/sce.20303.
Bailey, D. H., Duncan, G. J., Murnane, R. J., & Au Yeung, N. (2021). Achievement Gaps in the Wake of COVID-19. Educational Researcher, 50(5), 266–275. https://doi.org/10.3102/0013189X211011237.
Chou, C.-C. (2017). An analysis of the 3D video and interactive response approach effects on the science remedial teaching for fourth-grade underachieving students. EURASIA Journal of Mathematics, Science and Technology Education, 13(4), 1060–1073. https://doi.org/10.12973/eurasia.2017.00658a.
Clemens, N. H., Keller-Kargulis, M. A., Scholten, T., & Yoon, M. (2016). Screening assessment within a multi-tiered system of support: Current practices, advances, and next steps. In S. R. Jimerson et al. (eds.), Handbook of Response to Intervention, (pp. 187–214), Springer. DOI 10.1007/978-1-4899-7568-3_12.
Duschl, R. A., Schweingruber, H. A., & Shouse, A. W. (Eds.). (2007). Taking Science to School: Learning and Teaching Science in Grades K-8. National Academy Press.
Furtak, E. M., & Heredia, S. C. (2014). Exploring the influence of learning progressions in two teacher communities. Journal of Research in Science Teaching, 51(8), 982–1020. https://doi.org/10.1002/tea.21156.
Fulmer, G. W., Liang, L. L., & Liu, X. (2014). Applying a force and motion learning progression over an extended time span using the force concept inventory. International Journal of Science Education, 36(17), 2918–2936. https://doi.org/10.1080/09500693.2014.939120.
Gao, Y., Zhai, X., Andersson, B., Zeng, P., & Xin, T. (2020). Developing a Learning Progression of Buoyancy to Model Conceptual Change: A Latent Class and Rule Space Model Analysis. Research in Science Education, 50(4), 1369–1388. https://doi.org/10.1007/s11165-018-9736-5.
Hammer, D., & Elby, A. (2003). Tapping students’ epistemological resources. Journal of the Learning Sciences, 12, 53–91.
Hammerstein, S., König, C., Dreisörner, T., & Frey, A. (2021). Effects of COVID-19-related school closures on student achievement – A systematic review. Frontiers in Psychology, 12, 746289. https://doi.org/10.3389/fpsyg.2021.746289.
Harris, L. R., Adie, L., & Wyatt-Smith, C. (2022). Learning progression – based assessments: A systematic review of student and teacher uses. Review of Educational Research, 1–45. https://doi.org/10.3102/00346543221081552.
Hosmer, Jr., D. W., Lemeshow, S., & Sturdivant, R. X. (2013). Applied Logistic Regression (3rd ed.). Wiley.
Jung, J., Chang, J., & Park, J. (2020). An analysis of different grade levels of elementary school students’ reasoning about the changes of state of water within a learning progression. Asia-Pacific Science Education, 6(2), 548–563. https://doi.org/10.1163/23641177-bja10004.
Kaldaras, L., Akaeze, H., & Krajcik, J. (2021). Developing and validating Next Generation Science Standards-aligned learning progression to track three-dimensional learning of electrical interactions in high school physical science. Journal of Research in Science Teaching, 58(4), 589–618. https://doi.org/10.1002/tea.21672.
Kang, N.-H., Lee, H. R., & Lee, S. (2022). Scientific practices manifested in science textbooks : Middle school science and high school integrated science textbooks for the 2015 Science Curriculum. Journal of Korean Association of Science Education, 42(4), 417–428.
Kang, N.-H., & Seo, J. (2021). Emerging Online Science Teaching Practices: Insights from High School Physics Teaching Cases in South Korea during COVID-19 Pandemic. Asia-Pacific Science Education, 7(2), 343–383. https://doi.org/10.1163/23641177-bja10030.
Kim, Y., Kang, N.-H., Kang, H., Maeng, S., & Lee, J.-K. (2016). Item Response Analysis of Energy as a Cross-Cutting Concept for Grades 3 to 9. Journal of The Korean Association For Science Education, 36(6), 815–833. https://doi.org/10.14697/JKASE.2016.36.6.0815.
Kim, H., Lee, M., Lee, J.-B., Lee, S.-Y., Lee, Y.-R., Kwak, Y. et al., (2016). Research and Development of the Assessment Standards of 2015 Revised National Science Curriculum at the Primary and Middle School Levels. Korea Institute for Curriculum and Evaluation.
Kim, A. H., & Park, H. (2010). Science interventions for students with learning difficulties: A research synthesis. The Journal of Special Education: Theory and Practice, 11(1), 147–175.
Kim, Y., Baek, J., Lee, J. & Kim, D. (2021). 2020 National Academic Achievement Assessment Results-Middle School Science. Korea Institute for Curriculum and Evaluation.
Meeter, M. (2021). Primary school mathematics during the COVID-19 pandemic: No evidence of learning gaps in adaptive practicing results. Trends in Neuroscience and Education, 25, 100163. https://doi.org/10.1016/j.tine.2021.100163.
Morell, L., Collier, T., Black, P., & Wilson, M. (2017). A construct-modeling approach to develop a learning progression of how students understand the structure of matter. Journal of Research in Science Teaching, 54(8), 1024–1048. https://doi.org/10.1002/tea.21397.
Morgan, P. L., Farkas, G., Hillemeier, M. M., & Maczuga, S. (2016). Science achievement gaps begin very early, persist, and are largely explained by modifiable factors. Educational Researcher, 45(1), 18–35. https://doi.org/10.3102/0013189X16633182.
NGSS Lead States. (2013). Next Generation Science Standards: For States, By States. The National Academies. https://www.nextgenscience.org/standards/standards.
National Research Council. (2012). A Framework for K-12 Science Education: Practices, Crosscutting Concepts, and Core Ideas. Washington, DC: Committee on a Conceptual Framework for New K-12 Science Education Standards. Board on Science Education, Division of Behavioral and Social Sciences and Education.
Oh, K., & Kang, N.-H. (2019). Participation patterns of elementary students in scientific problem finding activities. Asia-Pacific Science Education, 5(1), 16. https://doi.org/10.1186/s41029-019-0039-6.
Robin, X., Turck, N., Hainard, A., Tiberti, N., Lisacek, F., Sanchez, J.-C., & Müller, M. (2011). pROC: an open-source package for R and S+ to analyze and compare ROC curves. BMC Bioinformatics, 12(1), 77. https://doi.org/10.1186/1471-2105-12-77.
Schult, J., Mahler, N., Fauth, B., & Lindner, M. A. (2022). Did students learn less during the COVID-19 pandemic? Reading and mathematics competencies before and after the first pandemic wave. School Effectiveness and School Improvement, 1–20. https://doi.org/10.1080/09243453.2022.2061014.
Smith, J. P., diSessa, A. A., & Roschelle, J. (1993). Misconceptions reconceived: A constructivist analysis of knowledge in transition. Journal of the Learning Sciences, 3, 115–163.
Smith, C. L., Wiser, M., Anderson, C. W., & Krajcik, J. (2006). Implications of research on children’s learning for standards and assessment: A proposed learning progression for matter and the atomic-molecular theory. Measurement: Interdisciplinary Research & Perspective, 4(1–2), 1–98. https://doi.org/10.1080/15366367.2006.9678570.
Todd, A., Romine, W. L., & Cook Whitt, K. (2017). Development and validation of the learning progression-based assessment of modern genetics in a high school context. Science Education, 101(1), 32–65. https://doi.org/10.1002/sce.21252.
VanDerHeyden, A. M., Codding, R. S., & Martin, R. (2017). Relative Value of Common Screening Measures in Mathematics. School Psychology Review, 46(1), 65–87. https://doi.org/10.1080/02796015.2017.12087608.
VanUitert, V. J., Kennedy, M. J., Peeples, K. N., Romig, J. E., Mathews, H. M., & Rodgers, W. J. (2022). Enhancing science performance of middle‐school students with and without developmental and behavioral‐based disabilities using the Content Acquisition Podcast Professional Development approach. Journal of Research in Science Teaching. https://doi.org/10.1002/tea.21808.
Weinberg, S. L., Harel, D. & Abramowitz, S. K. (2020). Statistics Using R: An Integrated Approach. Cambridge.
Yao, J. X., Guo, Y. Y., & Neumann, K. (2017). Refining a learning progression of energy. International Journal of Science Education, 39(17), 2361–2381. https://doi.org/10.1080/09500693.2017.1381356.
Appendices
Appendix A
Learning sequence as assumed learning progression and considerations implied by the results of the study
Citation: Asia-Pacific Science Education 8, 2 (2022) ; 10.1163/23641177-bja10049
Appendix B
Assessment framework of force and motion (FM)
Citation: Asia-Pacific Science Education 8, 2 (2022) ; 10.1163/23641177-bja10049


