Abstract
Cocoon colour in Bombyx mori L. is a genetically determined trait influenced by environmental factors, reflecting the natural pigments embedded in silk proteins, which may have potential applications in the feed and food industry. We quantified cocoon colour across 65 naturally coloured strains belonging to the silkworm germplasm collection of CREA, which were reared over three seasons, and assessed practical systems for colour classification. Colours were measured in CIELAB (D65/10°; SCI/SCE recorded simultaneously), and colour-difference models were benchmarked against human perception via an observer-based grouping task analysed with non-metric MDS. CIEDE2000 model best matched perceptual distances. Two perceptibility thresholds were derived:
1 Introduction
The silkworm (Bombyx mori L.) produces cocoons of various colours, including white, yellow, golden yellow, pinkish, orange and green, which derive from the pigments found in mulberry leaves which the insect feeds on. The pigments found in leaves are first absorbed by the midgut and then conveyed into the haemolymph. Subsequently, they enter the silk glands, where they accumulate and are enclosed in the silk proteins’ layers to finally produce colourful cocoons. Chemical modifications of the pigments can occur during the stages of this process (Tabunoki et al., 2004).
There are essentially two varieties of cocoon colours: those derived from carotenoids (Ma et al., 2015), which are responsible for the yellow-orange colours and are found only in sericin which coats the fibroin base, and those derived from flavonoids (mainly quercetin and kaempferol and their glycosides) (Kurioka and Yamazaki, 2002; Zhu and Zhang, 2014), which are responsible for the green hues and are distributed in both sericin and fibroin. Cocoon colour has long been recognized as a genetically determined trait (Tanaka, 1913), yet the molecular mechanisms underlying this genetic determinism have only recently begun to be elucidated (Daimon et al., 2010; Hirayama et al., 2018; Lu et al., 2023; Tsuchida and Sakudoh, 2015; Zhu and Zhang, 2014).
From an evolutionary perspective, variability in cocoon colour may represent a selective adaptation linked to protective functions. The pigments responsible for colouration possess antibacterial and antioxidant properties, contributing to larval defence against pathogens and oxidative stress during pupation (Dong et al., 2022; Liu et al., 2024). Beyond their ecological role, these pigments are increasingly studied as bioactive compounds with potential practical applications in medicine, nutraceuticals, and cosmetics. This emerging field aligns with the broader concept of entomoceuticals, which refers to health-promoting compounds derived from insects, including proteins, polyphenols, terpenoids, alkaloids, and carotenoids, many of which exhibit anti-inflammatory, antioxidant, antihypertensive, and antidiabetic properties (Liceaga, 2025).
In the case of Bombyx mori, cocoon pigments are primarily associated with sericin, a protein that not only provides structural stability but also carries bioactive molecules and trace elements with therapeutic potential (Biganeh et al., 2022; Wang et al., 2025). Coloured sericin enriched with carotenoids, has been shown to outperform white cocoon sericin in antibacterial, antioxidant, cytocompatibility, and even anticancer activities, due to structural modifications such as increased β-sheet content and hydrogen bonding, which enhance its stability and functional properties (Liu et al. 2024).
Among the carotenoids found in yellow-red cocoons, lutein occurs in a protein-lipid bound form, which is chemically stable and exhibits superior antioxidant activity compared to purified commercial lutein (Manupa et al., 2023). Its bioavailability and stability make it a promising dietary supplement for ocular and cognitive health, with demonstrated protective effects against UV-induced retinal damage (Aimjongjun et al., 2013) and β-amyloid-induced neurotoxicity in neuronal cells, thus suggesting potential in the prevention of age-related macular degeneration and Alzheimer’s disease (Singhrang et al., 2018). In addition, lutein extracts from silk cocoons have shown immunomodulatory effects, enhancing both innate and adaptive immunity beyond what has been observed with marigold-derived lutein (Promphet et al., 2014). The hypoglycaemic potential of sericin-derived oligopeptides (SDOs) from yellow cocoons has been validated in diabetic rat models, where they improved glycaemic control, preserved pancreatic function, and protected multiple organs from diabetes-related damage (Tocharus and Sutheerawattananonda, 2024).
Flavonoid-rich ethanol extracts from green cocoons exhibit strong antioxidant activity together with tyrosinase and α-glucosidase inhibition, whereas highly purified sericin alone shows limited bioactivity (Cao and Zhang, 2016; Wang et al., 2012). These extracts have also been shown to improve glucose metabolism, enhance antioxidant defences, and increase insulin sensitivity in diabetic models, supporting their use in the prevention or management of type 2 diabetes (Tian et al., 2024; Wang et al., 2020; Zhao et al., 2019). Furthermore, flavonoid-sericin conjugates display enhanced antioxidant and anti-inflammatory activities compared with native sericin, expanding their biomedical potential (Omar et al., 2022). Beyond therapeutic applications, coloured cocoon sericin has also been suggested as a natural antioxidant ingredient in functional foods (Takechi et al., 2011). Among the features connected with the green colour is the capacity to protect skin after radiation (Kakihara et al., 2024).
Overall, the bioactivities attributed to cocoon pigments provide strong evidence for their inclusion in functional foods, nutraceuticals, and biomedical applications. Variability in cocoon pigmentation, once considered mainly as an adaptive trait for insect survival, thus emerges as a key reservoir of health-promoting compounds with translational potential for human applications.
Research on natural cocoon colours is particularly relevant also to silk textiles, offering the possibility of producing environmentally sustainable yarns without reliance on synthetic dyes which are a significant cause of pollution (Moore and Ausley, 2004; Robinson et al., 2001).
Furthermore, it should be noted that there is the possibility of producing non-textile silk-based products (Oxman, 2015; Oxman et al., 2013) which, not being subjected to the degumming process, can retain their natural colour.
The renewed interest in cocoon pigmentation underscores the need for precise, standardized colour descriptors in silkworm strain characterization. While pigment chemistry is well studied, quantitative colour analysis has lagged, partly due to environmental influences on this continuous trait. Investigating cocoon colour offers several advantages over biochemical analyses. Instrumental colour measurement is rapid, non-destructive, and scalable; moreover, in many plant-based systems, CIELAB coordinates correlate with underlying pigment content, enabling colour to serve as an informative proxy (Afonso et al., 2017; Ayour et al., 2016; Chen et al., 2023; Conesa et al., 2019; Lancaster et al., 1997; Lu et al., 2021; Singha et al., 1991), and this may also apply to cocoons, whose pigments are entirely plant-derived.
In this study we examine cocoon colorimetric variability across a wide collection of silkworm strains and evaluate whether each strain can be reliably associated with a defined colour or set of colours. We also seek a practical, robust classification framework suitable for strain identification, conservation, and valorisation of sericultural genetic resources.
2 Materials and methods
Silkworm rearing and cocoons preparation
The Sericulture Laboratory of CREA-AA in Padua maintains 177 silkworm strains, constituting the largest germplasm collection currently maintained in Europe. In this collection, 65 strains with naturally coloured cocoons have been studied; they are listed in Table S1 of the Supplementary Materials. Insects are reared under standard conditions on fresh mulberry leaves, harvested daily or stored up to 72 h at 12 °C in the dark. To preserve genetic diversity and limit inbreeding, 400 cocoons are collected annually from each strain. At least 72 mating pairs are set up, producing an equal number of egg batches, which are split into two replicates. One replicate is used to rear the next generation (2.5 g of eggs brushed), while the other is stored as reserve.
Cocoons were de-flossed, cut to extract pupae (preventing moth urine from staining fibres), and stored at 5 °C in the dark until colorimetric measurements, performed within three weeks of spinning.
Most strains were reared in April-May, when mulberry leaves are most abundant, with some reared in September-October to balance workload. The same strains were reared in the same season across the three-year study.
Instrumental colour measurements
Colour assessments were conducted over three consecutive years (2022-2024), with ten cocoons per strain measured in 2022 and 2023, and twenty in 2024. Measurements were performed in the CIE 1976
Measurements were taken on the external surface of each cocoon. A standard 8-mm-diameter measurement aperture was used to define the sample area, with settings configured for a D65 standard illuminant and a 10° standard observer. Measurements were carried out in both specular components included (SCI) and specular component excluded (SCE) modes.
Choosing the best equation for colour difference measurement
Data processing involved calculating colour distance (
The formulae were tested following Gomez-Polo et al. (2016). Twenty participants (8 males, 12 females; 18-60 years) individually sorted 40 cocoons, selected to cover the full colour range of the collection, into perceptual groups of their choice under standard illumination on a neutral grey background. For each participant, results were encoded in a 40 × 40 binary matrix (1 = same group; 0 = different groups). Matrices were summed to obtain an aggregate similarity matrix S, from which a dissimilarity matrix D was derived as
Non-metric Multidimensional Scaling (MDS; Kruskal, 1964) was applied to D using the MASS package in R (v. 7.3-65; R Core Team, 2022; Ripley et al., 2023; Venables and Ripley, 2002). Model fit was assessed with stress (S-stress) and
Pattern detection in
The analysis aimed to identify systematic patterns in colour distribution within and across strains. In the first part of the analysis,
In the second phase of the analysis, the DBSCAN algorithm (Ester et al., 1996) was applied to identify clusters representing regions where colours exhibited a natural tendency to aggregate. DBSCAN detects dense point regions based on distance (𝜀) and minimum points (minPts). As point density varied across colour space, the dataset was partitioned into regions of similar density, and the algorithm was applied separately to each.
Intra- and inter-annual within-strain variability
Intra- and inter-annual chromatic variability was analysed to assess the stability of cocoon colour. Intra-annual variability was quantified by calculating all pairwise
Evaluation of colour classification systems
Instrumental systems such as CIELAB provide precise values but are not intuitive for practical use. Standard references like Pantone® or RAL enable accessible visual classification, differing in resolution: finer categories allow greater discrimination, while broader ones offer tolerance and simplicity. For applied purposes, widely recognised systems are preferable, ideally offering broad coverage, few categories, low within-group variability, and clear separation.
We compared clustering of our dataset (CA – cluster analysis) with the Royal Horticultural Society (RHS) Colour Chart and two derived schemes: RHS-UPOV (UPOV hereafter) and RHS-UCL (UCL hereafter), shortly described below.
RHS colour chart: The RHS Colour Chart (Royal Horticultural Society, 1966) provides a standardised reference for plant variety description and was deemed suitable for cocoon colours, which derive from plant pigments. In this study, RHS codes were assigned to observations using the 2007 edition (892 swatches) and the ColourNameR package (Sánchez Beeckman, 2022) for
UPOV nomenclature: Because the RHS chart is overly detailed for plant variety description, UPOV (International Union for the Protection of New Varieties of Plants, https://www.upov.int) developed a simplified system grouping RHS colours into 73 broad categories (e.g. Pink, Medium Red, Dark Purple), each with standardised names in four languages. UPOV names used here were retrieved with the ColourNameR package.
UCL nomenclature: The Universal Colour Language (UCL), developed by the Inter-Society Color Council-National Bureau of Standards (ISCC-NBS), was used in 1984 by the American Rhododendron Society (ARS) to classify RHS codes (1966 edition) (Huse and Kelly, 1984). These assignments were later revised based on spectrophotometric measurements (Voss, 2002; Voss and Hale, 1998). For the purposes of this study, UCL names corresponding to RHS codes were obtained from the official website of the Office of the American Rhododendron Society (Office of the American Rhododendron Society, 2025).
3 Results
Instrumental measurement results
Mean values of the CIELAB parameters
Evaluation of colour distance formulae
The ranges of colour distances observed in the 40 cocoon samples were as follows: CIE76 (0.52-51.00), CMC (0.27-24.61), CIE94 (0.21-20.00) and CIEDE2000 (0.24-14.71) (not shown). Following this, an MDS analysis was conducted on the perceptual similarity matrix, resulting in a two-dimensional coordinate configuration with a final stress value of 0.084, indicating a good fit.
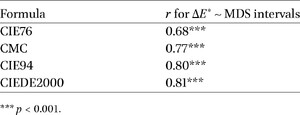
Pairwise Euclidean distances between all cocoon pairs were then computed using the MDS-derived coordinates. These perceptual distances were plotted against the corresponding values from each colour difference formula, and Pearson correlation coefficients (r) were calculated to evaluate the strength of association, as well as their corresponding p-values. The resulting r values are summarised in Table 1.

Pearson’s r correlation coefficients between
Citation: Journal of Insects as Food and Feed 12, 7 (2026) ; 10.1163/23524588-bja10334
CIE76 showed the weakest correlation with perceptual distances obtained from visual assessment, whereas CIEDE2000 achieved the strongest correlation, albeit only marginally outperforming CIE94.
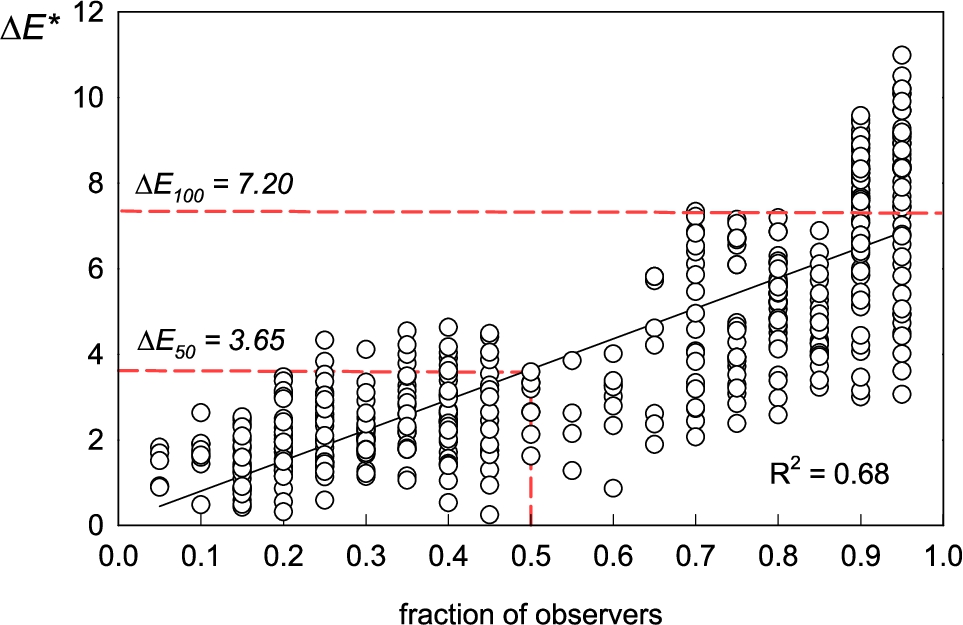
Establishing an acceptability threshold value for colour difference
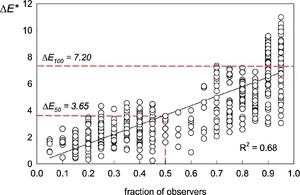
Processed data from the MDS procedure were used to establish reference
Acceptability threshold assessment for cocoon colour differences. x-axis, proportion of observers detecting a difference; y-axis,
Citation: Journal of Insects as Food and Feed 12, 7 (2026) ; 10.1163/23524588-bja10334
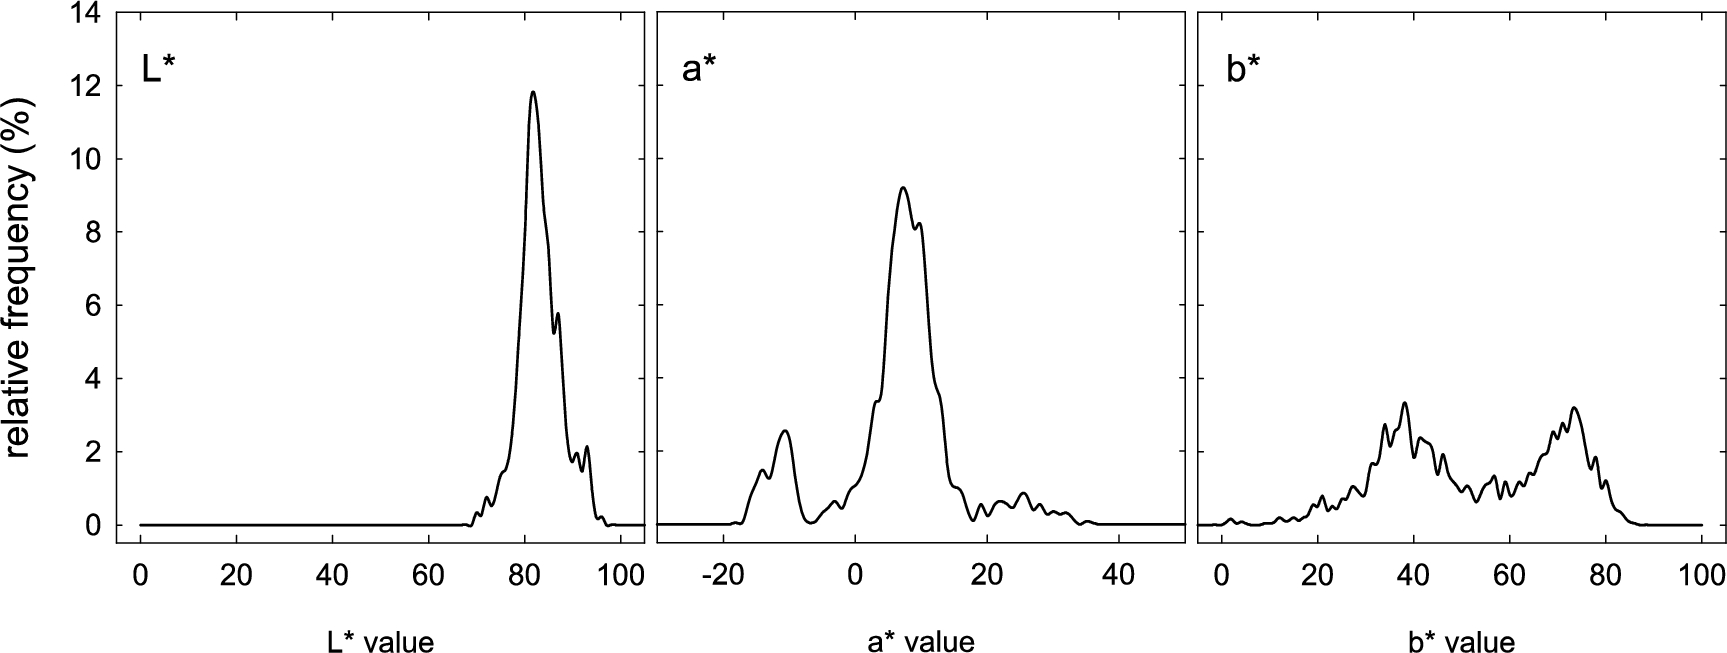
Relative frequency distributions (%) of CIELAB colour coordinates (
Citation: Journal of Insects as Food and Feed 12, 7 (2026) ; 10.1163/23524588-bja10334
Overall variability in the
The relative frequency distributions of the CIELAB parameters (Figure 2) reveal patterns of colour variability across the silkworm cocoon dataset. The
Strain-level analysis of chromatic variation patterns
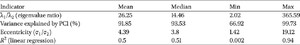
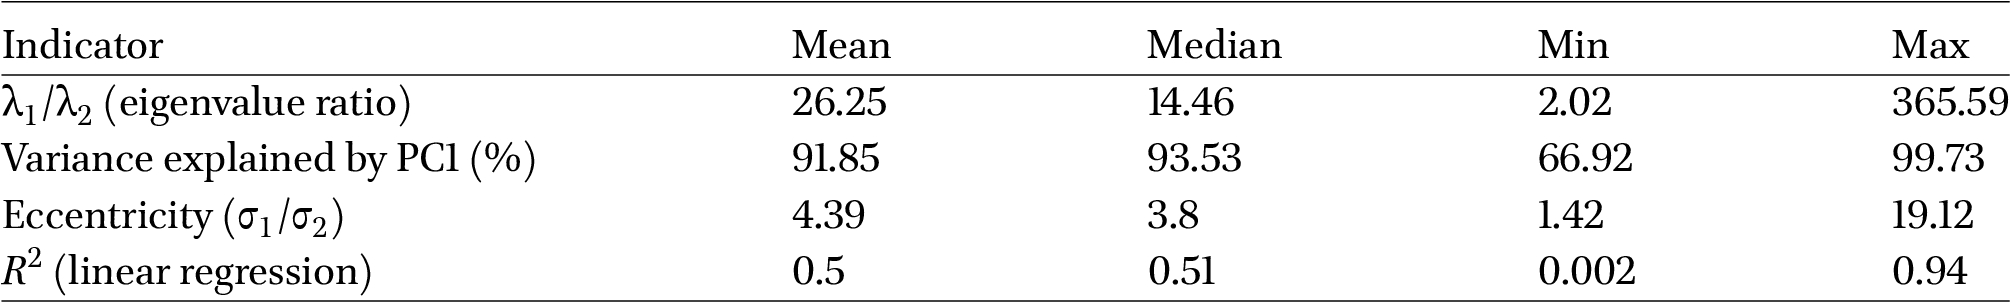
PCA and regression analyses revealed strong linearity in cocoon chromatic data within the
Summary PCA statistics of chromatic distribution indicators within strains
Citation: Journal of Insects as Food and Feed 12, 7 (2026) ; 10.1163/23524588-bja10334
From these results it is clear that most strains exhibited a linear pattern of chromatic variation in the
Figure 3 shows examples of strains exhibiting radial behaviour (Fig. 3A), as well as others displaying non-radial or intermediate patterns (Fig. 3B).
Within-strain colour variation patterns in CIELAB space. Symbols represent different genotypes or groups.
Citation: Journal of Insects as Food and Feed 12, 7 (2026) ; 10.1163/23524588-bja10334
Figure S2 in the Supplementary Materials exemplifies the interannual trend of variation in the
Cluster analysis
A preliminary visual inspection of the distribution of the measurements, based on the projection of points onto the
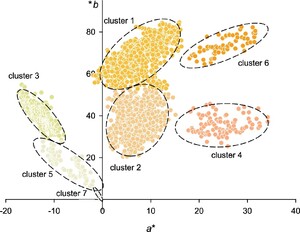
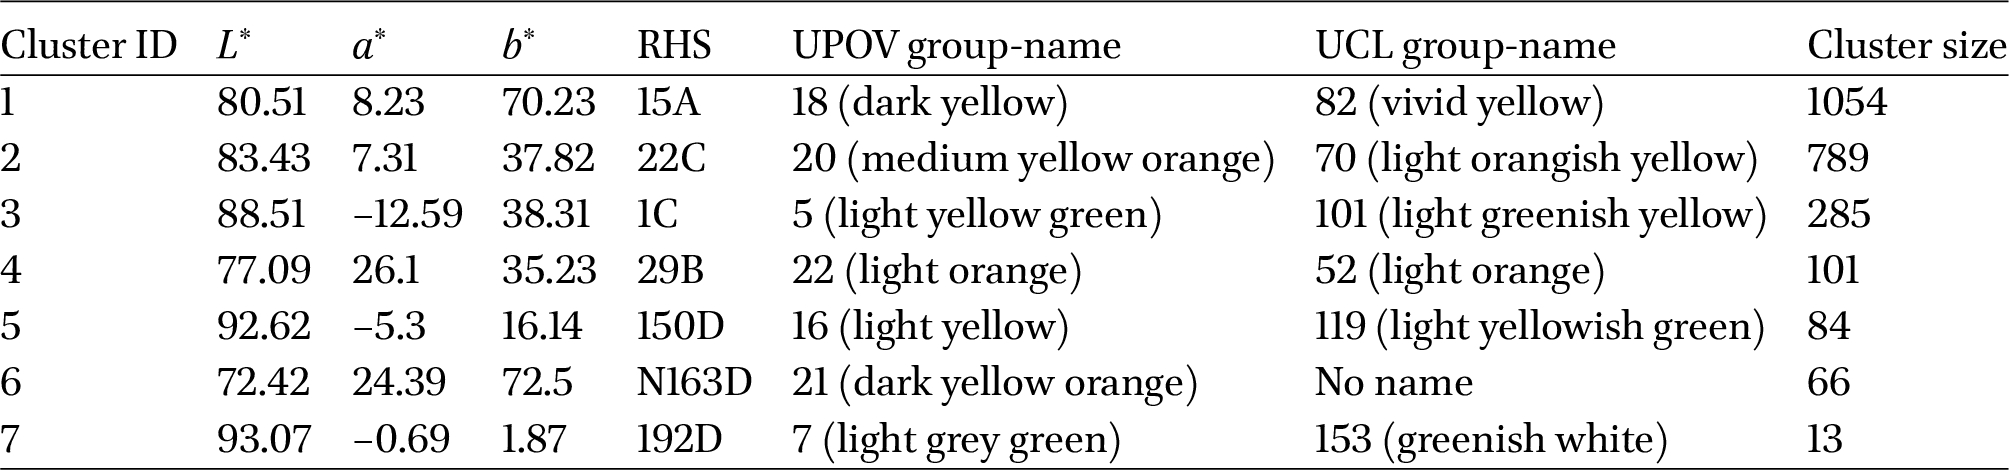
The procedure identified seven clusters, as shown in Figure 4. Each cluster has been assigned the colour of its respective medoid. The colours are rendered after conversion to the sRGB system to provide an approximate visual representation of the chromatic tone. Points classified as “noise” (
Cluster analysis of colour performed using the DBSCAN algorithm. In each cluster, the colour of the symbols corresponds to that of the respective medoids and has been rendered after conversion to sRGB.
Citation: Journal of Insects as Food and Feed 12, 7 (2026) ; 10.1163/23524588-bja10334
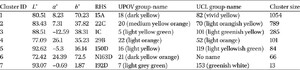
CIELAB of the cluster medoids shown in Fig. 4 and relative colour classification (RHS, UPOV and UCL systems)
Citation: Journal of Insects as Food and Feed 12, 7 (2026) ; 10.1163/23524588-bja10334
Table 3 provides a summary of the characteristics of the identified clusters, with the colour specifications for their medoids, which are the points with the minimum average distance to all other points within the cluster.
To better visualise clusters, they have been enclosed by a 95% confidence ellipse, derived from the covariance matrix of
Overall colour variability described with classification systems
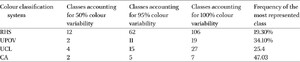
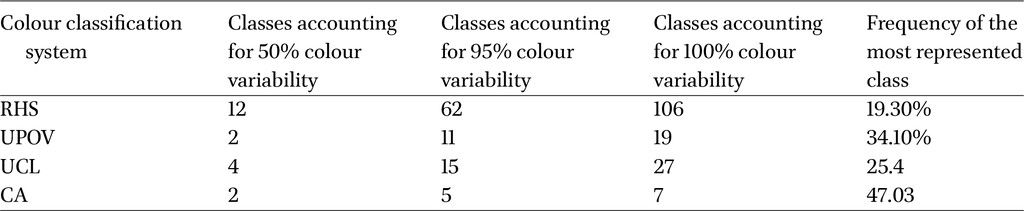
After classification with RHS, UPOV, UCL and CA, notable differences emerged in the number and distribution of categories. The RHS system yielded 106 colours, with 63 covering 95% of observations; the most frequent was “15A” (19.3%). UPOV grouped colours into 19 categories, with 11 covering 95%; “medium yellow orange” was most frequent (34.1%). UCL produced 27 categories, 15 covering 95%, with “vivid yellow” most common (25.4%); one group (2.4%) had “no name” due to missing labels for RHS codes introduced in 2007 (e.g. N144D, N163D, N163C, N25D, N25C). CA produced only 7 classes, but with highly unbalanced representation: one class held 47% of observations, and two classes together explained over half of the variability. Table 4 summarises these results.
Relative frequency (%) of colours accounting for 95% of the dataset observations, classified according to three nomenclature systems: RHS, UPOV, UCL and CA (cluster analysis)
Citation: Journal of Insects as Food and Feed 12, 7 (2026) ; 10.1163/23524588-bja10334
Within-strain variability across intra- and inter-annual scales
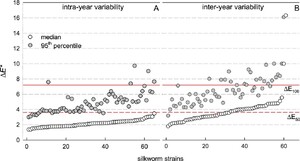
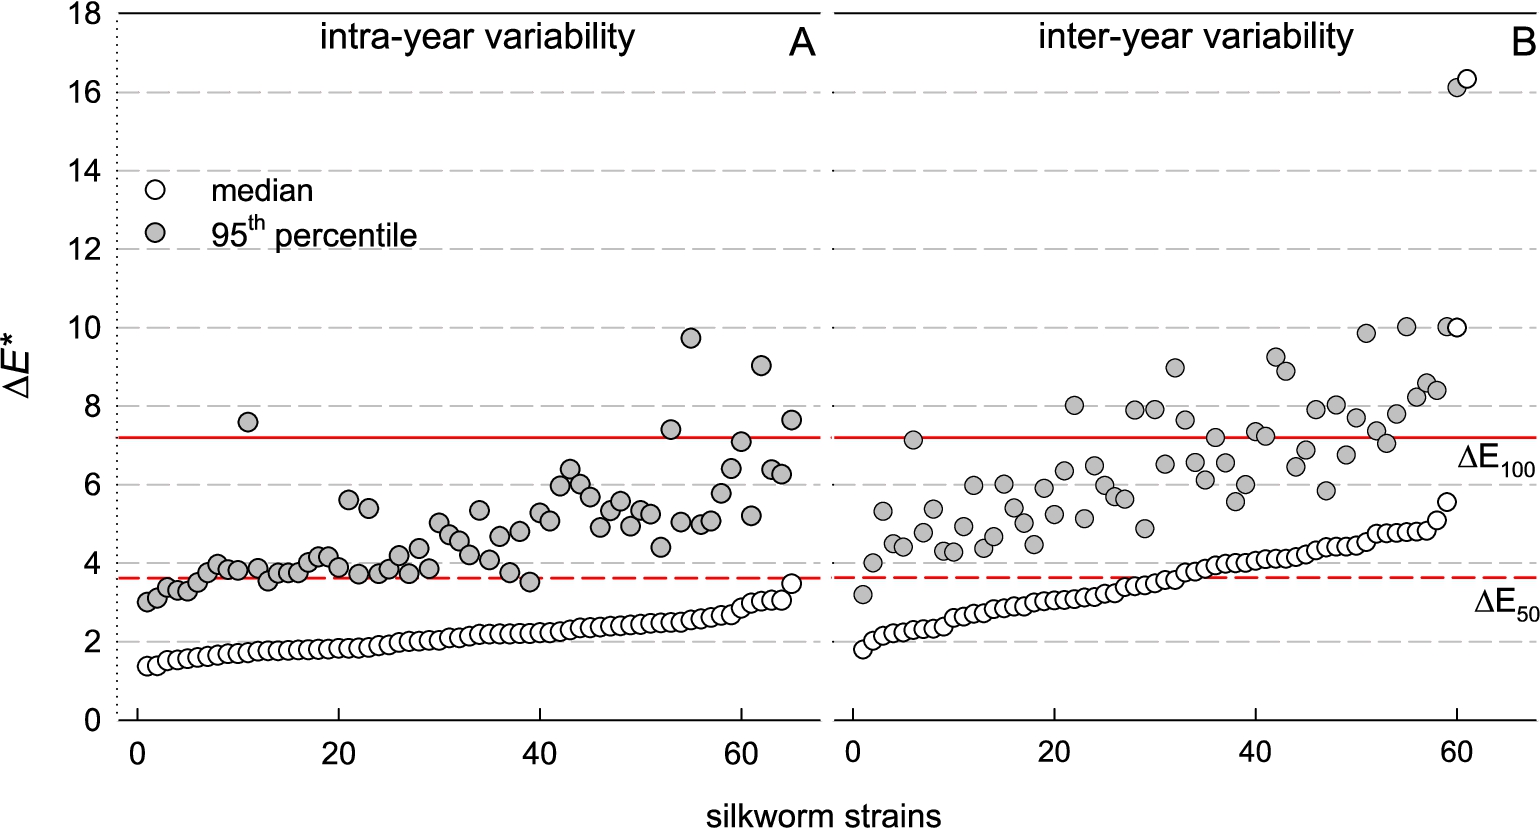
Figure 5 offers a concise summary of pairwise distance distributions across all strains, presenting the medians and 95th percentiles for each, benchmarked against two reference red lines corresponding to
Pairwise within-strain
Citation: Journal of Insects as Food and Feed 12, 7 (2026) ; 10.1163/23524588-bja10334
As for intra-annual variability, all medians fall below the
Inter-annual variability is notably higher. Approximately half of the medians exceed
The ratio between the mean inter-annual distances and the mean intra-annual distance ranged from 0.98 to 2.02 for nearly all strains. Only strains B251 and B102 showed higher ratios of 2.87 and 3.10, respectively (not shown).
Descriptive efficiency of strain colour classification
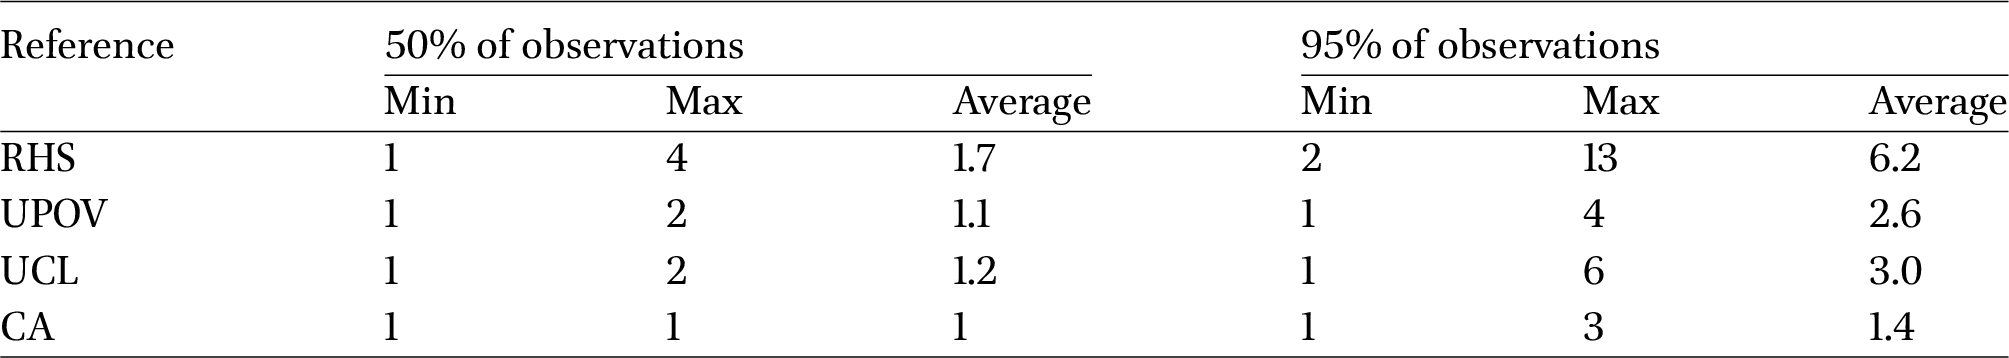
RHS was the system that required the highest number of classes to describe within-strain variability, with an average of 6.2 labels needed to characterise 95% of the cocoons, while just under 2 were sufficient to describe 50% (Table 5). UPOV and UCL showed similar values of 2.6 and 3.0 for the higher variability threshold, and just over one class was needed to describe 50%. As expected, the classification based on the CA-derived groups proved to be the most concise, with an average of 1.4 classes sufficient to account for 95% of the variability within each strain.
Number of colours or colour groups required to account for 50% and 95% of the observations within each silkworm strain
Citation: Journal of Insects as Food and Feed 12, 7 (2026) ; 10.1163/23524588-bja10334
In terms of internal consistency, classification systems are expected to cluster individual measurements into groups with minimal internal variability, such that all observations within a group are perceived by the human eye as the same colour or colour type. In this respect, the RHS classification exhibited the lowest internal variability, with a mean
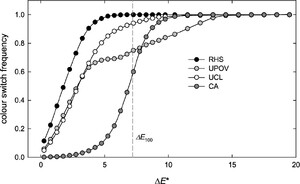
These data can be further analysed as shown in Figure 6, where each pairwise difference in the dataset is associated with the ‘name switch’ frequency, that is, whether the naming system assigns different names or retains the same one at a given
Relationship between distances in colorimetric measurements and the probability of assigning different colour names by four classification systems.
Citation: Journal of Insects as Food and Feed 12, 7 (2026) ; 10.1163/23524588-bja10334
The full range of variation for RHS is contained between
For example, at
4 Discussion
Based on our findings, a thorough description of the cocoon colour variability within a wide-ranging and representative group of silkworm strains can be presented, deriving some useful guidelines about how to implement colorimetric assessment in germplasm characterization for this species.
Measurement geometry and data processing
In colourimetry, similarity between SCI and SCE modes indicates a matte, uniformly textured surface with negligible specular reflection. For silk cocoons, this means the specular component does not affect perceived colour under measurement conditions, ensuring consistent appearance is important for sericulture quality control and textile raw material selection.
The findings from the comparison of CIEDE2000 with alternative formulas utilised in the computation of colour distance corroborate the results reported in other research that examine this formula in contrast to CIE76 and other formulas utilised in distinct domains of application (Gibert et al., 2005; Gomez-Polo et al., 2016; Hauptmann et al., 2012; Luo et al., 2004).
The perceptibility threshold of 3.65 is consistent with other studies using the CIEDE2000 model across diverse fields. Reported tolerance thresholds generally range from 3-10
Overall variability in the
The analysis clearly revealed that measurements were concentrated within specific regions of the colour space. In particular, the patterns observed in the
The ratio between lutein and β-carotene underlies the formation of different hues: where lutein predominates, cocoons exhibit yellow to golden-yellow tones; conversely, a predominance of β-carotene shifts the colour towards orange-pink shades (Liu et al., 2024). In the present study, for yellow-red colouration, we observed two peaks in
For strains producing green cocoons through flavonoid accumulation, variation in green intensity depends both on the total flavonoid content and on the specific types of flavonoid derivatives produced. Mase et al. (2023) demonstrated that light-green and deep-green cocoons differ in both the quantity and quality of their flavonoid content. In other words, a higher concentration of flavonoids results in a darker, more intense green, whereas structural differences in the flavonoids can modify the hue. In our data, the green cocoons are those in which the linear variation in the
In conclusion, the shape of the colour distribution in
Cluster analysis
Clustering patterns were evident by visual inspection, yet algorithmic classification was challenging due to contiguous groups connected by diffuse point clouds, especially in the yellow-orange range. In some cases, points from different clusters were closer than those within the same cluster. Using an 𝜀 threshold of 3.65, seven clusters were identified, though many observations were discarded as noise. While clustering provides a means of grouping colours, the resulting classes are broad and can mask substantial differences, as also noted by Lu et al. (2021). The method may be useful for categorising broad “colour types,” but wider validation across more strains is needed for consistent application.
Colour classification and naming
The suitability of a classification system depends on its ability to capture the observed range of perceptual differences (0-7.2
Within strain colour difference between years
Environmental variability is expected to play a crucial role in the variability of colours, since it primarily influences leaf characteristics, but it can also impact physiology of insects despite they are reared under controlled conditions, with effects on pigment production. In this study, the only environment-related variability factor which could be controlled, is represented by the years, which has proven to be higher respect to the within-year variability.
The observed interannual variability can plausibly be attributed to changes in the biochemical composition of the leaves. Currently, to our knowledge, no specific data are available for mulberry concerning interannual variations in pigment content; however, such patterns have been more extensively investigated in forest species, where fluctuations in leaf biochemistry are often regarded as adaptive traits in response to climatic variability.
For instance, drier years have been shown to cause a decrease in carotenoid content in two Quercus species, (Mészáros et al., 2007), whereas warmer years tend to be associated with higher carotenoid concentrations (Szőllősi et al., 2011). Consistent interannual variation in carotenoids has also been reported for Nothofagus alpina, primarily linked to humidity and shading conditions (Arias-Rios et al., 2022).
Similarly, flavonoids are highly responsive to climatic factors: in Populus tremula, their concentrations increase during years with enhanced UV-B radiation (e.g. years with lower overall cloud cover), but decline under elevated temperature (Randriamanana et al., 2015). A pronounced interannual variability of phenolic compounds, including flavonoids, has likewise been documented in Fagus sylvatica, in association with thermal, water and nutrient stress (Steen et al., 2021)
Whatever the origin of variability, the principal question addressed in this study is whether the observed variability could compromise the stability of colour identification, a factor inherently dependent on the acceptance threshold for colour distance. The present findings indicate that, for the majority of strains, variability remained within acceptable limits when applying the
5 Conclusions
Cocoon colour in Bombyx mori is a genetically determined yet environmentally modulated trait, with potential as a strain marker. Analysis of 65 naturally coloured strains over three seasons showed that intra-strain variability generally remains within the threshold that was identified as the maximum acceptable (
Corresponding author; e-mail: gianni.fila@crea.gov.it
Conflict of interest
The authors have no conflict of interest to declare.
Funding statement
The authors were supported by the ARACNE Project, funded by the European Union’s Horizon Europe research and innovation programme under the Grant Agreement No 101095188.
References
Afonso, T., Moresco, R., Uarrota, V.G., Navarro, B.B., Nunes, E.d.C., Maraschin, M. and Rocha, M., 2017. UV-Vis and CIELAB based chemometric characterization of manihot esculenta carotenoid contents. Journal of Integrative Bioinformatics 14: 2017056. https://doi.org/10.1515/jib-2017-0056
Aimjongjun, S., Sutheerawattananonda, M. and Limpeanchob, N., 2013. Silk lutein extract and its combination with vitamin e reduce UVB-mediated oxidative damage to retinal pigment epithelial cells. Journal of Photochemistry and Photobiology B: Biology 124: 34-41. https://doi.org/10.1016/j.jphotobiol.2013.04.003
Arias-Rios, J.A., El Mujtar, V.A., Pastorino, M. and Marchelli, P., 2022. Genetic variation of leaf pigment content in a southern beech. Trees – Structure and Function 36: 1823-1836. https://doi.org/10.1007/s00468-022-02330-z
Ayour, J., Sagar, M., Alfeddy, M.N., Taourirte, M. and Benichou, M., 2016. Evolution of pigments and their relationship with skin color based on ripening in fruits of different Moroccan genotypes of apricots (Prunus armeniaca L.). Scientia Horticulturae 207: 168-175. https://doi.org/10.1016/j.scienta.2016.05.027
Biganeh, H., Kabiri, M., Zeynalpourfattahi, Y., Costa Brancalhão, R.M., Karimi, M., Shams Ardekani, M.R. and Rahimi, R., 2022. Bombyx mori cocoon as a promising pharmacological agent: A review of ethnopharmacology, chemistry, and biological activities. Heliyon 8: e10496. https://doi.org/10.1016/j.heliyon.2022.e10496
Cao, T.T. and Zhang, Y.Q., 2016. Processing and characterization of silk sericin from Bombyx mori and its application in biomaterials and biomedicines. Materials Science and Engineering C 61: 940-952. https://doi.org/10.1016/j.msec.2015.12.082
Chen, J., Ye, H., Wang, J. and Zhang, L., 2023. Relationship between Anthocyanin Composition and Floral Color of Hibiscus syriacus. Horticulturae 9: 48. https://doi.org/10.3390/horticulturae9010048
CIE, 2019. Colorimetry – Part 4: CIE 1976 L ∗ a ∗ b ∗ colour space. Available online at https://cie.co.at/publications/colorimetry-part-4-cie-1976-lab-colour-space-1
Clarke, F.J.J., McDonald, R. and Rigg, B., 1984. Modification to the JPC79 colour-difference formula. Journal of the Society of Dyers and Colourists 100: 128-132. https://doi.org/10.1111/j.1478-4408.1984.tb00969.x
Conesa, A., Manera, F.C., Brotons, J.M., Fernandez-Zapata, J.C., Simón, I., Simón-Grao, S., Alfosea-Simón, M., Martı́nez Nicolás, J.J., Valverde, J.M. and Garcı́a-Sanchez, F., 2019. Changes in the content of chlorophylls and carotenoids in the rind of Fino 49 lemons during maturation and their relationship with parameters from the CIELAB color space. Scientia Horticulturae 243: 252-260. https://doi.org/10.1016/j.scienta.2018.08.030
Daimon, T., Hirayama, C., Kanai, M., Ruike, Y., Meng, Y., Kosegawa, E., Nakamura, M., Tsujimoto, G., Katsuma, S. and Shimada, T., 2010. The silkworm Green b locus encodes a quercetin 5-O-glucosyltransferase that produces green cocoons with UV-shielding properties. Proceedings of the National Academy of Sciences of the United States of America 107: 11471-11476. https://doi.org/10.1073/pnas.1000479107
Dong, Z., Xia, Q. and Zhao, P., 2022. Antimicrobial components in the cocoon silk of silkworm, Bombyx mori. International Journal of Biological Macromolecules 224: 68-78. https://doi.org/10.1016/j.ijbiomac.2022.10.103
Ester, M., Kriegel, H.-P., Sander, J. and Xu, X., 1996. A density-based algorithm for discovering clusters in large spatial databases with noise. In: Proceedings of the Second International Conference on Knowledge Discovery and Data Mining, 2-4 August 1996, Portland, Oregon, 96, pp. 226-231.
Fernández-Vázquez, R., Stinco, C.M., Hernanz, D., Heredia, F.J. and Vicario, I.M., 2013. Colour training and colour differences thresholds in orange juice. Food Quality and Preference 30: 320-327. https://doi.org/10.1016/j.foodqual.2013.05.018
Ghinea, R., Pérez, M.M., Herrera, L.J., Rivas, M.J., Yebra, A. and Paravina, R.D., 2010. Color difference thresholds in dental ceramics. Journal of Dentistry 38: e57-e64. https://doi.org/10.1016/j.jdent.2010.07.008
Gibert, J.M., Dagà, J.M., Gilabert, E.J., Valldeperas, J. and The Colorimetry Group, 2005. Evaluation of colour difference formulae. Coloration Technology 121: 147-152. https://doi.org/10.1111/j.1478-4408.2005.tb00265.x
Gomez-Polo, M., Portillo, M., Luengo, M., Vicente, P., Galindo, P. and Marı́a, M., 2016. A comparison of the CIELab and CIEDE2000 color difference formulas. The Journal of Prosthetic Dentistry 115: 65-70. https://doi.org/10.1016/j.prosdent.2015.07.001
Hauptmann, M., Pleschberger, H., Mai, C., Follrich, J. and Hansmann, C., 2012. The potential of color measurements with the CIEDE2000 equation in wood science. European Journal of Wood and Wood Products 70: 415-420. https://doi.org/10.1007/s00107-011-0575-6
Hirayama, C., Mase, K., Iizuka, T., Takasu, Y., Okada, E. and Yamamoto, K., 2018. Deficiency of a pyrroline-5-carboxylate reductase produces the yellowish green cocoon ‘Ryokuken’ of the silkworm, Bombyx mori. Heredity 120: 422-436. https://doi.org/10.1038/s41437-018-0051-8
Huse, R.D. and Kelly, K.L., 1984. A Contribution Towards standardization of color names in horticulture: application of the universal color language to the colors of the Royal Horticultural Society’s Colour Chart. The American Rhododendron Society, Tigard, OR.
Kakihara, N., Sato, M., Shirai, A., Koguchi, M., Yamauchi, S., Nakano, T., Sasamoto, R. and Sato, H., 2024. Green cocoon-derived sericin reduces cellular damage caused by radiation in human keratinocytes. Scientific Reports 14: 3068. https://doi.org/10.1038/s41598-024-53712-x
Kruskal, J.B., 1964. Nonmetric multidimensional scaling: a numerical method. Psychometrika 29: 115-129. https://doi.org/10.1007/BF02289694
Kurioka, A. and Yamazaki, M., 2002. Purification and identification of flavonoids from the yellow green cocoon shell (sasamayu) of the silkworm, Bombyx mori. Bioscience, Biotechnology, and Biochemistry 66: 1396-1399. https://doi.org/10.1271/BBB.66.1396
Lancaster, J.E., Lister, C.E., Reay, P.F. and Triggs, C.M., 1997. Influence of pigment composition on skin color in a wide range of fruit and vegetables. Journal of the American Society for Horticultural Science 122: 594-598. https://doi.org/10.21273/JASHS.122.4.594
Liceaga, A.M., 2025. Entomoceuticals: insects as food for health. Journal of Insects as Food and Feed 11: 1859-1865. https://doi.org/10.1163/23524588-20250004
Liu, S., Zhang, Q., Zhou, H., Zhang, B., Yu, M., Wang, Y., Liu, Y. and Chai, C., 2024. The Potential of Natural Carotenoids-Containing Sericin of the Domestic Silkworm Bombyx mori. International Journal of Molecular Sciences 25: 3688. https://doi.org/10.3390/ijms25073688
Lu, C., Li, Y., Wang, J., Qu, J., Chen, Y., Chen, X., Huang, H. and Dai, S., 2021. Flower color classification and correlation between color space values with pigments in potted multiflora chrysanthemum. Scientia Horticulturae 283: 110082. https://doi.org/10.1016/j.scienta.2021.110082
Lu, Y., Luo, J., An, E., Lu, B., Wei, Y., Chen, X., Lu, K., Liang, S., Hu, H., Han, M., He, S., Shen, J., Guo, D., Bu, N., Yang, L., Xu, W., Lu, C., Xiang, Z., Tong, X. and Dai, F., 2023. Deciphering the Genetic Basis of Silkworm Cocoon Colors Provides New Insights into Biological Coloration and Phenotypic Diversification. Molecular Biology and Evolution 40: msad017. https://doi.org/10.1093/molbev/msad017
Luo, M., Minchew, C., Kenyon, P. and Cui, G., 2004. Verification of CIEDE2000 using industrial data. In: Proceedings of Interim Meeting of the International Colour Association (AIC 2004 Colour and Paints), 3-5 November 2004, Porto Alegre, Brazil, pp. 97-102.
Luo, M.R., 2002. Development of colour-difference formulae. Review of Progress in Coloration and Related Topics 32: 28-39. https://doi.org/10.1111/j.1478-4408.2002.tb00248.x
Luo, M.R., Cui, G. and Rigg, B., 2001. The development of the CIE 2000 colour-difference formula: CIEDE2000. Color Research and Application 26: 340-350. https://doi.org/10.1002/col.1049
Ma, M., Hussain, M., Dong, S. and Zhou, W., 2015. Characterization of the pigment in naturally yellow-colored domestic silk. Dyes and Pigments 124: 6-11. https://doi.org/10.1016/j.dyepig.2015.08.003
Manupa, W., Wongthanyakram, J., Jeencham, R. and Sutheerawattananonda, M., 2023. Storage stability and antioxidant activities of lutein extracted from yellow silk cocoons (Bombyx mori) in Thailand. Heliyon 9: e16805. https://doi.org/10.1016/j.heliyon.2023.e16805
Mase, K., Hirayama, C., Narukawa, J., Kuwazaki, S. and Yamamoto, K., 2023. Fine mapping of Green a, Ga, on chromosome 27 in Bombyx mori. Genes and Genetic Systems 98: 239-247. https://doi.org/10.1266/ggs.23-00060
McDonald, R., 1988. Acceptability and Perceptibility decisions using the CMC color difference formula. Textile Chemist and Colorist 20: 31-37.
McDonald, R. and Smith, K.J., 1995. CIE94 – a new colour-difference formula. Journal of the Society of Dyers and Colourists 111: 376-379. https://doi.org/10.1111/j.1478-4408.1995.tb01688.x
Melgosa, M., 2016. CIE94, History, Use, and Performance. In: Luo, M.R. (ed.) Encyclopedia of Color Science and Technology. Springer, New York, NY, pp. 191-195. https://doi.org/10.1007/978-1-4419-8071-7_13
Mészáros, I., Veres, S., Kanalas, P., Oláh, V., Szőllősi, E., Sárvári, É., Lévai, L. and Lakatos, G., 2007. Leaf growth and photosynthetic performance of two co-existing oak species in contrasting growing seasons. Acta Silvatica et Lignaria Hungarica 3: 7-20. https://doi.org/10.37045/aslh-2007-0001
Mokrzycki, W. and Tatol, M., 2011. Colour difference ΔE – a survey. Machine Graphic and Vision 20: 383-411. https://www.researchgate.net/publication/236023905
Moore, S.B. and Ausley, L.W., 2004. Systems thinking and green chemistry in the textile industry: concepts, technologies and benefits. Journal of Cleaner Production 12: 585-601. https://doi.org/10.1016/S0959-6526(03)00058-1
Office of the American Rhododendron Society, 2025. ISCC-NBS Color Names For the Colors Included In the RHS Colour Chart (1966, 1986, 1995, and 2001 Editions). Available online at https://www.arsoffice.org/colorcharts.htm
Omar, A., Wali, A., Arken, A., Gao, Y., Aisa, H.A. and Yili, A., 2022. Covalent binding of flavonoids with silk sericin hydrolysate: Anti-inflammatory, antioxidant, and physicochemical properties of flavonoid-sericin hydrolysate conjugates. Journal of Food Biochemistry 46: e14125. https://doi.org/10.1111/jfbc.14125
Oxman, N., 2015. Templating Design for Biology and Biology for Design. Architectural Design 85: 100-107. https://doi.org/10.1002/ad.1961
Oxman, N., Laucks, J., Kayser, M., Uribe, C.D.G. and Duro-Royo, J., 2013. Biological Computation for Digital Design and Fabrication. In: Proceedings of the Computation and Performance-31st eCAADe Conference, 18-20 September 2013, Delft, The Netherlands, Volume 1, pp. 585-594.
Promphet, P., Bunarsa, S., Sutheerawattananonda, M. and Kunthalert, D., 2014. Immune enhancement activities of silk lutein extract from Bombyx mori cocoons. Biological Research 47: 15. https://doi.org/10.1186/0717-6287-47-15
R Core Team, 2022. R: A language and environment for statistical computing (4.2.1). R Foundation for Statistical Computing, Vienna. Available online at https://www.r-project.org/
Randriamanana, T.R., Lavola, A. and Julkunen-Tiitto, R., 2015. Interactive effects of supplemental UV-B and temperature in European aspen seedlings: implications for growth, leaf traits, phenolic defense and associated organisms. Plant Physiology and Biochemistry 93: 84-93. https://doi.org/10.1016/j.plaphy.2015.03.001
Ripley, B., Venables, B., Bates, D.M., Hornik, K., Gebhardt, A. and Firth, D., 2023. MASS: Support Functions and Datasets for Venables and Ripley’s MASS. Available at: https://CRAN.r-project.org/package=MASS
Robertson, A.R., 1977. The CIE 1976 Color-Difference Formulae. Color Research and Application 2: 7-11. https://doi.org/10.1002/j.1520-6378.1977.tb00104.x
Robinson, T., McMullan, G., Marchant, R. and Nigam, P., 2001. Remediation of dyes in textile effluent: a critical review on current treatment technologies with a proposed alternative. Bioresource Technology 77: 247-255. https://doi.org/10.1016/S0960-8524(00)00080-8
Royal Horticultural Society, 1966. Colour Chart. 1st ed. Royal Horticultural Society, Kew.
Sánchez Beeckman, M., 2022. ColorNameR: Give Colors a Name. R package version 0.1.0 (0.1.0). Available online at https://cran.r-project.org/web/packages/ColorNameR/index.html
Sharma, G., Wu, W. and Dalal, E.N., 2005. The CIEDE2000 color-difference formula: Implementation notes, supplementary test data, and mathematical observations. Color Research and Application 30: 21-30. https://doi.org/10.1002/col.20070
Silva, C.E.d.F., Abud, A.K.d.S., da Silva, I.C.C., Andrade, N.P., Cerqueira, R.B.d.O., de Andrade, F.P., Carvalho, F.d.O., Almeida, R.M.R.G. and de Souza, J.E.A., 2019. Acceptability of tropical fruit pulps enriched with vegetal/microbial protein sources: viscosity, importance of nutritional information and changes on sensory analysis for different age groups. Journal of Food Science and Technology 56: 3810-3822. https://doi.org/10.1007/s13197-019-03852-0
Singha, S., Baugher, T.A., Townsend, E.C. and D’Souza, M.C., 1991. Anthocyanin distribution in ‘delicious’ apples and the relationship between anthocyanin concentration and chromaticity values. Journal of the American Society for Horticultural Science 116: 497-499. https://doi.org/10.21273/JASHS.116.3.497
Singhrang, N., Tocharus, C., Thummayot, S., Sutheerawattananonda, M. and Tocharus, J., 2018. Protective effects of silk lutein extract from Bombyx mori cocoons on β-Amyloid peptide-induced apoptosis in PC12 cells. Biomedicine and Pharmacotherapy 103: 582-587. https://doi.org/10.1016/j.biopha.2018.04.045
Steen, J.S., Asplund, J., Lie, M.H. and Nybakken, L., 2021. Environment rather than provenance explains levels of foliar phenolics in European beech (Fagus sylvatica L.) seedlings. Trees Structure and Function 35: 1555-1569. https://doi.org/10.1007/s00468-021-02136-5
Suzuki, T., Ito, C., Kitano, K. and Yamaguchi, T., 2024. CIELAB color space as a field for tracking color-changing chemical reactions of polymeric pH indicators. ACS Omega 9: 36682-36689. https://doi.org/10.1021/acsomega.4c05320
Szőllősi, E., Oláh, V., Kanalas, P., Kis, J., Nyitrai, B., Sárvári, É., Solti, Á. and Mészáros, I., 2011. Physiological responses of two co-existing oak species in years with contrasting climatic conditions. Acta Biologica Szegediensis 55: 169-174. https://abs.bibl.u-szeged.hu/index.php/abs/article/view/2742
Tabunoki, H., Higurashi, S., Ninagi, O., Fujii, H., Banno, Y., Nozaki, M., Kitajima, M., Miura, N., Atsumi, S., Tsuchida, K., Maekawa, H. and Sato, R., 2004. A carotenoid-binding protein (CBP) plays a crucial role in cocoon pigmentation of silkworm (Bombyx mori) larvae. FEBS Letters 567: 175-178. https://doi.org/10.1016/j.febslet.2004.04.067
Takechi, T., Maekawa, Z.-I. and Sugimura, Y., 2011. Food Science and Technology Research 17: 493-497. https://doi.org/10.3136/fstr.17.493
Tanaka, Y., 1913. A study of Mendelian factors in the silkworm, Bombyx mori. The Journal of the College of Agriculture, Tohoku Imperial University, Sapporo, Japan 5: 91-113. http://hdl.handle.net/2115/12514
Tian, Z., Zhao, C., Huang, T., Yu, L., Sun, Y., Tao, Y., Cao, Y., Du, R., Lin, W. and Zeng, J., 2024. Silkworm cocoon: dual functions as a traditional chinese medicine and the raw material of promising biocompatible carriers. Pharmaceuticals 17: 817. https://doi.org/10.3390/ph17070817
Tocharus, C. and Sutheerawattananonda, M., 2024. Hypoglycemic Ability of Sericin-Derived Oligopeptides (SDOs) from Bombyx mori Yellow Silk Cocoons and Their Physiological Effects on Streptozotocin (STZ)-Induced Diabetic Rats. Foods 13: 2184. https://doi.org/10.3390/foods13142184
Tsuchida, K. and Sakudoh, T., 2015. Recent progress in molecular genetic studies on the carotenoid transport system using cocoon-color mutants of the silkworm. Archives of Biochemistry and Biophysics 572: 151-157. https://doi.org/10.1016/j.abb.2014.12.029
Venables, W.N. and Ripley, B.D., 2002. Modern applied statistics with S. 4th ed. Springer, New York, NY.
Voss, D.H., 2002. The Royal Horticultural Society colour chart 2001. Journal of the American Rhododendron Society 56: 10-11. Available online at https://scholar.lib.vt.edu/ejournals/JARS/v56n1/v56n1-voss.html
Voss, D.H. and Hale, W.N., 1998. A comparison of the three editions of the Royal Horticultural Society colour chart. HortScience 33: 13-17. https://eurekamag.com/research/003/019/003019660.php
Wang, H.Y., Wang, Y.J., Zhou, L.X., Zhu, L. and Zhang, Y.Q., 2012. Isolation and bioactivities of a non-sericin component from cocoon shell silk sericin of the silkworm Bombyx mori. Food and Function 3: 150-158. https://doi.org/10.1039/c1fo10148j
Wang, H.Y., Zhao, J.G. and Zhang, Y.Q., 2020. The flavonoid-rich ethanolic extract from the green cocoon shell of silkworm has excellent antioxidation, glucosidase inhibition, and cell protective effects in vitro. Food and Nutrition Research 64: 1-12. https://doi.org/10.29219/fnr.v64.1637
Wang, Y., Gao, J., Yang, Y., Zhu, L., Yang, W., Li, P., Yang, W. and Yang, W., 2025. A Review on the Extraction Methods, Bioactivities, and Application in Foods of Silk Sericin. Journal of Food Biochemistry: 2155701. https://doi.org/10.1155/jfbc/2155701
Zhao, J.G., Wang, H.Y., Wei, Z.G. and Zhang, Y.Q., 2019. Therapeutic effects of ethanolic extract from the green cocoon shell of silkworm Bombyx mori on type 2 diabetic mice and its hypoglycaemic mechanism. Toxicology Research 8: 407-420. https://doi.org/10.1039/c8tx00294k
Zhu, L. and Zhang, Y.-Q., 2014. Identification and analysis of the pigment composition and sources in the colored cocoon of the silkworm, Bombyx mori, by HPLC-DAD. Journal of Insect Science 14: 31. https://doi.org/10.1093/jis/14.1.31


