Abstract
This paper assesses the economic consequences of the 2025 U.S. trade policy on global agricultural markets, with a focus on the “reciprocal tariffs” initiated by the United States. By using a multi-region, multi-sector computable general equilibrium model, we evaluate the macroeconomic and sectoral effects of alternative tariff scenarios, with a particular focus on the U.S. agricultural sector. Our results indicate that the imposition of uniform tariffs on U.S. imports from the rest of the world generates substantial welfare losses for the U.S. (0.63%) and China (1.28%), with corresponding GDP declines of 0.82 and 0.39%, respectively. Tariffs result in significant contractions in global agricultural trade and higher consumer prices for key agri-food products in the US, including vegetables (6.05%), crops (7.48%), and cattle (4.13%). China’s oilseed imports from the U.S. decrease by 38.32%, while imports from Canada and Brazil increase by 17.48 and 3.92%, respectively, if U.S.–China tariffs are enacted. U.S. imports of high-value vegetables and fruits from Canada and Mexico decline sharply, partially offset by increased imports from Australia and Argentina if new tariffs are enacted in North America. These findings show the complex sectoral adjustments and market realignments driven by escalating trade tensions.
1. Introduction
Recent tariff developments signify one of the most profound shifts in U.S. trade policy, marked by considerable scale and geographic reach. In early 2025, the United States escalated tariffs on major imports, surpassing the 2018 trade war’s intensity. In February, tariffs were imposed on nearly $500 billion imports, followed by “reciprocal” tariffs on April 2, termed “Liberation Day.” U.S. tariffs on Chinese goods reached 145% in April, deemed nearly prohibitive, prompting swift retaliation from key trading partners, particularly targeting U.S. agricultural exports. China imposed 125% tariffs on U.S. goods, heavily focusing on agricultural products like soybeans, pork, beef, and vegetables, with $12.8 billion in soybeans alone to China in 2024. On May 12, the U.S. and China agreed to a 90-day tariff reduction, lowering U.S. tariffs on Chinese goods from 145 to 30% and China’s retaliatory tariffs to 10%, effective May 14, followed by talks in Geneva and London.1 These shifts disrupted global trade, with U.S. agricultural exports declining significantly (USDA, 2025). The recent U.S. tariff plans extend “reciprocal” duties to several Asian countries, such as Vietnam, the Philippines, Indonesia, and South Korea, with new rates ranging from about 15% to 20% under the 2025 framework agreements, as of September 2025 (Bown, 2025).
This paper examines the economic consequences of the 2025 trade policy initiatives, analyzing reciprocal tariffs imposed by the United States, retaliatory responses from trade partners, and the latest U.S.–China trade agreement, with a particular focus on agricultural markets. Our analysis highlights significant global realignments in agricultural trade and welfare redistribution stemming from U.S.-initiated tariff shocks. We find that the 2025 tariffs imposed by the United States will disrupt supply chains and reduce the real GDP and welfare of both the U.S. and other countries involved. The prices in the U.S. will rise disproportionately across sectors. The U.S. government should consider providing subsidies to farmers, particularly in light of the high retaliatory tariffs imposed by other economies on U.S. agricultural goods, which have led to export slowdowns and potential revenue losses.
Using a multi-region, multi-sector computable general equilibrium (CGE) model that incorporates interactions across tradable and non-tradable sectors as observed in the world input-output tables, we analyze the macroeconomic effects of various tariff scenarios. We first compile data from multiple sources, including trade volumes, tariff rates, and product classifications, to construct trade-weighted average applied tariffs at the GTAP sector level. To examine the impact of the 2025 tariff measures on key economic indicators, we conduct counterfactual exercises in which multinational tariffs are raised to levels planned or imposed by the United States. We consider four scenarios based on tariffs announced as of September 2025. First, we evaluate the effects of U.S.–China negotiations in Geneva and London on June 9, 2025, where U.S. tariffs on Chinese imports are reduced to 30% and China reciprocates by lowering retaliatory tariffs to 10 and 15%, according to product lists. The second scenario simulates tariff changes within North America, reflecting measures announced by the United States, Canada, and Mexico. The third scenario combines the U.S.–China and North American tariff regimes to assess the broader impact of trade conflicts among the primary U.S. trading partners. The final scenario adds a uniform tariff on imports from the rest of the world, including tariffs on imports from the EU and the UK with associated retaliation. In this scenario, Canada removes its retaliation against the U.S., consistent with the official announcement, and sector-specific tariffs on steel and aluminum are also incorporated.
Our results indicate that broad-based tariffs lead to significant disruptions in global agricultural trade. U.S. agricultural exports decline across most sectors, with high-value crops such as vegetables, fruits, nuts, and oilseeds experiencing the largest losses. Trade diversion is evident, as U.S. exports to China fall sharply while exports to alternative markets, such as Brazil and Vietnam, increase. Import reductions and retaliatory measures also contribute to rising domestic prices for key agricultural commodities, affecting both producers and consumers. We find that the tariffs have trade diversion effects on the global agricultural markets. We examine the trade diversion effects resulting from a U.S. tariff plan announced by September 2025. The results highlight significant trade diversion, with U.S. exports to Brazil, India, and the Rest of World increasing, export to Canada, China, and the EU27 decreasing, and U.S. imports from most regions decreasing.
Second, we find that U.S. agricultural production is significantly affected by global food policy changes. Under the current tariff plan, the world trade war scenario, oilseed and wheat output of the U.S. declines by 9.27 and 2.25%, respectively, due to the new tariffs, while the output of crops and cattle products rises by 10.39 and 3.39%, respectively. High-value products such as vegetables, nuts, and fruits show potential for domestic market adjustments. The variation in these results highlights the need for more targeted food policies to support agricultural production in vulnerable sectors.
Third, our findings indicate that the introduction of new tariffs leads to substantial changes in both economic welfare and GDP across regions. Canada experiences the largest welfare loss (6.77%) if it retaliates against the U.S. However, the losses are smaller if Canada does not retaliate, with declines reaching up to 0.98%. China follows, with welfare decreasing by as much as 1.24%. South Africa also experiences notable welfare losses, particularly under more extensive tariff coverage. In contrast, major agricultural exporters such as Brazil, Argentina, and Australia consistently experience welfare gains, with Brazil’s welfare increasing by as much as 1.24% in World trade war scenarios. The United States experiences a welfare loss, reaching up to 0.633%. These results show that welfare losses are concentrated among the United States’ closest trading partners and certain emerging economies, while a select group of agricultural exporters benefit from the realignment of global trade flows. The pattern of GDP changes largely mirrors these welfare effects, underscoring the uneven distributional impact of tariff escalation on the global economy.
Finally, we find that new tariffs lead to pronounced changes in commodity prices across a range of agri-food products in the U.S. Consumer prices for wheat and for the aggregated “vegetables–fruits–nuts” sector in the GTAP model rise by as much as 5.46, 6.05%, and higher in some cases, while crops and cattle also experience noticeable price increases. Import prices exhibit particularly sharp increases, especially for wheat, vegetables, oilseeds, and cattle, in some cases rising by more than 10%. Domestic price indices generally track these trends, with the largest increases observed for high-value products and staple grains. These results indicate that the potential for significant consumer and producer prices impacts as a consequence of widespread tariff escalation and trade realignment.
The remainder of the paper is organized as follows. Section 2 reviews the relevant literature. Section 3 presents the model structure, describes the data, and provides background on the U.S. tariff measures implemented during the trade war. Section 4 reports the main results, and Section 5 concludes.
2. Literature review
Our paper relates to three strands of literature. First, this paper contributes to the impact of global agricultural policy on agri-food trade. Studies highlight the role of trade shocks in food price volatility (Gouel, 2016; Gouel and Jean, 2015; Headey, 2011), the importance of trade policy coordination and price stabilization in developing countries (Gouel, 2016; Gouel and Jean, 2015), and the effects of high trade costs on market integration and storage decisions (Porteous, 2019). Other work examines how trade and technology interact to influence agricultural productivity (Farrokhi and Pellegrina, 2023; Tombe, 2015), and the critical role of both domestic and international market adaptation in response to climate change and global food policy shifts (Gouel and Laborde, 2021; Hsiao et al., 2024). Our paper contributes to this literature by providing new quantitative evidence on the macroeconomic and sectoral impacts of recent U.S.-led tariff escalation, quantifying welfare, trade, and price effects across multiple countries and commodities using a multi-region, multi-sector general equilibrium framework.
Second, a large amount of empirical literature has emerged analyzing the effects of trade tensions, particularly the U.S.–China trade war in 2018. Amiti et al. (2019) find near-complete pass-through of U.S. tariffs to domestic import prices, implying that the tariff burden largely fell on U.S. consumers. Fajgelbaum et al. (2020) further show that these tariffs reduced U.S. real income by reallocating resources inefficiently and raising consumer prices. Grant et al. (2021) document declines in U.S. agricultural exports and shifts in trade patterns due to retaliation. Retaliatory tariffs by foreign countries similarly reduced their real incomes, indicating broad global welfare losses from the trade war and global reallocation (Fajgelbaum and Khandelwal, 2022; Fajgelbaum et al., 2024; Flaaen et al., 2020). Li et al. (2020) use a CGE model based on the GTAP framework to simulate the trade war’s welfare and distributional effects across regions and sectors. Their results highlight global welfare losses and trade diversion, with significant terms-of-trade effects for both the United States and China. There are few studies that quantify the economic impacts of the new round of tariff wars in 2025. Ai et al. (2025) extend this analysis to include the impacts of the recent tariffs’ timeline in 2025. Balistreri et al. (2024) provide a quantitative analysis of the United States proposed blanket tariffs across different model structures. To the best of our knowledge, we are one of the first papers to quantify the economic effects of the potential tariff plans in 2025.
Third, our paper also contributes to the broader discussion on the long-term impacts of trade policy and its political implications. Beyond aggregate effects, a bunch of literature emphasizes the political economy and strategic logic of trade policy design in the long-term analysis. The Stolper–Samuelson theorem shows that trade liberalization raises the real income of a country’s abundant factor while lowering that of its scarce factor (Stolper and Samuelson, 1941). Samuelson (2004) emphasizes that while trade expands global welfare, it does not guarantee uniform benefits across nations or factor owners, known as “Samuelson trap”, a concept related to suboptimal outcomes in international trade due to policy rigidities or distributional effects. Grossman and Helpman (1994) and Brander (1995) offer a comprehensive accounting of the trade war’s legal and economic dimensions, documenting how tariffs were strategically designed to maximize political leverage. Bown et al. (2024) study China’s retaliation strategy, showing how tariff targets were chosen to maximize pressure on politically influential U.S. regions. The uncertainty generated by unpredictable trade policy changes, such as announcements, suspensions, and revisions, has been a key concern in literature. More broadly, some research has begun to investigate the long-run implications of protectionism for global value chains (Antrás and Chor, 2022) and multilateral trade institutions (Bagwell et al., 2021). Auclert et al. (2025) find that temporary tariffs cause a recession whenever the import elasticity is below an openness-weighted average of the export elasticity and the intertemporal substitution elasticity. Moreover, a growing body of recent research has explored the political consequences of tariffs and trade wars (Fetzer and Schwarz, 2021). Choi and Lim (2023) find China imposed retaliatory tariffs, especially on US agricultural products, which largely affected Republican-leaning counties, thus affect the US presidential election. Our paper provides new results relative to the existing literature by analyzing the long-term economic impacts of the 2025 U.S. tariff proposals, which have not yet been extensively studied.
3. Method
3.1 Data processing
The 2025 U.S. trade disputes are characterized by escalating complexity and targeted retaliation, particularly in agricultural sectors. In 2023, U.S. oilseed exports totaled roughly $15.3 billion to China, $3.9 billion to the EU27 and $2.9 billion to Mexico (with smaller shipments to Vietnam, Canada, India and Brazil), while U.S. oilseed imports were far smaller — about $560 million from Canada, $220 million from Brazil and $105 million from the EU27. By contrast, the U.S. was a major net importer of vegetables, fruit and nuts: it exported around $4.3 billion to Canada, $2.9 billion to the EU27 and $1.8 billion to Mexico, but imported about $19.0 billion from Mexico, $3.2 billion from Canada and $0.8 billion from Vietnam (with additional smaller supplies from the EU27, China, Brazil and India).
We compile tariffs and retaliatory tariffs on U.S. exports from official documents released by the Ministry of Finance of China, the Department of Finance of Canada, and the EU. The baseline tariff data is from the World Integrated Trade Solution (WITS). We use bilateral trade flows for the GTAP sector. Bilateral trade data come from UNSD-COMTRADE. Values are reported in thousands of U.S. dollars at current prices and include cost, insurance, and freight (CIF). Commodities are defined using the Harmonized Commodity Description and Coding System at the 6-digit (HS6) level of aggregation and were concorded to GTAP sectors using the United Nations concordance table.
Bilateral tariffs data across the United States, China, Canada, and Mexico at the GTAP sector level for 2023 are obtained from UNCTAD-TRAINS. The tariff measures are tariff lines and are reported in two ways, simple and weighted average effective applied rates. Effective applied rates refer to the actual tariff applied, taking into account whether there is any trade agreement between the countries. We also downloaded the most-favored-nation (MFN) tariffs for each country. According to World Trade Organization (WTO) rules, members cannot discriminate between their trading partners; therefore, they need to give all countries the same favorable treatment as all other WTO members. The tariff that considers this rule is the MFN tariff. If countries sign bilateral and multilateral trade agreements, then they are exempt from this rule. We compare both measures to see if they are consistent, that is, if the effective applied rates are lower than or equal to the MFN tariffs. We use weighted average rates in counterfactual exercises, although we check that the results are robust by also using simple averages.
3.2 Baseline scenario definition
We use macroeconomic data from the GTAP 11 database, which is calibrated to 2017. To estimate the additional tariff effects, we recursively update the macroeconomic data to 2024 as the baseline scenario. Key macroeconomic variables such as GDP, capital stock, population, and labor (skilled and unskilled) are calibrated to 2024 using projected data from CEPII for each region of the world. To examine the long-term effects of the United States’ tariff war on economic impacts and global reallocation, we adapt a model that incorporates a dynamic recursive module into the standard static GTAP model, following the methodologies of Lakatos and Walmsley (2012) and Walmsley et al. (2000). The dynamic module allows us to calibrate macroeconomic data, such as GDP, capital stock, population, and labor, for each region to the recent year based on forecast data, enabling an analysis of the long-term impact of policy shocks.
We aggregate the weighted tariffs using bilateral trade at GTAP sectors using tariffs data at HS 6-digit and concordance between HS10 codes and descriptions following Fajgelbaum et al. (2020). To accurately simulate the negative impacts of the trade war effects, we utilize the concordance table linking 6-digit HS codes to the 45 tradable sectors in the GTAP 11 database, as provided by WITS. We first match the tariff plan according to the United States, China, and Canada’s tariff announcements. Then, we compute applied tariff rates using 2024 sectoral import and export shares as weights, allowing for a more precise representation of the tariff structure across sectors. Figure 1 shows the US two most important ag-food trade products, oil seeds for export and vegetables for imports trade volumes in 2023 by trade partners.

US export and import by destination and origin. This figure shows the US two most important ag-food trade products, oil seeds for export and vegetables for imports trade volumes in 2023 by trade partners. The data source is World Integrated Trade Solution (WITS). Figures A1 and A2 in the Appendix show the trade trends of these two products in the face of an economic recession and a sudden increase in tariffs.
Citation: International Food and Agribusiness Management Review 2026; 10.22434/ifamr.1388
3.3 Tariff policy and scenarios
The US has implemented a series of tariffs since 2025, targeting various regions and products. As of September 2025, the U.S. tariff policy imposes a 10% universal baseline tariff on all imports (effective April 5, 2025) under the International Emergency Economic Powers Act (IEEPA), with exemptions for USMCA-compliant goods. China faces a 30% tariff (20% fentanyl+10% baseline) on most goods, 54% on de minimis shipments, and 50% on steel/aluminum, averaging approx. 51.1% (pre-substitution), following the Geneva (May 2025) and London (June 2025) trade talks that reduced tariffs from 145%. Canada and Mexico face 25% tariffs on non-USMCA-compliant goods and 50% on steel/aluminum, with USMCA exemptions extended indefinitely. The EU faces a 10% baseline tariff, with a proposed 50% reciprocal tariff pending, while the UK benefits from a trade deal reducing auto and steel tariffs. Later in August 2025, Canada effectively dropped most of its retaliatory tariffs against the United States. The U.S. subsequently imposed tariffs on several Asian countries and entered into trade agreements with selected partners. Table 1 shows the summary of the current tariff policy as of June 16, 2025. We construct four relevant scenarios with different tariff changes:
(1) Scenario 1: USCHN. Following U.S.–China negotiations in Geneva and London, U.S. tariffs on Chinese imports are reduced from 145 to 30% (20% fentanyl + 10% baseline). China reciprocates by lowering its retaliatory tariffs from 125 to 10 and 15% following the product list on most U.S. goods, such as agriculture and machinery. Also, we simulate US tariff increase to 50% on imports of steel, aluminum, and derivative products.
(2) Scenario 2: USMCA. This scenario focuses on selective U.S. tariffs on Canada and Mexico, applying 25% tariffs on non-USMCA-compliant goods, 10% on non-USMCA energy and potash, and 50% on steel and aluminum, while exempting USMCA-compliant goods (38% of imports), oil, gas, and automotive products to preserve supply chains. Canada retaliates with 25% tariffs on U.S. consumer and processed food goods (worth US$21 billion) and non-USMCA vehicles, mirroring U.S. exemptions for oil, gas, and autos. Mexico’s retaliatory measures remain pending.
(3) Scenario 3: CHN_USMCA. This scenario combines the comprehensive U.S. tariff regime against China (Scenario 1) with the selective, exemption-based approach toward Canada and Mexico (Scenario 2), reflecting a dual-track U.S. trade strategy.
(4) Scenario 4: WORLD. A full-scale global trade war, this scenario adds a 10% U.S. tariff on all other regions and a 50% EU tariff with retaliation (announced on May 23, 2025) based on Scenario 3, capturing the broad economic consequences of widespread protectionism and trade diversion. The EU retaliates with up to 25% tariffs on U.S. goods, while the UK, under a May 2025 trade deal, faces a 10% baseline tariff with reduced rates for autos and steel, retaliating with 10% tariffs. Other regions face the 10% U.S. tariff with potential retaliation. Exemptions include USMCA goods. Canada dropped its retaliatory tariffs against the United States. Tariffs were imposed on several Asian countries according to the bilateral agreements listed. The results below summarize the effects of the current tariffs in place as of June 16, 2025, assuming they remain in force indefinitely.2
Current tariff policy as of September 2025.
Citation: International Food and Agribusiness Management Review 2026; 10.22434/ifamr.1388
4. Potential impacts of the 2025 trade wars on agricultural markets
Each scenario reflects varying degrees of policy intensity and retaliation, offering insights into the asymmetric effects of tariffs among trading partners. Our analysis focuses on key outcomes including agricultural products output, consumer prices, GDP, welfare, and bilateral trade dynamics, with particular attention to the U.S. tariffs and trade partners’ retaliatory measures and spillover effects on other economies. Furthermore, our results show the broader implications of trade diversion and sector reallocation, highlighting long-term economic consequences.
4.1 Agri-food trade impacts
Given the agricultural commodity trade across countries with the U.S., we analyze the trade impacts for main agricultural food trade in detail. Figure 2a presents the percentage changes in U.S. agricultural exports, revealing significant disruptions and sector-specific vulnerabilities. Most U.S. agricultural sectors experience export reductions across all scenarios, with the WORLD scenario showing the most severe declines. High-value sectors like vegetables, fruits, and nuts (12.99% decline in WORLD) and oil seeds (27.09% decline in WORLD) face substantial export losses. The results emphasize the vulnerability of U.S. agricultural exports to escalating trade tensions, with broader tariff scenarios amplifying losses across nearly all sectors.
Change in exports and imports of the U.S. agricultural commodities under scenarios (%). (Left) Export, (right) import. This figure shows the total export and import of U.S. agricultural goods as estimated by the GTAP model. S1–S4 refer to the four scenarios considered: U.S.–China, U.S.–Canada–Mexico, both, and worldwide trade wars. The following figures and tables use the same scenario definitions.
Citation: International Food and Agribusiness Management Review 2026; 10.22434/ifamr.1388
Figure 2b shows the percentage changes in U.S. agricultural imports across a range of commodities under different tariff scenarios. Imports of paddy rice, wheat, and oilseeds experience substantial declines, falling by as much as 50.24, 43.52 and 34.89%, respectively, under the WORLD scenario. Similarly, imports of cattle products, wool, and raw milk drop by over 30% in some cases. Imports of high-value products such as vegetables, fruits, and nuts also decrease notably, with reductions exceeding 17%. These results highlight the broad contraction in U.S. agricultural imports in response to higher tariffs, with the largest effects observed for staple crops and livestock products. Policymakers should consider targeted support for high-value and export-dependent crops, such as oilseeds and vegetables, to mitigate income losses in rural communities.
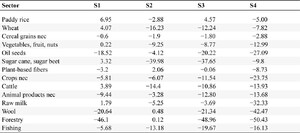
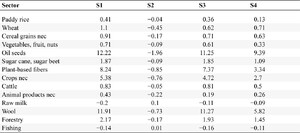
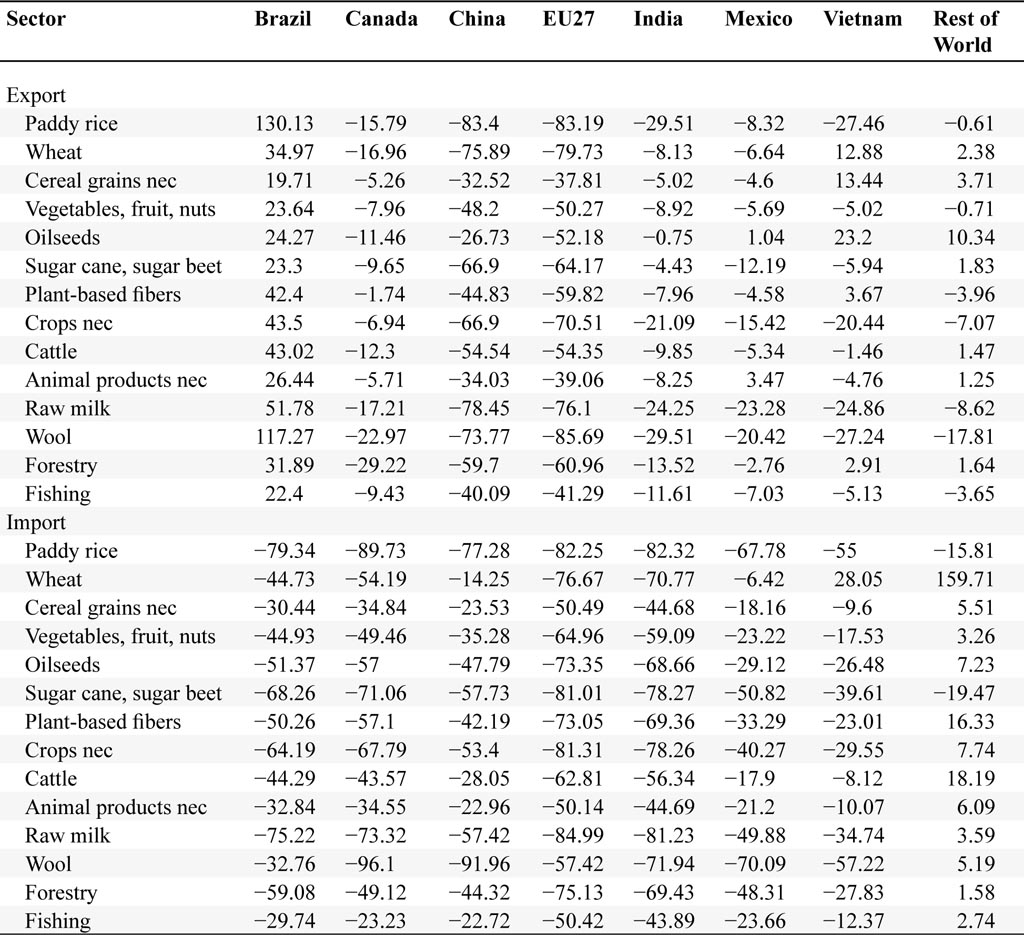
Table 2 presents the percentage changes in bilateral U.S. agricultural exports and imports with Brazil, Canada, China, EU27, India, Mexico, Vietnam, and the rest of the world under a scenario of elevated U.S. tariffs and retaliation. The table shows that U.S. agricultural exports experience significant trade diversion and losses. Paddy rice exports increase substantially to Brazil and Vietnam, while falling sharply to China and Canada, indicating that export growth to alternative markets only partially offsets major declines in key partners. Exports of oilseeds and wool to China decrease by 26.73 and 73.77%, respectively, reflecting the impact of tariffs and supply chain disruption. Exports to USMCA partners also contract across most sectors, such as wheat (−16.96% to Canada) and vegetables, fruit, and nuts (−7.96% to Canada and −5.69% to Mexico), demonstrating significant regional effects of sector-specific tariffs.
Bilateral trade between the U.S. and other countries/regions in Scenario 4 (%).
Citation: International Food and Agribusiness Management Review 2026; 10.22434/ifamr.1388
Table 2 also shows that U.S. agricultural imports decline across almost all sectors and partners, with particularly steep reductions in paddy rice (−89.73% from Canada) and wheat (−44.73% from Brazil). Oilseed imports drop by 57% from Canada and 73.35% from the EU27, while imports of vegetables, fruit, and nuts fall by 44.93% from Brazil and 49.46% from Canada. Notably, U.S. paddy rice imports from Vietnam decline by 55%, contrasting with a significant increase in paddy rice exports to Brazil.
The results highlight a complex pattern of trade reorientation: while trade with some partners increases (e.g., U.S. exports to Brazil), widespread declines with traditional partners — especially China, Canada, and Mexico — signal significant losses for U.S. agriculture. On the import side, sharp contractions in high-value and staple goods suggest a potential upward pressure on domestic prices and highlight the challenge of maintaining supply chain stability in the face of escalating trade tensions.
The results reveal a complex trade landscape shaped by 2025 tariffs and retaliation. Export gains to select markets suggest opportunities for trade diversion, but widespread declines, especially with China, signal significant losses for U.S. agriculture. Import reductions, particularly in high-value agricultural goods, may raise domestic prices and affect consumer access, while shifts to new suppliers like Vietnam show supply chain adaptability.
For some specific products, we find that oilseed trade diverts to Brazil, Argentina, and Canada. Figure 3 illustrates the percentage change in China’s oilseed imports from major trading partners under the U.S.–China trade war scenario. China’s imports from Australia, Argentina, Canada, and Russia rise sharply (by 31.92%, 21.93%, 17.48%, and 31.42%, respectively), while imports from the United States fall dramatically (−38.32%). This demonstrates a pronounced trade diversion effect away from the United States toward other exporters.
China’s oilseeds imports under the U.S.–China (USCHN) trade war scenario.
Citation: International Food and Agribusiness Management Review 2026; 10.22434/ifamr.1388
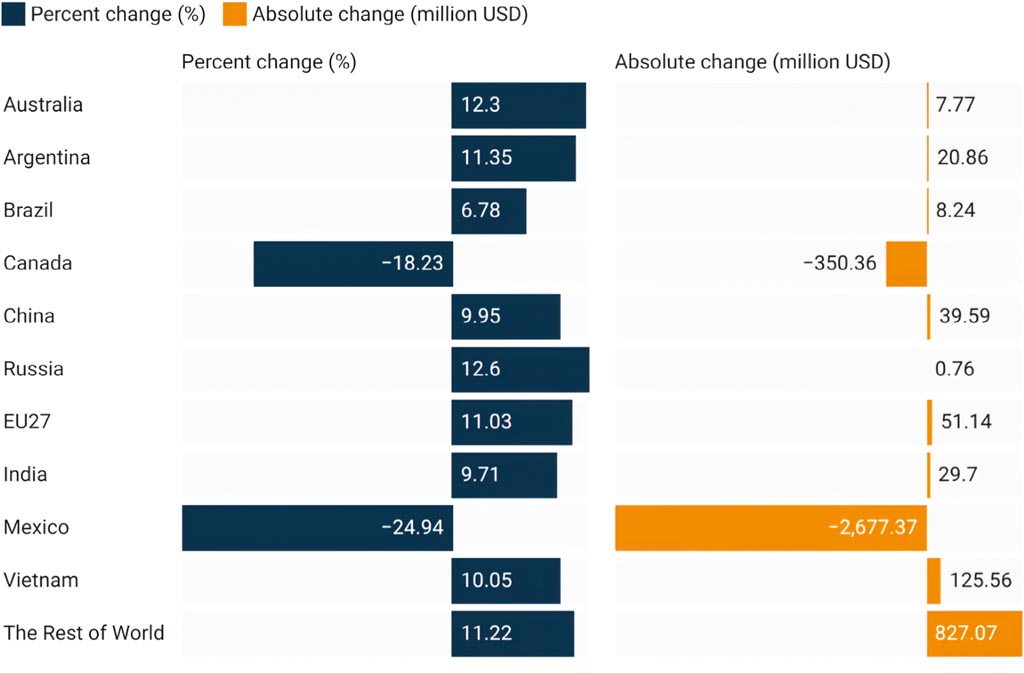
Figure 4 displays changes in U.S. imports of vegetables and fruits from major suppliers under the USMCA scenario. While imports from countries such as Russia (12.60%), Australia (12.30%), Argentina (11.35%), China (9.95%), and Vietnam (10.05%) all increase, imports from Canada (−18.23%) and Mexico (−24.94%) decline significantly. These patterns highlight how tariffs disrupt established trade relationships, prompting shifts toward alternative suppliers.
U.S. fruit and vegetable imports under the U.S.–Mexico–Canada (USMCA) trade war scenario.
Citation: International Food and Agribusiness Management Review 2026; 10.22434/ifamr.1388
4.2 Agricultural production impacts
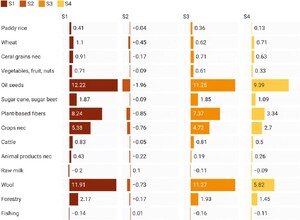
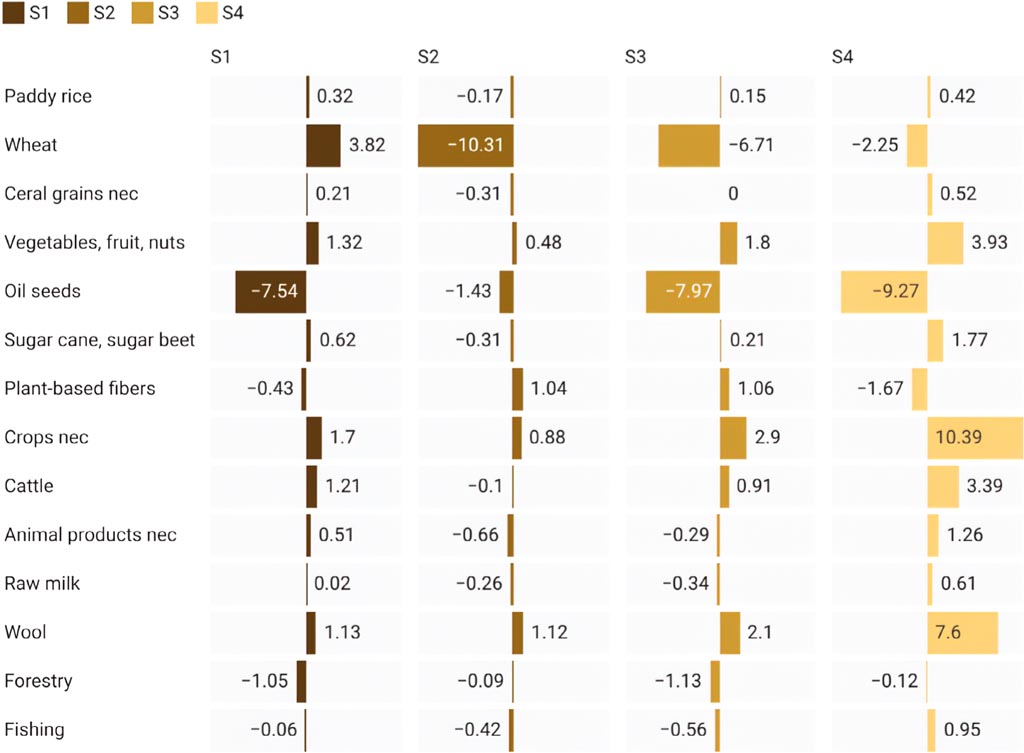
Figure 5 presents the production impacts of the 2025 tariff plans, showing percentage changes in the output of selected agricultural commodities relative to the base year. Production changes vary considerably across sectors and scenarios. Output of “crops nec” exhibits strong growth, rising by 10.39% in the global (WORLD) scenario, while wool production increases by 7.60%. Vegetables, fruit, and nuts production also expands across all scenarios, with a 2.83% increase in the global scenario, reflecting the adaptability of these high-value sectors to trade shifts. Cattle output rises by 3.39% in the global scenario. In contrast, oilseeds production experiences sharp declines, falling by 9.27% in the global scenario, while wheat production drops by 2.25%. Figure 6 shows the output impacts of the new tariffs, indicating that China will increase self-production in response to greater import pressure and will substitute imports with domestic products.
Change in production of the U.S. agricultural commodities under Scenarios 1–4 (%).
Citation: International Food and Agribusiness Management Review 2026; 10.22434/ifamr.1388
Change in production of China’s agricultural commodities under Scenarios 1–4 (%).
Citation: International Food and Agribusiness Management Review 2026; 10.22434/ifamr.1388
The results indicate that sectoral responses are highly heterogeneous: crops nec, wool, cattle, and high-value horticultural products benefit from trade realignment and reduced import competition, while export-oriented commodities such as oilseeds and wheat are particularly vulnerable to tariff escalation and retaliation. The largest production increases and declines are concentrated in the most comprehensive scenario, highlighting the cumulative impact of global tariff escalation. The results highlight the importance of targeted support for the most affected sectors, such as oilseeds and wheat, and the potential for further domestic adjustment and growth in resilient sectors like vegetables, fruit, nuts, and wool. Overall, these findings illustrate the complex and uneven production consequences of broad-based trade policy changes for U.S. agriculture.
4.3 Commodities prices
Table 3 reports percentage changes in the consumer price index (CPI), domestic price index, and import price index for key agricultural commodities, revealing substantial sectoral variation. Under the global (WORLD) scenario, the consumer price index rises most for fishing (7.10 %), vegetables, fruit, and nuts (6.05%), and crops nec (7.48%), pointing to broad-based consumer cost increases, especially for high-value and essential food items. Wheat and cattle also see consumer price increases, though to a lesser degree (5.46% and 4.13%, respectively). Oil seeds exhibit a price increase of 1.03%, suggesting sector-specific price relief possibly due to trade diversion.
Change in commodity price under Scenarios 1–4.
Citation: International Food and Agribusiness Management Review 2026; 10.22434/ifamr.1388
The CPI increases notably in several sectors under the WORLD scenario. Domestic price indices tend to decrease for many sectors under the USMCA and CHN_USMCA scenarios, including significant drops for wheat (−1.03% and −0.98%) and forestry (−0.55% and −1.15%), reflecting lower domestic demand or trade disruption. However, some sectors such as crops nec (2.4% in WORLD) and wool (1.72% in WORLD) experience domestic price gains, indicating resilience or rising domestic demand.
Import price indices increase sharply across all scenarios, and especially in the WORLD scenario, with notable rises for wheat (31.96%), oilseeds (24.77%), cattle (31.28%), and animal products nec (25.27%). This demonstrates the strong inflationary pressure of tariffs and retaliation on agricultural import costs, which can squeeze farm margins and drive-up prices for downstream users. The WORLD scenario generally produces the largest changes, highlighting heightened exposure to global trade tensions and greater vulnerability of U.S. agricultural supply chains. Import prices increase because of the tariffs and retaliatory measures imposed by other countries, which hinder exports. As a result, some export-oriented products are redirected to the domestic market, slightly reducing domestic prices. Overall, consumer prices reflect a weighted average of domestic and import prices, and their changes vary depending on the product.
These results suggest that rising import and consumer prices, particularly for key food groups, could erode consumer purchasing power and increase production costs, while declining domestic prices in major crops may benefit consumers but pose challenges for producers — especially in export-oriented regions. This underscores the need for targeted policy support for sectors facing heightened risk from trade disruptions and price volatility.
4.4 GDP and welfare
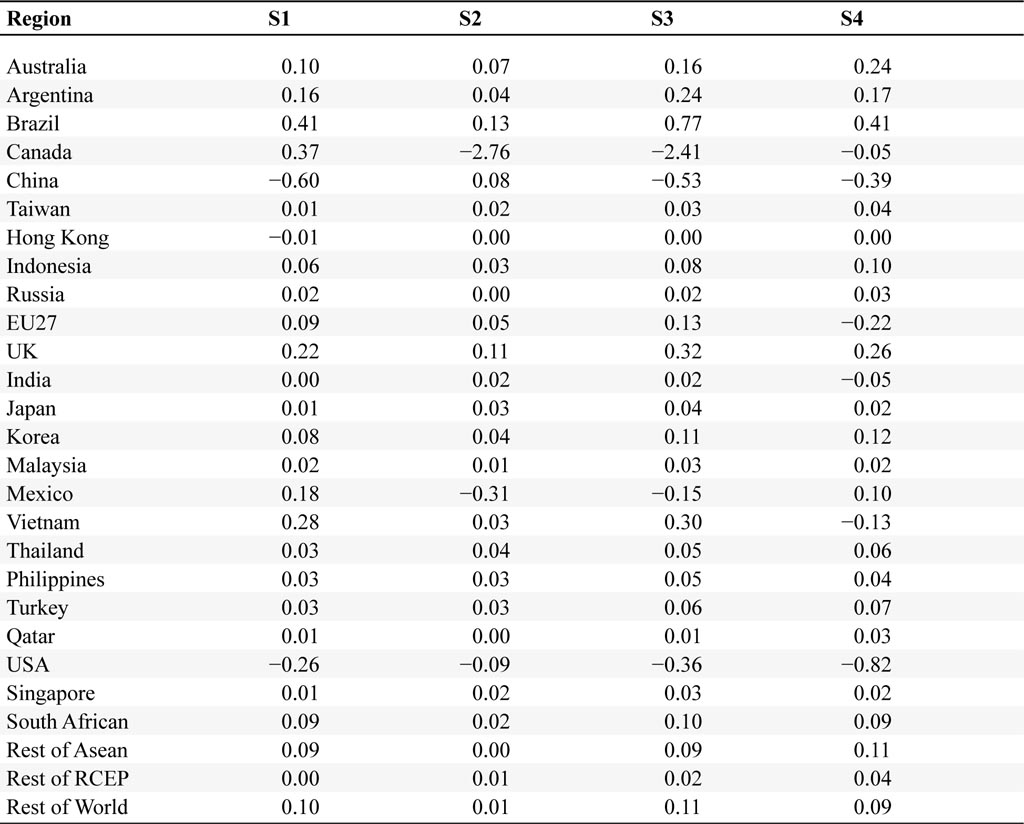
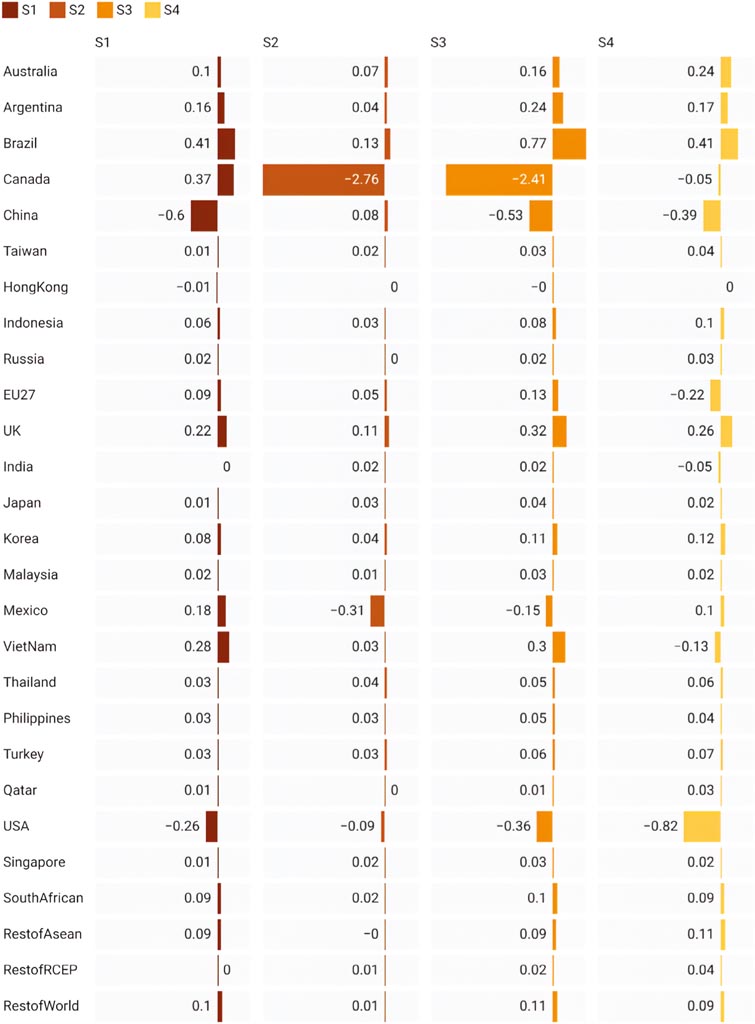
Figure 7 presents the percentage changes in GDP across regions, highlighting diverse responses to the tariff scenarios. The United States experiences small GDP declines in all cases, with a maximum decrease of 0.82% under WORLD scenario. Canada faces the largest GDP reductions among all regions if it retaliates against the United States, with GDP declining by 2.76% in Scenario 2 and 2.41% in the combined scenario. However, in the global scenario where Canada does not retaliate against the U.S., the GDP loss is smaller, at about 1.57%. China’s GDP falls by 0.6% under the bilateral scenario but 0.39% in the global scenario, and records slight gains in scenarios where China is less directly targeted. Brazil and Argentina consistently register moderate GDP gains across scenarios, with Brazil’s GDP rising by up to 0.41% and Argentina’s by 0.17% in the global scenario. Other major agricultural exporters, such as Australia and the Philippines, see more modest increases. Conversely, Vietnam’s GDP drops by 0.13% in the global scenario, reflecting broader vulnerabilities among some emerging economies. Most other regions, including the EU, UK, Japan, and the rest of Asean, show minimal GDP changes. Overall, the results illustrate that while the direct global GDP impact of tariffs is limited, close trading partners of the U.S. experience significant losses, and several agricultural exporters benefit from trade realignments driven by tariff escalation.
Change in GDP under Scenarios 1–4 (%).
Citation: International Food and Agribusiness Management Review 2026; 10.22434/ifamr.1388
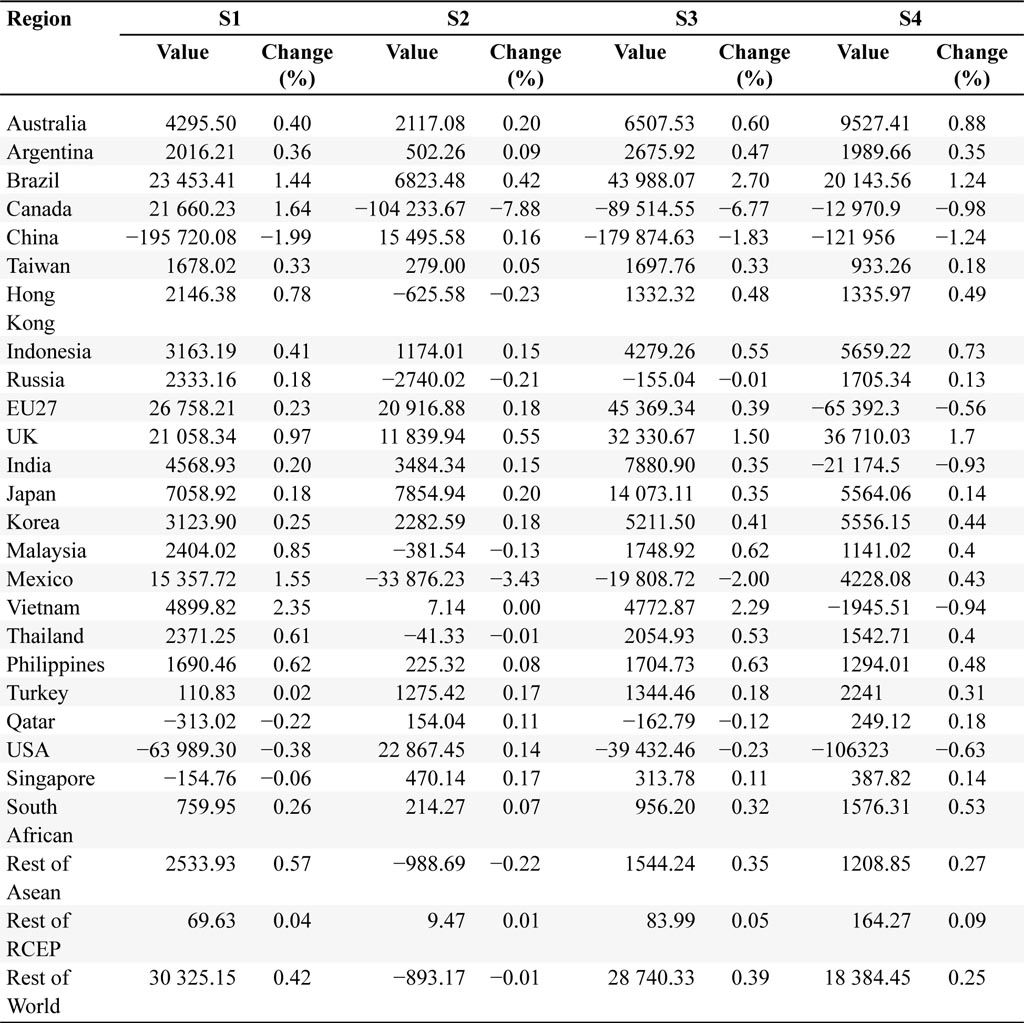
Table 4 presents welfare changes across regions, in both million-dollar and percentage terms, revealing substantial heterogeneity in the effects of tariff escalation. The results are consistent with those reported by Fajgelbaum et al. (2020) and Balistreri et al. (2024). The United States experiences only modest changes in welfare, with a decline of $63 989 million (0.38%) in the USCHN scenario, and a larger decline of $106 323 million (0.63%) in the WORLD scenario. In contrast, Canada faces pronounced welfare losses, with declines of $104 233.7 million (−7.88%) in the USMCA scenario and $12 970.9 million (−0.98%) in the global scenario, reflecting deep disruptions to its trade with the U.S. and broader global partners. China’s welfare falls by $195 720.1 million (−1.99%) in the bilateral scenario, $179 874.6 million (−1.83%) in the combined scenario, and $121 956 million (−1.24%) in the global scenario, showing its exposure to U.S. tariffs and associated retaliation. Mexico also records significant welfare losses, particularly in the USMCA scenario (−$33 876.23 million, −3.43%).
Change in Economic Welfare under Scenarios 1–4 (%, million dollars).
Citation: International Food and Agribusiness Management Review 2026; 10.22434/ifamr.1388
By contrast, Brazil and other agricultural exporters tend to benefit, with Brazil’s welfare rising by $20 143.56 million (1.24%) in the global scenario and $43 988.1 million (2.70%) in the combined scenario. Vietnam, Thailand, and the Philippines also register strong welfare gains in several scenarios, as trade realignment boosts exports to new markets. Most other regions see relatively small changes, with the EU27 losing $65 392.3 million (−0.56%) and Australia gaining $9527.41 million (0.88%) in the global scenario, while South Africa experiences a welfare gain of $1576.31 million (0.53%). These results highlight the uneven distributional impacts of tariff escalation.
4.5 Systematic sensitivity analysis
The numerical results of a computable general equilibrium model depend on the specification of a number of exogenous parameters, including elasticities of substitution, income elasticities of demand, and trade elasticities. Since these parameters are typically estimated with error and considerable uncertainty, it is important to evaluate the robustness of simulation outcomes to alternative assumptions. The GTAP modeling environment provides a built-in facility for conducting systematic sensitivity analysis. The SSA repeatedly solves the model under random draws of substitution elasticities, most notably the Armington elasticity governing substitution between domestic and imported goods (ESUBD). Each draw reflects a plausible combination of elasticities consistent with their assumed probability distributions, allowing the distribution of model outcomes to be analyzed rather than relying on a single calibration.
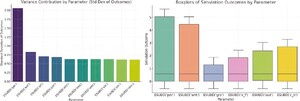
The approach most widely used is Systematic Sensitivity Analysis (SSA), introduced by Harrison and Vinod (1992) and implemented within the GTAP framework. This method assigns probability distributions to key exogenous parameters and evaluates the effects of parameter variation on endogenous model outcomes through repeated simulation. We follow Horridge et al. (2011) to execute systematic sensitivity analysis. We report the results of the analysis in the Appendix Figure A.3. Our results show that while the mean welfare effect of the policy is modest, the 95% confidence interval spans a range of approximately ±0.6 percentage points, depending on elasticity assumptions. The results cluster tightly around the baseline mean, and the distributions are symmetric with limited spread, indicating that the qualitative direction of the policy effects remains stable even when elasticities vary.
4.6 Political economy implications
Our results indicate that the 2025 tariff package was not merely an economic policy but also a politically strategic intervention deeply tied to U.S. agricultural constituencies. Within the Stolper–Samuelson framework, import tariffs on farm products increased agricultural returns and employment, directly benefiting sectors concentrated in key Midwestern states (Stolper and Samuelson, 1941). These outcomes align with the political motivation to protect farm incomes and mitigate electoral risks associated with trade-induced income declines. More broadly, our findings echo Samuelson’s later reflections that even when trade expands global efficiency, it can reduce the real gains for specific countries or sectors (Samuelson, 2004). In the case of U.S. agriculture, sustained productivity growth abroad has eroded American farmers’ terms of trade, creating political pressure for defensive tariffs. This reflects the “Samuelson Trap”: when countries passively rely on static comparative advantage but lose rents in the face of dynamic upgrading abroad, they are pushed toward protectionist responses.3
Our results further highlight the pressures facing U.S. agriculture under globalization: free trade pushes domestic wages and capital returns toward those of lower-cost suppliers abroad. By widening price gaps, the 2025 tariffs slowed this convergence, offering U.S. farmers a temporary buffer through trade aid payments (Balistreri et al., 2020). Politically, this “delayed adjustment” effect resonates with the demands of Midwestern farm states, which are pivotal in shaping trade policy. The geographic concentration of agricultural gains highlights the intersection between trade policy and electoral incentives — farm states that are politically pivotal received disproportionate protection and compensation (Choi and Lim, 2023; Mansfield and Solodoch, 2024).
5. Conclusions
At the time of writing, tariffs added in early 2025 remain in place or are increasing. This paper examines the potential effects of the United States’ tariff proposals in 2025 on the global economy. Using a calibrated applied general equilibrium model and recursive database update, we find significant impacts of the trade war on imports, exports, GDP, commodity prices, and welfare.
Our analysis demonstrates that the persistence or escalation of tariffs in 2025 would have significant consequences for global agricultural trade. Using a multi-region, multi-sector computable general equilibrium framework, we find that recent and proposed U.S. tariff measures trigger sharp declines in U.S. agricultural exports — particularly in high-value sectors — and cause substantial GDP and welfare losses for major trading partners including the United States, China, Canada, and Mexico. Retaliatory tariffs and reduced imports contribute to rising domestic commodity prices, amplifying pressures on both producers and consumers. At the same time, trade diversion effects benefit agricultural exporters such as Brazil and Vietnam, which experience measurable gains in output, GDP, and welfare. These results underscore the heightened vulnerability of U.S. agriculture to sustained trade tensions and highlight the importance of targeted policy interventions to buffer sectoral losses and promote resilience in the agricultural economy.
While our analysis provides useful insights into the macroeconomic and sectoral effects of alternative tariff scenarios, several caveats remain. First, the model does not consider strategic non-tariff measures and supply chain relocation dynamics that may amplify or dampen welfare impacts over time. Second, future trade policies, such as the U.S. proposal to impose even higher tariffs on selected imports, and China’s potential responses through export restrictions on critical inputs, including rare earth elements, could further reshape global production networks and welfare outcomes (Alfaro et al., 2025). Incorporating these evolving policy dimensions represents promising avenues for future research.
Acknowledgements
This work is supported by the Agriculture Economics and Rural Communities: Markets and Trade Program, project award no. 2022-67023-36727 and 2019-67023-29414, from the U.S. Department of Agriculture’s National Institute of Food and Agriculture. Any opinions, findings, conclusions, or recommendations expressed in this publication are those of the author(s) and should not be construed to represent any official USDA or U.S. Government determination or policy.
References
Ai, J., M. Li, T. Zhang and W. Zhang. 2025. Economic Impacts of the 2025 Trade Wars. Cornell SC Johnson College of Business Research Paper. Available online at https://papers.ssrn.com/sol3/papers.cfm?abstract_id=5262696
Alfaro, L., H. Fadinger, J.S. Schymik and G. Virananda. 2025. Trade and industrial policy in supply chains: directed technological change in rare earths (No. w33877). National Bureau of Economic Research, Cambridge, MA.
Amiti, M., S.J. Redding and D.E. Weinstein. 2019. The impact of the 2018 tariffs on prices and welfare. Journal of Economic Perspectives 33: 187–210.
Antrás, P. and D. Chor. 2022. Global value chains. Handbook of International Economics 5: 297–376.
Arndt, C. 1996. An Introduction to Systematic Sensitivity Analysis via Gaussian Quadrature. GTAP Technical Paper No. 2, Center for Global Trade Analysis, Purdue University, West Lafayette, IN.
Auclert, A., M. Rognlie and L. Straub. 2025. The macroeconomics of tariff shocks. National Bureau of Economic Research, Cambridge, MA.
Bagwell, K., R.W. Staiger and A. Yurukoglu. 2021. Quantitative analysis of multiparty tariff negotiations. Econometrica 89(4): 1595–1631.
Balistreri, E.J., C.E. Hart, D.J. Hayes, M. Li, L. Schulz, D.A. Swenson, W. Zhang and J.M. Crespi. 2018. The impact of the 2018 trade disruptions on the Iowa economy. Center for Agricultural and Rural Development, Iowa State University CARD Policy Briefs, Ames, IA.
Balistreri, E., W. Zhang and J. Beghin. 2020. The state-level burden of the trade war: interactions between the Market Facilitation Program and tariffs. Agricultural Policy Review: 103.
Balistreri, E.J., S.B. Ali and C. McDaniel. 2024. Tariff: the most beautiful word in the dictionary? Working paper. Available online at https://papers.ssrn.com/sol3/papers.cfm?abstract_id=5078359
Bown, C.P. 2025. Trump’s trade war timeline 2.0: an up-to-date guide. Peterson Institute for International Economics, RealTime Economics, Washington, DC. Available online at https://www.piie.com/blogs/realtime-economics/2025/trumps-trade-war-timeline-20-date-guide
Bown, C.P., L. Caliendo, F. Parro, R.W. Staiger and A.O. Sykes. 2024. Reciprocity and the China shock. National Bureau of Economic Research, Cambridge, MA.
Brander, J.A. 1995. Strategic trade policy. Handbook of International Economics 3: 1395–1455.
Choi, J. and S. Lim. 2023. Tariffs, agricultural subsidies, and the 2020 US presidential election. American Journal of Agricultural Economics 105(4): 1149–1175.
Fajgelbaum, P.D., P.K. Goldberg, P.J. Kennedy and A.K. Khandelwal. 2020. The return to protectionism. The Quarterly Journal of Economics 135(1): 1–55.
Fajgelbaum, P., P. Goldberg, P. Kennedy, A. Khandelwal and D. Taglioni. 2024. The US–China trade war and global reallocations. American Economic Review: Insights 6(2): 295–312.
Farrokhi, F. and H.S. Pellegrina. 2023. Trade, technology, and agricultural productivity. Journal of Political Economy 131(9): 2509–2555.
Fetzer, T. and C. Schwarz. 2021. Tariffs and politics: evidence from Trump’s trade wars. The Economic Journal 131(636): 1717–1741.
Flaaen, A., A. Hortaçsu and F. Tintelnot. 2020. The production relocation and price effects of US trade policy: the case of washing machines. American Economic Review 110(7): 2103–2127.
Gouel, C. 2016. Trade policy coordination and food price volatility. American Journal of Agricultural Economics 98(4): 1018–1037.
Gouel, C. and D. Laborde. 2021. The crucial role of domestic and international market-mediated adaptation to climate change. Journal of Environmental Economics and Management 106: 102408.
Gouel, C. and S. Jean. 2015. Optimal food price stabilization in a small open developing country. The World Bank Economic Review 29(1): 72–101.
Grant, J.H., S. Arita, C. Emlinger, R. Johansson and C. Xie. 2021. Agricultural exports and retaliatory trade actions: an empirical assessment of the 2018/2019 trade conflict. Applied Economic Perspectives and Policy 43(2): 619–640.
Grossman, G.M. and E. Helpman. 1994. Protection for sale. The American Economic Review 84(4): 833–850.
Harrison, G.W. and H.D. Vinod. 1992. The sensitivity analysis of applied general equilibrium models: completely randomized factorial sampling designs. The Review of Economics and Statistics 74: 357–362.
Headey, D. 2011. Rethinking the global food crisis: the role of trade shocks. Food Policy 36(2): 136–146.
Horridge, J.M. and K. Pearson. 2011. Systematic sensitivity analysis with respect to correlated variations in parameters and shocks. GTAP Technical Papers 3496, Center for Global Trade Analysis, Department of Agricultural Economics, Purdue University, West Lafayette, IN.
Hsiao, A., J. Moscona and K. Sastry. 2024. Food policy in a warming world. Working Paper 32539. National Bureau of Economic Research, Cambridge, MA.>
Ignatenko, A., A. Lashkaripour, L. Macedoni and I. Simonovska. 2025. Making America great again? the economic impacts of Liberation Day tariffs. Department of Economics, Norwegian School of Economics, Bergen.
Janzen, J.P. and N.P. Hendricks. 2020. Are farmers made whole by trade aid? Applied Economic Perspectives and Policy 42(2): 205–226.
Jares, J.A. and N. Malhotra. 2025. Policy impact and voter mobilization: Evidence from farmers’ trade war experiences. American Political Science Review 119(2): 847–869.
Lakatos, C. and T. Walmsley. 2012. Investment creation and diversion effects of the ASEAN–China free trade agreement. Economic Modelling 29(3): 766–779.
Li, M., E.J. Balistreri and W. Zhang. 2020. The US–China trade war: tariff data and general equilibrium analysis. Journal of Asian Economics 69: 101–116.
Mansfield, E.D. and O. Solodoch. 2024. Political costs of trade war tariffs. The Journal of Politics 86(3): 1098–1103.
Porteous, O. 2019. High trade costs and their consequences: an estimated dynamic model of african agricultural storage and trade. American Economic Journal: Applied Economics 11(4): 327–366.
Samuelson, P.A. 2004. Where Ricardo and Mill rebut and confirm arguments of mainstream economists supporting globalization. Journal of Economic Perspectives 18(3): 135–146.
Stolper, W.F. and P.A. Samuelson. 1941. Protection and real wages. The Review of Economic Studies 9(1): 58–73.
Tombe, T. 2015. The missing food problem: Trade, agriculture, and international productivity differences. American Economic Journal: Macroeconomics 7(3): 226–258.
U.S. Department of Agriculture, Economic Research Service. 2025. Outlook for U.S. agricultural trade. U.S. Department of Agriculture, Economic Research Service, Washington, DC. Available online at https://www.ers.usda.gov/topics/international-markets-us-trade/us-agricultural-trade/outlook-for-us-agricultural-trade
Walmsley, T.L., B. Dimaranan and R.A. McDougall. 2000. A base case scenario for the dynamic GTAP model. Center for Global Trade Analysis, Purdue University, West Lafayette, IN.
Appendix
This appendix shows the additional figures and tables not presented in the main text.
A1. The GTAP Model Details
The Global Trade Analysis Project (GTAP) model is a multi-region, multi-sector computable general equilibrium (CGE) framework used extensively to study international trade and global economic shocks. It represents the interactions of producers, households, governments, and international trade flows through a system of nonlinear equations. Below, we summarize the core components of the model.
A1.1 Production
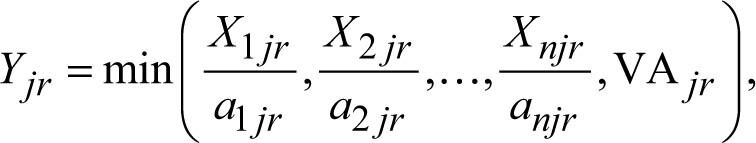
In the GTAP model, production is assumed to be a nested structure. At the top level, output is a Leontief function of intermediate inputs and a value-added composite:
Citation: International Food and Agribusiness Management Review 2026; 10.22434/ifamr.1388
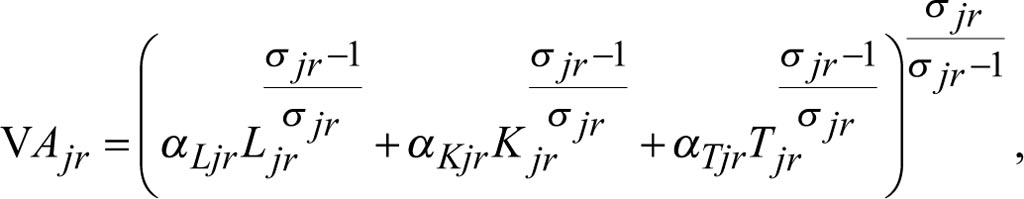
where Xijr is intermediate input i and aijr is the input-output coefficient, and VAjr is the value-added composite. Value added is represented by a CES function of primary factors:
Citation: International Food and Agribusiness Management Review 2026; 10.22434/ifamr.1388
where Ljr, Kjr, and Tjr denote labor, capital and land, respectively,
A1.2 Consumption
Households receive income from factor endowments and taxes, which they allocate to private consumption, government demand, and savings. Household utility in region r is modeled using a CES function of composite goods:
Citation: International Food and Agribusiness Management Review 2026; 10.22434/ifamr.1388
where Cir is consumption of good i and
A1.3 International trade
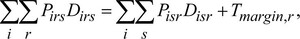
International trade is modeled with the Armington assumption, which treats goods as differentiated by origin. Composite demand for good i in region r is:
Citation: International Food and Agribusiness Management Review 2026; 10.22434/ifamr.1388
where Dirs is demand for imports of good i from source s,
A1.4 Market clearing
All markets are clear in equilibrium. For goods:
Citation: International Food and Agribusiness Management Review 2026; 10.22434/ifamr.1388
where supply equals domestic and export demand. For factors, such as labor:
Citation: International Food and Agribusiness Management Review 2026; 10.22434/ifamr.1388
where aggregate supply equals sectoral use.
A1.5 Macro balances
Two macro conditions to close the model:
(1) Trade balance
Citation: International Food and Agribusiness Management Review 2026; 10.22434/ifamr.1388
(2) Income balance
Citation: International Food and Agribusiness Management Review 2026; 10.22434/ifamr.1388
where Gr is government expenditure and Sr savings.
The GTAP model is solved numerically as a system of simultaneous equations ensuring equilibrium across all regions and markets. Policy shocks are introduced as exogenous changes to relevant parameters. The model then computes the new equilibrium, producing counterfactual outcomes for trade flows, factor returns, welfare, and emissions.
A2. Sensitivity analysis
The numerical results of a computable general equilibrium model depend on the specification of a number of exogenous parameters, including elasticities of substitution, income elasticities of demand, and trade elasticities. Since these parameters are typically estimated or calibrated with considerable uncertainty, it is important to evaluate the robustness of simulation outcomes to alternative assumptions.
The approach most widely used is Systematic Sensitivity Analysis (SSA), introduced by Harrison and Vinod (1992) and implemented within the GTAP framework by Arndt (1996). This method assigns probability distributions to key exogenous parameters and evaluates the effects of parameter variation on endogenous model outcomes through repeated simulation.
A3. Additional figures and tables
US Exports to China of Oil Seeds etc. (left) and Canada of Vegetables etc. (right). Data source: US Census International Trade Data. The blue shaded area highlights the period of the NBER-defined U.S. recession and red shaded areas highlight periods of significant tariff escalation.
Citation: International Food and Agribusiness Management Review 2026; 10.22434/ifamr.1388
US imports from Canada of oil seeds etc. (left) and Mexico of vegetables etc. (right). Data source: US Census International Trade Data. The blue shaded area highlights the period of the NBER-defined US recession, red shaded areas highlight periods of significant tariff escalation.
Citation: International Food and Agribusiness Management Review 2026; 10.22434/ifamr.1388
Results of systematic sensitivity analysis. This figure compares the range and median outcomes across several parameters. The variance decomposition shows which parameters contribute most to the variance in results. The distributions are centered around the baseline mean and are relatively tight. The relatively symmetric and bounded distributions suggest that the model’s qualitative predictions are robust.
Citation: International Food and Agribusiness Management Review 2026; 10.22434/ifamr.1388
Change in export of the U.S. agricultural commodities (%).
Citation: International Food and Agribusiness Management Review 2026; 10.22434/ifamr.1388
Change in Imports of the U.S. agricultural commodities (%).
Citation: International Food and Agribusiness Management Review 2026; 10.22434/ifamr.1388
Change in production of the U.S. agricultural commodities (%).
Citation: International Food and Agribusiness Management Review 2026; 10.22434/ifamr.1388
Change in production of the China agricultural commodities (%).
Citation: International Food and Agribusiness Management Review 2026; 10.22434/ifamr.1388
Change in GDP under Scenarios 1–4 (%).
Citation: International Food and Agribusiness Management Review 2026; 10.22434/ifamr.1388
Bilateral trade between the U.S. and other economies in Scenario 1 (%).
Citation: International Food and Agribusiness Management Review 2026; 10.22434/ifamr.1388
Bilateral trade between the U.S. and other economies in Scenario 2 (%).
Citation: International Food and Agribusiness Management Review 2026; 10.22434/ifamr.1388
Bilateral trade between the U.S. and other countries/regions in Scenario 3 (%).
Citation: International Food and Agribusiness Management Review 2026; 10.22434/ifamr.1388
Corresponding author
A U.S. trade court blocked some “reciprocal” tariffs on May 29, but steel, aluminum, and certain Chinese goods tariffs persisted, with an appeals court allowing them to remain.
We do not consider the transshipped in the scenarios because it is difficult to capture this in the GTAP database.
In addition, we emphasize the importance of political economy and compensatory mechanisms in sustaining such policies. Recent evidence shows that trade-aid payments — including the U.S. Market Facilitation Program — partly offset farmers’ income losses but also reinforced political loyalty among affected constituencies (Balistreri et al., 2020; Janzen and Hendricks, 2020; Jares and Malhotra, 2025). The discussions reflect how these payments interact with electoral incentives, consistent with the “Samuelson trap” logic that redistributive politics can perpetuate inefficient trade interventions. This integration strengthens both the theoretical and political economy foundations of our analysis, linking Samuelson’s classical insights on trade distributional effects to the contemporary dynamics of trade policy persistence.


