Abstract
The most recent disruption of the global fertilizer supply due to the COVID-19 pandemic and the Russia-Ukraine conflict resulted in a global fertilizer crisis characterized by unprecedented price hikes and shortages. Africa relies heavily on fertilizer imports to satisfy its consumption needs and was severely affected by the fertilizer crisis. We used a comparative case study approach based on primary and secondary data to evaluate the effects of the fertilizer crisis and the response of various stakeholders at country, intra-regional, and micro-level (smallholder farmers) across fertilizer supply chains in Morocco, Ghana, and Kenya. Local fertilizer prices increased two to threefold, with associated reductions in accessibility, availability, and use of fertilizers, with significant variability among and within countries. At the macro-level, government-funded subsidies were a common crisis mitigation response across countries, while other responses were country-specific. Farm-level responses and coping strategies included reductions in the quantities of fertilizer applied and in the cropping area, which were expected to reduce crop productivity. Cases were also observed where households used savings and credit to purchase fertilizers or traveled longer distances to access fertilizers. This study provides critical insights into strategies for mitigating the impact of future fertilizer supply disruptions.
1. Introduction
Fertilizers play a crucial role in crop production, accounting for up to 50% of global crop yield (Dobermann, 2007; Reetz, 2016). Most fertilizers are produced from naturally occurring mineral deposits, except for nitrogen (N), which is produced through industrial fixation of atmospheric N (Chianu and Mairura, 2012; Reetz, 2016). Phosphorus (P) and potassium (K) deposits are unevenly distributed and concentrated in a few countries. China, Morocco, and Russia control 57% of global phosphate trade, while Canada, Russia, and Belarus dominate potash (Hebebrand and Glauber, 2023). For N, countries with large reserves and low gas or coal prices, such as Russia, China, and Qatar, have a competitive advantage (Hebebrand and Glauber, 2023). Consequently, fertilizer production is concentrated in specific countries, which presents significant supply chain risks (Reetz, 2016).
Increasing fertilizer use in Africa is crucial for boosting agricultural productivity, ensuring food security, and combating land degradation. At 18 kg/ha, Africa’s fertilizer use is well below the global average of 119 kg/ha (FAO, 2023), and inadequate for optimizing crop production and sustaining soil fertility. Low fertilizer use in Africa is associated with factors such as low availability, high costs, inflation, limited infrastructure, inconsistent crop responses, and risk aversion among smallholder farmers. For example, fertilizer prices in much of Africa are at least four times higher than those in Europe (Intelligence, 2016), while farmers seldom access fertilizers in a sufficient and timely manner. At the 2024 Africa Fertilizer and Soil Health Summit, African Heads of States reaffirmed the continental commitment to increase fertilizer use through improved access to affordable fertilizers to boost crop productivity (African Union, 2024b). The Nairobi declaration, signed during this Summit set the target to triple fertilizer use from the current 18 kg nutrients/ha to 54 kg nutrients/ha by 2034 (African Union, 2024a).
While fertilizer use in Africa remains generally low, the continent’s heavy dependence on imports, particularly from Russia, Ukraine and Belarus, makes it highly vulnerable to fertilizer supply disruptions (AfricaFertilizer, 2024c; Mingolla and Rosa, 2025). These disruptions are further aggravated by sub-optimal supply chains characterized by high inland transport costs, logistical inefficiencies, small shipment volumes, and inadequate storage infrastructure (Benson and Mogues, 2018; Hernandez et al., 2018). The outbreak of the conflict between Russia and Ukraine in early, 2022 worsened supply chain disruptions initially triggered by the Covid-19 pandemic (Ben Hassen and El Bilali, 2022; Hebebrand and Glauber, 2023). This triggered a global fertilizer crisis which we define as the unprecedented rise in fertilizer prices (Figure 1) and fertilizer shortages (FAO, 2023; Ibendahl, 2022; IFASTAT, 2024), as a result of the aforementioned supply chain disruptions. The global fertilizer crisis hereafter referred to as the “fertilizer crisis” stemmed from infrastructure damage, export route interruptions, and sanctions on Russia and its allies (Hebebrand and Laborde Debucquet, 2023; Mahlstein et al., 2022). Russia is the largest exporter of N fertilizers, contributing about 21% of global exports, while Russia and Belarus supply 40% of the world’s potash (IFASTAT, 2024; Schnitkey et al., 2022). In addition, the sanctions affected energy costs in Europe, resulting in increased fertilizer production costs (Schnitkey et al., 2022). The combined effects of increased fertilizer prices and reduced availability forced smallholder farmers in Africa, already operating on tight budgets, to substantially reduce or abandon fertilizer use (Amankwah et al., 2024), resulting in low crop productivity and worsening food insecurity (Nations, 2023). This coincided with higher global food prices (Figure 1) due to disrupted exports from Ukraine, worsening hunger and inflation across the African continent (Laber et al., 2023; Mwatu, 2023). There is however limited data with adequate temporal and spatial detail that allow for a clear understanding of how international input price shocks are transmitted to farmers in low-income countries (Willwerth et al., 2025) such as those in Africa. This study makes four key contributions to the existing literature. First, it examines the temporal dynamics of local fertilizer prices in Africa as influenced by global shocks under varying market conditions. Second, it quantifies the impacts of these global shocks on the affordability, availability, accessibility, and use of fertilizers across different spatial scales within the continent. Third, it documents the coping strategies adopted by farmers across diverse socio-economic contexts to mitigate the effects of global shocks on fertilizer prices and supply. Finally, it evaluates the effectiveness of macro-level interventions aimed at mitigating adverse effects of global shocks on the affordability, availability and accessibility of fertilizers at different spatial scales.

Trends in proportional change in food and fertilizer prices (DAP and urea) for the period January 1995 to December 2023. Prices in January 1995 are used as baseline values. The dotted vertical line represents the onset of the Russia–Ukraine conflict. Source: www.indexmundi.com.
Citation: International Food and Agribusiness Management Review 2026; 10.22434/ifamr.1370
We hypothesized that the fertilizer crisis exerted heterogeneous effects on prices and supply across countries and their subnational regions. Furthermore, we hypothesized that coping strategies at the macro (national) and micro (farm) levels to mitigate the fertilizer crisis likewise varied between and within countries, reflecting differences in industry structure, policy frameworks, fertilizer‐use intensity, and output‐market stability. This study, therefore, sought to use primary and secondary data from selected African countries to address four questions: (i) To what extent were prices, availability, accessibility and use of fertilizer affected by the fertilizer crisis? (ii) What were the responses to the fertilizer crisis at the macro-level by various stakeholders, including government, non-governmental, private sector and fertilizer industry? (iii) How did the fertilizer crisis affect investment decisions at the farm-level? and (iv) What insights can be gained from the fertilizer crisis for managing future shocks and building long-term resilience? Findings from this study provide crucial lessons on the context-specific effects of the fertilizer crisis, and the effectiveness of responses to the fertilizer crisis in varied geographies.
2. Theoretical framework
This study draws on an integrated framework combining insights from Global Value Chain (GVC), Institutional and Political Economy, and Risk-Resilience theories to explain the heterogeneous effects of the fertilizer crisis across Ghana, Kenya, and Morocco. From a GVC perspective where production and distribution systems are organized across transnational networks that integrate suppliers, traders, and consumers in geographically dispersed chains (Gereffi and Fernandez-Stark, 2011), disruptions in upstream production, trade, or logistics can cascade through transnational supply networks, heightening vulnerability in import-dependent downstream regions (Ivanov and Dolgui, 2021). These disruptions include climatic, biological, logistical, infrastructural, and socio-political and public regulations, that affect production, processing and distribution across the supply chain, directly affecting the availability, access, utilization and stability of products (Rojas-Reyes et al., 2024). Supply chain disruptions can be of low probability but high-impact, or high probability with lower impact (Umar et al., 2017). Depicting a disruption typology of low probability and high consequences, Africa’s import dependence is expected to have resulted in severe downstream effects, following fertilizer prices and supply shocks emanating from the Russia–Ukraine conflict. Agricultural supply chain resilience literature outlines a mix of strategic, operational, technological and policy and institutional level measures to mitigate supply chain disruptions (Belhadi et al., 2024; Deconinck et al., 2023; Sutar et al., 2025). The Institutional and Political Economy Theory postulates that economic performance and market outcomes are not only shaped by prices and supply-demand forces, but additionally by institutions, power relations, and policy frameworks that govern how actors interact (Dorward, 2009; North, 1990), underscoring the role of governance structures in mediating global shocks. Differences in institutional strength and involvement, and policy frameworks between countries are therefore expected to have strongly influenced the impact of, and responses to fertilizer supply shocks at the macro level. At the micro level, this study was guided by the Risk and Resilience theories (Chambers and Conway, 1992; Folke, 2016), to explain how farmers coped with fertilizer supply distortions and price hikes through diverse coping strategies. Behavioral insights from the Prospect Theory (Kai-Ineman and Tversky, 1979) helped to further clarify variations in decision-making under uncertainty.
3. Contextual background
3.1 Study countries
The study was conducted in Kenya, Ghana and Morocco, three countries located in East, West and North Africa, respectively. The three countries vary widely in their farming systems, fertilizer production capacity, consumption patterns, and fertilizer policies and regulations. The selected countries represent a wide range of conditions relevant to many countries in Africa.
The structure of fertilizer markets
Fertilizer market structures in Ghana, Kenya and Morocco differ markedly in their levels of liberalization, domestic production capacity, and price determination mechanisms (Table 1). Ghana’s fertilizer market operates under a hybrid system combining private importation, and a government-controlled distribution system. The Planting for Food and Jobs (PFJ) initiative and the Ghana Cocoa Board (COCOBOD) dominate fertilizer distribution, jointly accounting for more than 80% of national fertilizer use (Odionye et al., 2020). Ghana has no domestic fertilizer production and depends entirely on imports, mainly from Europe (Table 1; see also Table A1 in the Appendix), with blending capacity limited to about 550 metric tons per hour (mtph) (AfricaFertilizer, 2024a). Fertilizer prices are largely import-driven, with cost, insurance, and freight (CIF) costs contributing nearly four-fifths of the final price (Figure A1 in the Appendix) before subsidies (Odionye et al., 2020).
In contrast, Kenya’s fertilizer market is relatively liberalized, with private agro-dealers playing a central role in distribution alongside the government-managed National Cereals and Produce Board (NCPB), which controls about a quarter of total supply (Table 1). Farmers producing high-value export crops such as tea and coffee access fertilizer through specialized integrated supply chains, reflecting a dual system that serves both market-priced and subsidized segments. Like Ghana, Kenya relies entirely on imports, primarily from Europe and the Middle East (Table 1; see also Table A2 in the Appendix), but has a smaller blending capacity of around 300 mtph (AfricaFertilizer, 2024a). Fertilizer pricing is similarly driven by CIF costs, which account for about 80% of the Free on Truck (FOT) price (Figure A2 in the Appendix), with additional costs from transport, bagging, and dealer margins shaping retail prices.
Summary of fertilizer market structures and fertilizer use in Ghana, Kenya and Morocco.
Citation: International Food and Agribusiness Management Review 2026; 10.22434/ifamr.1370
Morocco’s fertilizer sector presents a stark contrast to the import-dependent systems of Ghana and Kenya (Table 1). The country’s market is anchored by its vast phosphate reserves and vertically integrated production under the state-owned OCP (Amachraa, 2023), making Morocco a global leader in phosphorus fertilizer production and export. Local markets are supplied primarily through OCP’s partnerships with distributors (OCP, 2022), while straight N and K fertilizers are imported and blended with locally produced P fertilizers to develop a range of NPK formulations. In contrast to the subsidy- and market-driven pricing systems in Ghana and Kenya respectively, Morocco’s fertilizer prices are government-regulated through farmer preferential prices fixed annually before the main cropping season (Amachraa, 2023), providing relative stability but limiting responsiveness to global market dynamics.
Collectively, these differences underscore three distinct fertilizer market typologies: Ghana’s subsidy-dependent and import-driven system, Kenya’s liberalized yet import-reliant market with active private participation, and Morocco’s resource-based, state-dominated industry anchored on domestic phosphate production.
Fertilizer use
Fertilizer use patterns across Ghana, Kenya and Morocco reveal notable contrasts in application intensity, target crops, and fertilizer formulations (Table 1). Application rates are highest in Kenya, followed by Morocco and Ghana, with variable trends in the recent past (Table 1; see also Figures A3–A5 in the Appendix). Fertilizer use in Ghana is dominated by NPK formulations (Figure A3A in the Appendix), with higher application rates in cash crops such as oil palm and cocoa, while maize accounts for the largest share of fertilizer consumption among food crops (Ariga and Hefferman, 2012). In Kenya, fertilizer consumption is dominated by diammonium phosphate (DAP), calcium ammonium nitrate (CAN), NPK formulations, and urea (Figure 4A in the Appendix), with total fertilizer use highest in maize, while application rates are greatest in flowers and tea (Table A3 in the Appendix). In Morocco, fertilizer use is dominated by NPK formulations and straight N fertilizers, with consumption highest in wheat and application rates greatest in sugar beet and vegetables (Table A4 in the Appendix). Most NPK compounds used in wheat are formulated to contain an equal or higher ratio of P relative to N and K, a strategy influenced by the high P production in Morocco, which helps keep NPK fertilizer prices relatively low. These contrasting patterns highlight the influence of cropping systems, domestic resource endowments, and market structures on fertilizer use behavior across the three countries.
4. Methodology
4.1 Description of study sites
Ghana has 16 administrative regions subdivided into districts. The study covered four regions: Bono East (Kintampo South), North East (West Mamprusi), Savannah (Nanumba North, North East Gonja), and Northern (Nanumba North). These regions receive 750–1050 mm of unimodal rainfall from June to November. Kenya’s decentralized political administration includes 47 counties, subdivided into sub-counties. Study sites were in the counties of; Siaya (Gem), Uasin Gishu (Soy), and Embu (Embu-East). These rural counties have high population densities (216–393 km-²). Farm sizes vary from <1 ha in Siaya, to 2 ha in Embu, and 3–50 ha in Uasin Gishu. Rainfall is bimodal in Siaya and Embu, and unimodal in Uasin Gishu. Morocco has 12 regions with prefectures as lower units. Study sites were in Grand Casablanca-Settat (Settat, Berrechid) and Fez-Meknes (Meknes) regions. Agriculture is a major livelihood source in Settat and Berrechid. Settat and Berrechid receive 250–350 mm of rain annually, while Meknes, with a temperate semi-arid climate, gets 450 mm. Rainfed agriculture is predominant across the three study sites, with farms sizes averaging 5 ha (Abail et al., 2014; El Ansari et al., 2016).
4.2 Study design
We employed a comparative multi-level mixed methods design to evaluate the effects of the fertilizer crisis across Ghana, Kenya, and Morocco. Our approach integrated cross-country, intra-regional, and household-level data to capture variation on the impacts of, and responses to the fertilizer crisis. Primary data was collected from both macro- and micro-level stakeholders, while secondary data was collected from various sources at the macro-level. The regions of focus in each country were purposively selected to represent the main growing areas of dominant cereal crops. In Kenya and Ghana, maize (Zea mays) is the leading cereal, accounting for about 80% and 60% of total annual cereal production, respectively, with similar proportions of total cropped area under cereals (FAOSTAT, 2023). In Morocco, wheat (Triticum aestivum and Triticum durum) dominates, contributing about 75% of annual cereal production and about 65% of the cereal area (FAOSTAT, 2023). These major production zones were selected to ensure representativeness of the cropping systems expected to be most affected by fertilizer price and supply disruptions.
This study design leverages structural and policy variation across three distinct fertilizer systems. Morocco represents a state-integrated, resource-endowed model anchored in domestic phosphate production, Ghana exemplifies a subsidy-driven system dominated by government programs such as PFJ and COCOBOD, while Kenya reflects a semi-liberalized market combining private agro-dealers with partial state intervention through the NCPB. These contrasts create a natural comparative framework for examining how institutional configurations mediate global supply shocks. The design is both novel and appropriate, integrating global, national, and farm-level perspectives within a unified analytical framework that links structural exposure, institutional capacity, and behavioral adaptation, providing a transparent basis for identifying strategies to mitigate future fertilizer supply disruptions.
4.3 Data collection and management
Primary data
Primary data was collected using farmer household surveys, focus group discussions (FGDs), and key informant interviews (KIIs). These tools enabled systematic gathering of standardized information from the three target countries, facilitating analysis and comparison across countries. The farmer survey, conducted between January and March, 2023 using a structured digitized questionnaire (SurveyCTO Collect™), captured data for the period, 2019–2022 on household characteristics, livelihoods, land use, crop production and management, input use, food security, and access to inputs and credit. The FGDs and KIIs used semi-structured interview guides consisting of unstructured probing questions, allowing triangulation of findings from the surveys. Data was collected by well-trained enumerators, equipped with identical tablets to ensure consistency in data collection, and minimize technical variability across survey teams. The study targeted representative samples of micro-level actors (farmers) and macro-level actors (government, non-governmental, and fertilizer industry).
For the farmer surveys, sub-regions of focus were purposively selected, after which lists of all farm households cultivating the target cereal crops were obtained from Ministry of Agriculture officials. A simple random sampling approach was then applied, selecting every odd-numbered household from each list to serve as the sampling unit. Since none of the households had been exposed to prior study interventions, all had an equal probability of selection, minimizing bias in the aggregate sample. Participation was voluntary, targeting at least 60 households per study area, resulting in country-specific variations in sample size (Table 2). FGD participants were chosen with the assistance of local extension officers to ensure diversity in age and gender, while key informants were identified through a snowball sampling technique (Parker et al., 2019) based on their expertise and willingness to participate. In total, 637 farmer surveys, 46 KIIs, and 28 FGDs were conducted across the three countries (Table 2). Collected data was processed to check for omissions, typographic errors, and standardization of measurement units.
Summary of quantitative and qualitative primary data collected at the micro- and macro-levels in Kenya, Ghana and Morocco
Citation: International Food and Agribusiness Management Review 2026; 10.22434/ifamr.1370
Secondary data
Secondary data on international fertilizer prices, national retail fertilizer prices, apparent fertilizer and nutrient use, and support provided by government subsidy programmes in Ghana and Kenya for the period up to December, 2022 were accessed from AfricaFertilizer (2024c) and IFASTAT (2024). Relevant data for Morocco was mainly sourced from IFASTAT (2024) and the National Company for the Marketing of seeds in Morocco (SONACOS: Société Nationale de Commercialisation des Semences), a key main distributor of fertilizers in Morocco.
4.4 Data analysis
Primary data
Ten variables initially used to assess the effects of the fertilizer crisis were consolidated into four binary indicators: availability, affordability, accessibility, and use. Availability referred to the physical presence and sufficient supply of fertilizer; affordability captured whether fertilizer prices were within farmers’ financial ability to purchase; while accessibility reflected the ease with which farmers could obtain fertilizer. The consolidation is summarized as follows:
(i) Availability: combined responses on fertilizer availability, timeliness of provision, size of packaging, and the number and types of fertilizers in the market. It was coded as a binary variable where 1=decreased availability (i.e., reduced fertilizer supply, delayed provision, increased packaging size, or fewer fertilizer types in the market) and 0=all other response combinations. The corresponding survey question asked: “Compared to, 2021, how would you rate fertilizer availability, timeliness of fertilizer provision, size of packaging, and the number and types of fertilizers in the market?”
(ii) Affordability: combined farmer responses on fertilizer prices and transport costs, coded as a binary variable where 1=decreased affordability (i.e., increased fertilizer prices and/or higher transport costs) and 0=all other response combinations. The corresponding survey question asked: “Compared to, 2021, (a) how would you rate fertilizer prices, and (b) the costs associated with transporting fertilizer from the source to your farm?”
(iii) Accessibility: combined responses on access to fertilizer and distance to the fertilizer source. It was coded as a binary variable where 1=decreased accessibility (i.e., reduced access to fertilizer and/or increased distance to the fertilizer source) and 0=all other response combinations. The corresponding survey question asked: “Compared to, 2021, how would you rate accessibility to fertilizer and distance to the fertilizer source?”
(iv) Use: combined responses on fertilizer use and timeliness of purchase. It was coded as a binary variable where 1=decreased fertilizer use (i.e., reduced application and/or delayed purchase compared to usual timing) and 0=all other response combinations. The corresponding survey question asked: “Compared to 2021, how would you rate fertilizer use and the timeliness of fertilizer purchase?”
To assess the effects and responses to the fertilizer crisis by micro-level actors, primary data (qualitative and quantitative) were analyzed using frequencies, standard deviations, t- F- and
Typologies were constructed using PCA and Cluster Analysis. Cluster analysis grouped similar data points based on shared characteristics and behaviors, while PCA reduced dimensionality among correlated variables. Prior to analysis, the combined indicators of fertilizer crisis effects and investment decisions were tested for suitability using the Kaiser–Meyer–Olkin (KMO) and Bartlett’s sphericity assumptions tests. The results (KMO=0.643; Bartlett’s p<0.001) confirmed sampling adequacy and variable suitability for PCA. Principal components with eigenvalues > 1 were retained, resulting in three components that together explained 60% of the total variance. PCA scores for each household were saved and used as inputs for cluster construction. Clustering was performed using agglomerative hierarchical clustering with Ward’s linkage, and cluster number selection was guided by inspection of the dendrogram. Differences among clusters were evaluated using chi-square tests for categorical variables and the Kruskal-Wallis non-parametric test for continuous variables, followed by pairwise comparisons where significant. Variables used to construct typologies were:
(i) variables for the fertilizer crisis effects (fertilizer affordability, availability, accessibility, and use) comparing, 2022 to, 2021.
(ii) variables for input investment decisions (if households used fertilizers, compost and manure, improved seed varieties, pesticides, and irrigation).
Secondary data
Relevant components of secondary data that corresponded to the various study objectives were extracted, summarized, and presented in appropriate formats including Figures, Tables, and narratives. In some cases, additional relevant variables such as proportional change in fertilizer prices were developed using the original data accessed.
5. Results
5.1 Global and regional trends in fertilizer prices
Long-term data show a general upward trend in international DAP and urea prices (Figure 1). The Russia-Ukraine conflict triggered sharp price spikes, reaching levels last seen during the 2008 fertilizer crisis. Short-term (January 2020–December 2023) data on international FOB and CIF prices in Kenya highlighted price trends before, during, and after the conflict (Figure A6 in the Appendix). Before the conflict, urea and DAP prices were similar across sources, but post-conflict, DAP prices varied significantly, with Russian products being cheaper than other sources. By 2023, prices stabilized across sources, mirroring pre-conflict trends. CIF prices in Kenya closely followed global market trends with no time lag. Urea prices peaked twice, late, 2021 and post-conflict, while DAP prices peaked only after the conflict began. Monthly urea retail prices in six African countries (January 2021–December 2023) showed major price differences before, during, and after the fertilizer crisis (Figure A7 in the Appendix). The highest prices and widest country disparities occurred in late, 2021 and during the fertilizer crisis.
5.2 Case studies: Impacts of the fertilizer crisis in Ghana, Kenya and Morocco
Household characteristics
Most surveyed households used fertilizer (Table 3), with highest use in Kenya (92%) and lowest in Ghana (68%). Credit access was lowest in Ghana (17%), especially in the Northern region, but higher in Kenya (71%) and Morocco (67%). Off-farm income was most common in Kenya (51%) and least in Morocco (28%). Moroccan households cultivated the largest land area (>6 ha), while Kenyan households had the smallest (0.8 ha).
Summary of select household characteristics for households surveyed for impacts and responses to the fertilizer crisis in Kenya, Ghana and Morocco
Citation: International Food and Agribusiness Management Review 2026; 10.22434/ifamr.1370
Fertilizer crisis effects on availability, accessibility, and use of fertilizer
The impact of the fertilizer crisis on affordability, availability, accessibility, and usage was variable across study countries (Figure 2). Affordability was most affected, with most households reporting higher fertilizer prices and transport costs. In Kenya, over 70% of households, particularly in Uasin Gishu, experienced price hikes (Figure 2A). In Ghana, 80% of households in Bono East and Savannah reported increased prices, while Morocco saw universal price hikes (Figure 2B,C). Transport costs also increased, especially in Ghana and Morocco (Figure 2B,C). In Kenya and Ghana, regions where households reported higher fertilizer prices also had the greatest number of respondents indicating higher transport costs (Figure 2A,B).
Effects of the fertilizer crisis on affordability, availability, accessibility, and use of fertilizers among surveyed households in (A) Kenya, (B) Ghana and (C) Morocco.
Citation: International Food and Agribusiness Management Review 2026; 10.22434/ifamr.1370
Fertilizer availability declined sharply in Ghana and Kenya due to supply delays and fewer product options (Figure 2A,B). More than half of respondents in Ghana’s Savannah and Bono East regions and Kenya’s Embu and Uasin Gishu counties reported shortages. Fertilizer availability was less constrained in Morocco (Figure 2C). Fertilizer accessibility declined as supplier distances increased, particularly in Embu and Uasin Gishu (Kenya) and Bono East and Northern regions (Ghana) (Figure 2A,B). Fertilizer use declined across all countries (Figure 2).
Fertilizer crisis effects on retail prices
Urea retail prices increased sharply in late 2021 and declined in 2023, with variations across countries (Figure 3). In Kenya, prices surged in late 2021, dipped briefly, then spiked again after the Russia-Ukraine conflict, peaking at 1234 USD/t in June 2022. Prices later dropped to 575 USD/t by December 2023, matching early 2021 levels (Figure 3A). In Ghana, prices rose steeply in early 2021, followed by a cut in supply (December 2021–January 2022). Urea became available in February 2022 at 1394 USD/t (252% above January 2021). Prices then decreased but remained above 2021 levels by December 2023 (Figure 3A). In Morocco, prices were stable at 370 USD/t until August 2021, then increased to 700 USD/t, holding steady for a year before rising to 900 USD/t (143% above January 2021). By late 2023, prices dropped to 340 USD/t, lower than early 2021 (Figure 3A).
Monthly trends in (A) urea fertilizer retail prices in the study countries, and (B) proportional change in urea retail prices relative to prices in January 2021, for the period of January 2021 to December 2022. Broken lines indicate missing data due to urea shortage in Ghana. Adapted from www.africafertilizer.org and SONACOS.
Citation: International Food and Agribusiness Management Review 2026; 10.22434/ifamr.1370
Macro-level responses to the fertilizer crisis
Governments implemented farmer support (n=45) and fertilizer subsidy interventions (n=39) to mitigate the impact of the fertilizer crisis (Figure 4). Direct support included provision of affordable fertilizer, credit support for input purchase, financing, capacity building, supply chain interventions, and research investments. These efforts aimed to cushion farmers against rising input costs and ensure stable agricultural productivity.
In Kenya, the government subsidized 40% of fertilizer prices to counter price hikes (AfricaFertilizer, 2024c). In Ghana, subsidies fell from 43–49% in 2020 to 11–18% in 2022, and the government contribution was reduced from USD 11–14 per 50 kg bag to USD 5–9 (Table A5 in the Appendix). In Morocco, despite preferential pricing, fertilizer prices more than doubled during the fertilizer crisis (Figure 3).
Beyond government action, International Non-Governmental Organizations (INGOs) provided fertilizers on credit, while the private sector engaged in promotional activities to boost sales (Figure 4). Cross-sector collaborations played a key role in addressing supply chain disruptions. Initiatives such as the Sustain Africa Initiative, backed by INGOs and private sector partners, and OCP-Africa’s Fertilizer Relief Program, helped stabilize fertilizer supply and affordability (OCP, 2022; SustainAfrica, 2024). These interventions underscored the importance of coordinated responses in mitigating the impact of the fertilizer crisis.
Response strategies provided by macro-level actors in Kenya, Ghana and Morocco in response to the fertilizer crisis.
Citation: International Food and Agribusiness Management Review 2026; 10.22434/ifamr.1370
Farmers’ investment decisions
Surveyed households were grouped into five clusters based on the severity of the fertilizer crisis impact and their adaptive strategies (Table 4). Clusters 1 and 2 were the most affected, with more than 80% of households reporting reduced affordability, availability, accessibility, and fertilizer use. Cluster 1 was dominated by Ghanaian households (69%) and had low fertilizer use (39%) with minimal manure application (24%). These households had limited financial access and made limited investments in agricultural inputs. In contrast, Cluster 2 consisted mostly of Kenyan households (75%), with 100% fertilizer use and higher manure application (58%). These households maintained better access to credit and diversified input use.
Cluster composition and cluster level differences in effects of the fertilizer crisis on affordability, availability, accessibility, and use of fertilizers, and on investment decisions made by surveyed households in Kenya, Ghana and Morocco.
Citation: International Food and Agribusiness Management Review 2026; 10.22434/ifamr.1370
Cluster 3 was moderately affected, with about 50% of households reporting reduced affordability and availability of fertilizer, but only 6% and 5% experiencing decline in access and use, respectively (Table 4). A high proportion of households in this group used fertilizer, manure, improved seeds and pesticides. They also had better credit access and faced minimal financial constraints. This cluster comprised 50% of households in Kenya, 29% in Ghana, and 16% in Morocco and demonstrated greater adaptability due to diversified input use and financial stability.
Cluster 4, which included 6% of surveyed households, was the least affected by the fertilizer crisis due to lack of prior fertilizer use. The households were food insecure due to chronic financial constraints (Table 4). The majority (71%) of these households were from Ghana. Most households in this cluster (93%) did not use fertilizers, faced low input investments, and had no financial support or credit access. They relied heavily on farm income and lacked the means to adopt strategies to counter the fertilizer crisis, making them one of the most vulnerable groups despite their limited direct exposure to the same.
Cluster 5 was the largest group, comprising 35% of surveyed households, mainly from Morocco (65%), followed by 26% from Ghana and 9% from Kenya (Table 4). These households experienced reduced affordability and fertilizer use but did not face major issues with access or availability. Fertilizer use remained high, while reliance on manure was limited. This cluster had the highest access to credit and financial support, making it more resilient compared to the others.
Effect of farmers’ responses to the fertilizer crisis on crop productivity
To evaluate the likely impact of households’ responses to the fertilizer crisis on crop productivity, strategies were categorized into three groups (Figure 5). Category one included highly detrimental responses, such as insufficient fertilizer use and reduced cropping areas. Category two comprised moderately detrimental strategies, including switching to lower-nutrient-demanding crops. Category three involved the least detrimental responses, including financial coping strategies to maintain fertilizer investment, such as using savings to buy fertilizers.
Coping strategies adopted by surveyed households to mitigate the impact of the fertilizer crisis, and their potential effect on crop productivity.
Citation: International Food and Agribusiness Management Review 2026; 10.22434/ifamr.1370
Most households adopted the least detrimental strategies, with fewer resorting to highly detrimental ones (Figure 5). Using savings to purchase fertilizer was the most common approach across all countries. Kenyan households employed a broader range of these strategies compared to those in Morocco and Ghana. In Morocco, surveyed households mainly relied on savings and loans, while Ghanaian households bought fertilizers in smaller quantities, traveled further to purchase them, and used their savings (Figure 5).
Moderately detrimental strategies, such as reducing fertilizer application per crop or field, were widely used. Kenyan households also increased organic fertilizer use, which was not common in Ghana and absent in Morocco. About 38% of Ghanaian households switched to lower-nutrient-demand crops, compared to fewer than 15% in Kenya and 5% in Morocco. Highly detrimental strategies, including not applying fertilizer and reducing cultivated land, were most common in Ghana, followed by Morocco.
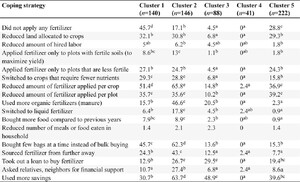
Coping strategies for different farmer typologies
The coping strategies by cluster reflected varying country-level trends (Table 5). In Cluster 4 dominated by Ghanaian households, only 2.5% adopted coping strategies, while less than 40% in Clusters 3 and 5 did so. In Cluster 5, 39% reduced fertilizer use and relied more on savings, whereas in Cluster 3, dominated by Kenyan households, nearly 50% used savings (Table 5). In Cluster 1, 51% of the households reduced fertilizer application. Cluster 2 had fewer respondents using highly detrimental strategies; instead, most households reduced fertilizer use per crop (66%) and applied organic manure (50%). Among the least detrimental strategies, 62% bought smaller fertilizer quantities instead of bulk purchases, and 64% relied more on savings.
Coping strategies deployed by different typologies of surveyed households to mitigate the effects of the fertilizer crisis.
Citation: International Food and Agribusiness Management Review 2026; 10.22434/ifamr.1370
6. Discussion
6.1 Fertilizer crisis impact on fertilizer prices
The fertilizer crisis drove significant price increases across the three study countries, with national policies shaping price variations. Lower retail prices of urea in Ghana and Morocco before the fertilizer crisis were linked to Ghana’s fertilizer subsidy program (MoFA, 2017), and the preferential fertilizer pricing policies in Morocco (Amachraa, 2023). In Kenya, where there were no government interventions during this period, urea retail prices were 36 and 45% higher than in Ghana and Morocco, underscoring the significance of policies on fertilizer prices. This reflects the broader situation across Africa, where large-scale fertilizer input support programs are central to many African governments’ agricultural development (Jayne et al., 2018; Jayne and Rashid, 2013). Despite price support policies, farmers were not fully protected from fertilizer price hikes during the crisis. Morocco maintained the lowest and most stable urea prices due to strong government policies and a robust local fertilizer industry with high P fertilizer production capacity. However, this annual pricing policy delayed the post-crisis benefits of decreasing urea prices to farmers.
Urea retail price trends across six African countries showed that Nigeria, with local production, had the lowest prices during the fertilizer crisis in the absence of government intervention (Figure A7 in the Appendix). However, rapidly escalating urea retail prices in Nigeria during the fertilizer crisis suggested that retail prices were significantly affected by rising international prices, likely due to supply pressures from higher exports to address international market gaps caused by the fertilizer crisis. Indeed, Nigeria’s urea exports surged by 86%, while domestic consumption dropped by 26% from 2021 to 2022 (AfricaFertilizer, 2024b), highlighting the impact of global market shifts on local fertilizer prices. While domestic production provides insulation against external shocks, market dynamics and international demand fluctuations can still significantly influence national fertilizer affordability.
Fertilizer price increases documented in this study were directly linked to rising international prices during the fertilizer crisis. Before the Russia-Ukraine conflict, nitrogen fertilizer prices surged due to soaring natural gas costs in mid-2021, particularly in Europe (Jones and Nti, 2022). The increases in DAP prices during this period were likely moderated by a smaller rise in P prices. The synchronized price trends of urea and DAP before the conflict underscore the fertilizer market’s interconnection and sensitivity to supply chain disruptions. After the conflict began, DAP prices from Russia stagnated, while those from other sources spiked due to sanctions imposed on Russia and the enhanced demand in other source markets (Hebebrand and Glauber, 2023; Mahlstein et al., 2022). These trends highlight the high vulnerability of fertilizer prices and access under the current global market structure.
6.2 Fertilizer crisis reduced affordability, availability and use of fertilizers
The fertilizer crisis reduced affordability across all three study countries, with its impact closely tied to fertilizer use. In Kenya and Ghana, households in high-use regions were affected more severely, while government price controls in Morocco buffered the impact (Figure 3). Availability and accessibility challenges were most severe in Ghana and least in Morocco. Ghana’s reliance on subsidies and a government-dominated distribution system (AfricaFertilizer, 2024c; Odionye et al., 2020) led to supply shortages in, 2021 due to delayed subsidy payments (AfricaFertilizer, 2024c). Rising fertilizer prices and a 55% currency depreciation in 2022 (Bank, 2023) further limited the ability of the Ghanaian government to import fertilizers. In contrast, Morocco’s strong local fertilizer industry ensured greater stability in supply. In Kenya, despite high reliance on imports, a relatively liberalized sector (Freeman and Kaguongo, 2003) mitigated disruptions, but delays in supply and reduced access persisted. These findings highlight the importance of resilient and well-structured fertilizer markets in mitigating shocks, especially in import-dependent countries.
6.3 Macro-level responses focused on affordability and availability
Macro-level responses included subsidies in Kenya and Ghana and preferential pricing in Morocco. Kenya’s subsidy program was a direct response to the fertilizer crisis, while Ghana’s and Morocco’s were pre-existing and ongoing support measures (Amachraa, 2023; MoFA, 2017). Subsidies have significantly increased fertilizer use among smallholder farmers in Africa (Sheahan and Barrett, 2017), improving food security (Khonje et al., 2022; Walls et al., 2018), and rural livelihoods (Arndt et al., 2016). However, they are costly (Jayne and Rashid, 2013) and created fiscal pressures during the fertilizer crisis. For instance, Ghana’s fertilizer use fell by 60% in, 2021 due to subsidy funding shortfalls (AfricaFertilizer, 2024c). There is therefore a need for ‘smarter’ subsidy programs to enhance effectiveness, efficiency, resilience, and sustainability (Karata, 2024). Interventions to improve the efficiency, resilience, and sustainability of subsidy programs include: (i) support private sector involvement in fertilizer distribution, (ii) target regions and farmers with low, but potentially profitable fertilizer use, (iii) integrate subsidies into broader agricultural development strategies, and (iv) establish clear exit mechanisms to prevent long-term dependency (Mather and Jayne, 2018; Morris et al., 2007). Additionally, monitoring and evaluation frameworks are crucial to ensure subsidies reach intended beneficiaries and adapt to changing market conditions.
To address the challenges of past subsidy programs, Ghana has restructured its subsidy program (PFJ 2.0) into a zero-interest Input Credit System (ICS). This model shifts from direct subsidies to private-sector-led input supply, aiming to strengthen market systems, enhance production efficiency, and strengthen value chain integration (MoFA, 2023). If effectively implemented, this could serve as a model for other African nations seeking to balance affordability, accessibility, and fiscal sustainability in fertilizer policies.
6.4 Fertilizer crisis influenced farmer’s investment decisions
Farmers’ responses to the fertilizer crisis varied due to market conditions, policies, and household characteristics. Manure use was more common in Kenyan-dominated clusters, due to the higher manure availability in the East Africa region (Rurinda et al., 2020), indicating that options for alternative nutrient sources are context-specific. Households previously using fertilizers were more likely to continue the input during the crisis period, but at reduced quantities (Table 3). Wealthier households diversified their investments into fertilizers and improved seeds, leveraging financial support to sustain productivity. In contrast, poorer households, despite being the most food insecure, made no investments, highlighting their vulnerability to input price shocks. The clear disparities in responses suggest that blanket policies may be ineffective, and targeted interventions tailored to specific farmer needs, financial capacities, and regional agricultural systems are essential for greater resilience.
6.5 Effects of farmer coping strategies on crop productivity
Although our study did not directly measure the impact of coping strategies on crop productivity, inferences can be drawn from established relationships between nutrient use and crop productivity. Strategies expected to have moderate effects on crop productivity decline included reducing the amount of fertilizer used and applying fertilizer to less fertile plots. Crop area reduction and stopping fertilizer application were among coping strategies expected to have strong effects on reduced crop production and productivity. We therefore expect that the fertilizer crisis resulted in substantial decline in crop productivity, particularly in Ghana, where fertilizer use declined the most. Trends where reduced fertilizer application led to lower cereal production during the fertilizer crisis were documented in Ethiopia, Malawi and India (Snapp et al., 2023).
6.6 Insights for managing future shocks and building long-term resilience
Fertilizer supply chain disruptions increased fertilizer prices and reduced availability, leading to reduced fertilizer use. This is expected to have resulted in decreased crop yields and higher food prices (Alexander et al., 2023), worsening food security (Hebebrand and Laborde Debucquet, 2023). The fertilizer crisis disproportionately affected African farmers due to the vulnerability of low-income and fertilizer-import-dependent countries (Vos et al., 2025). Africa’s reliance on imports makes it highly vulnerable to supply chain shocks (Mingolla and Rosa, 2025), worsened by limited influence in the global market, where suppliers prioritize bulk orders (Agricultures, 2008; IFASTAT, 2024).
To mitigate the effects of future crises, there is a need for a multi-faceted approach with relevant interventions at the global, regional/continental, and country levels. Global interventions should be geared towards policies aimed at increasing the availability and affordability of fertilizers, alongside promoting efficient use of natural resources. The establishment of global early warning systems for the early identification and mitigation of fertilizer crises is also imperative. In addition, there is a need to accelerate innovations in fertilizer production, such as green ammonia, which offer opportunities for decentralizing fertilizer production. This will reduce the reliance on fossil fuels for fertilizer N production (Vos et al., 2025), while further diversifying the pool and distribution of fertilizer producing and exporting countries (Vos et al., 2025). Further, decentralization of fertilizer production has the potential to reduce transport costs (Mingolla and Rosa, 2025).
At the regional level, interventions should focus on increasing local fertilizer production, harmonizing policies, and removing trade barriers. Given the high costs of establishing fertilizer manufacturing plants (WEF, 2023), public-private partnerships are key to unlocking private sector and international development investment. For instance, the recently launched private-owned Dangote Industries’ fertilizer plant, with an annual production capacity of 3 million tons of urea, has significantly boosted Nigeria’s production capacity (Dangote, 2025). Eliminating tariff and non-tariff barriers across Africa, as envisioned through the African Continental Free Trade Area (African Union, 2020), is however essential to maximize the value of investments in fertilizer production. For example, high freight costs and road transport bottlenecks in West Africa, along with higher profits from export markets outside Africa, hinder the distribution of Nigerian urea to neighboring countries (AfricaFertilizer, 2024a). Additionally, improving regional infrastructure, such as transportation and storage facilities, will enhance the efficiency of fertilizer distribution and ensure more consistent access to affordable fertilizers across the continent.
At the country level, interventions should focus on strengthening local fertilizer industries, reducing handling and distribution costs, and aligning policies with regional and continental strategies. The transition from price-based fertilizer subsidies to ‘smart’ subsidies with clear exit plans (Byerlee et al., 2007; Jayne and Rashid, 2013; Mather and Jayne, 2018) is crucial for long-term sustainability. Other strategies for supporting farmers must ensure timely access to fertilizers, improved access to output markets and profitable commodity prices, and capacity building for farmers on best practices for crop and fertilizer use to enhance fertilizer efficiency. The recently adopted Africa Fertilizer and Soil Health Action Plan of, 2024 offers a solid foundation for implementing farmer-supportive strategies at both the continental and country levels. The Action Plan includes targets to (i) enhance access and affordability of fertilizers to smallholder farmers through tripling of production and distribution of organic and inorganic fertilizers by, 2034; (ii) avail targeted agronomic recommendations that enhance fertilizer use efficiency; and (iii) support Member States with natural gas deposits to produce urea. Any mitigation measures designed should, however, recognize the diversity in fertilizer markets and agricultural systems at the household, regional, and country levels.
7. Conclusions
Similar to continental trends, the fertilizer crisis adversely affected the cost, availability, accessibility, and use of fertilizers in Kenya, Ghana and Morocco. However, the effects were variable between and within countries, and for various categories of farmers. At the macro-level, Morocco, which has a well-established fertilizer industry, was less exposed to fertilizer accessibility and availability challenges, although price increases were ubiquitous across the three study countries. The national government fertilizer interventions strongly influenced fertilizer retail prices during the crisis. Strategies designed to enhance the affordability of fertilizers before and during the fertilizer crisis did not fully cushion farmers. At the micro-level, household socioeconomic characteristics and past fertilizer use patterns influenced the coping strategies adopted by different households in response to the crises. These findings from three agriculturally important countries from North, East and West Africa provide key insights that represent the situation in many other countries in Africa. There is a need for targeted interventions that reflect farmers’ socioeconomic conditions and farming practices to better manage the effects of similar crises. Additionally, trade policies, promotion of local fertilizer production, a robust last-mile input-output infrastructure, and improved access to knowledge for farmers are essential investments to build resilience against future global fertilizer market shocks.
Acknowledgements
We are grateful to the various teams in Kenya, Ghana, and Morocco that assisted in collection of primary data. We are also grateful to staff of the AfricaFertilizer for facilitating access to, and providing clarifications for part of the secondary data used in this study.
Author contributions
Conceptualization: Majumdar and Zingore. Data curation: Njoroge, Mugi-Ngenga and Pali. Formal analysis: Pali and Njoroge. Methodology: Njoroge, Mugi-Ngenga, Chivenge, Boulal, Zingore and Majumdar. Writing original draft: All.
Conflict of interest
All authors declare that they have no conflict of interest.
Funding
This research did not receive any specific grant from funding agencies in the public, commercial, or not-for-profit sectors.
References
Abail, Z., O.I. Halima, H. Boulal and M. El Gharous. 2014. Fertilizer use patterns in the semi-arid, cereal producing region of Chaouia. Better Crops 98 (4): 29–31.
AfricaFertilizer. 2024a. 2024 Register of Fertilizer Manufacturing and Processing Facilities in Sub-Saharan Africa.-->
AfricaFertilizer. 2024b. Fertilizer Statistics Overview Nigeria 2019–2023. IFDC. Available online at www.africafertilizer.org.
AfricaFertilizer. 2024c. Website. Available online at https://africafertilizer.org.
African Union. 2020. African continental free trade area. African Union, Addis Ababa.
African Union. 2024a. Nairobi declaration. Africa Fertilizer and Soil Health and Summit, Nairobi, Kenya, May 7–9, 2024. Available online at https://au.int/en/documents/20240509/nairobi-declaration-2024-africa-fertilizer-and-soil-health-summit.
African Union. 2024b. Africa Fertilizer and Soil Health Summit, Nairobi, Kenya, May 7–9, 2024. https://au.int/en/newsevents/20240507/africa-fertilizer-and-soil-health-summit.
Agricultures, F. 2008. The global fertiliser crisis and Africa. Policy Brief 025.
Alexander, P., A. Arneth, R. Henry, J. Maire, S. Rabin and M.D. Rounsevell. 2023. High energy and fertilizer prices are more damaging than food export curtailment from Ukraine and Russia for food prices, health and the environment. Nature Food 4 (1): 84–95.
Amachraa, A. 2023. Navigating Morocco’s agricultural policy: unraveling the nexus of water, food security, and trade tensions in global value chains. Preprints.org. https://doi.org/10.20944/preprints202307.0604.v1.
Amankwah, A., A. Ambel, S. Gourlay, T. Kilic, Y. Markhof and P. Wollburg. 2024. Fertilizer Price Shocks in Smallholder Agriculture. World Bank, Washington, DC.
Ariga, J. and P. Hefferman. 2012. Ghana fertilizer assessment. IFDC, Muscle Shoals, AL.
Arndt, C., K. Pauw and J. Thurlow. 2016. The economy‐wide impacts and risks of Malawi’s farm input subsidy program. American Journal of Agricultural Economics 98 (3): 962–980.
Bank, W. 2023. Seventh Ghana economic update: price surge — unraveling inflation’s toll on poverty and food security. World Bank, Washington, DC.
Belhadi, A., S. Kamble, N. Subramanian, R.K. Singh and M. Venkatesh. 2024. Digital capabilities to manage agri-food supply chain uncertainties and build supply chain resilience during compounding geopolitical disruptions. International Journal of Operations & Production Management 44 (11): 1914–1950.
Ben Hassen, T. and H. El Bilali. 2022. Impacts of the Russia-Ukraine war on global food security: towards more sustainable and resilient food systems? Foods 11 (15): 2301.
Benson, T. and T. Mogues. 2018. Constraints in the fertilizer supply chain: evidence for fertilizer policy development from three African countries. Food Security 10 (6): 1479–1500.
Byerlee, D. R., V. A. Kelly, R. J. Kopicki and M. Morris. 2007. Fertilizer use in african agriculture.directions in development — agriculture and rural development: World Bank, Washington, DC.
Chambers, R. and G. Conway. 1992. Sustainable rural livelihoods: practical concepts for the 21st century. Institute of Development Studies, Brighton.
Chianu, J.N. and F. Mairura. 2012. Mineral fertilizers in the farming systems of sub-Saharan Africa. A review. Agronomy for Sustainable Development 32 (2): 545–566. https://doi.org/10.1007/s13593-011-0050-0.
Dangote. 2025. Website. Available online at https://dangote.com/dangote-fertiliser-plant/.
Deconinck, K., B. Henderson, D. Gregg and D. Hill. 2023. Towards resilient food systems: Implications of supply chain disruptions and policy responses. OECD Food, Agriculture and Fisheries Papers, 205, OECD, Paris. Available online at https://doi.org/10.1787/f7998e46-en.
Dobermann, A. 2007. Nutrient use efficiency–measurement and management. In Fertilizers Best Management Practices: General principles, Strategy for their Adoption and Voluntary Initiatives vs Regulations., Brussels, Belgium, 7–9 March 2007.
Dorward, A. 2009. Rethinking agricultural input subsidy programmes in a changing world. In A. Elbehri and A. Sarris (Eds) Non-distorting farm support to enhance global food production, pp. 311–374. FAO, Rome.
El Ansari, L., Y.A. Yigezu, C. Gary and H. Belhouchette. 2016. Establishing farm typologies in dryland areas: the case of Saïs, Morocco. CIHEAM-IAMM, Montpellier.
FAO. 2023. World food and agriculture — statistical yearbook 2023. Fao, Rome. https://doi.org/10.4060/cc8166en.
FAOSTAT. 2023. Production: crops and livestock products. FAO, Rome.
Folke, C. 2016. Resilience. Ecology and Society 21 (4): 44.
Freeman, H.A. and W. Kaguongo. 2003. Fertilizer market liberalization and private retail trade in Kenya. Food Policy 28 (5–6): 505–518.
Gereffi, G. and K. Fernandez-Stark. 2011. Global value chain analysis: a primer. Center on Globalization, Governance & Competitiveness (CGGC), Duke University, Durham, NC.
Hebebrand, C. and J.W. Glauber. 2023. The Russia-Ukraine war after a year: Impacts on fertilizer production, prices and trade flows. In G. Joseph and D. Laborde Debucquet (Eds) The Russia-Ukraine conflict and global food security, pp. 43–47. IFPRI, Washington, DC.
Hebebrand, C. and D. Laborde Debucquet. 2023. High fertilizer prices contribute to rising global food security concerns. In G. Joseph and D. Laborde Debucquet (Eds) The Russia-Ukraine conflict and global food security, pp. 38–42. IFPRI, Washington, DC.
Hernandez, M.A., F. Paz, A.I. Adeoti, A. Adong, C.B. Jumbe, K.A. Lagat and S. Kaiyatsa. 2018. Overview of the fertilizer supply chain and market structure in Africa: A cross-country assessment. IFPRI, Washington, DC.
Ibendahl, G. 2022. The Russia-Ukraine conflict and the effect on fertilizer. Department of Agricultural Economics, Kansas State University, Manhattan, KS.
IFASTAT. 2024. Website. Available online at https://www.ifastat.org/.
Intelligence, G. 2016. The World’s most expensive fertilizer market: sub-Saharan Africa. Gro Intelligence, New York, NY.
Ivanov, D. and A. Dolgui. 2021. OR-methods for coping with the ripple effect in supply chains during COVID-19 pandemic: Managerial insights and research implications. International Journal of Production Economics 232: 107921.
Jayne, T. and S. Rashid. 2013. Input subsidy programs in sub‐Saharan Africa: a synthesis of recent evidence. Agricultural Economics 44 (6): 547–562.
Jayne, T., N. Mason, W. Burke and J. Ariga. 2018. Taking stock of Africa’s second-generation agricultural input subsidy programs. Food Policy 75: 1–14.
Jones, K. and F. Nti. 2022. Impacts and repercussions of price increases on the global fertilizer market. USDA Foreign Agricultural Service. Available online at https://www.fas.usda.gov.
Kai-Ineman, D. and A. Tversky. 1979. Prospect theory: An analysis of decision under risk. Econometrica 47 (2): 363–391.
Karata, R. 2024. The impact of smart input subsidy program on farm productivity: Evidence from Tanzania. Scientific African 24: e02181.
Khonje, M.G., C. Nyondo, J.H. Mangisoni, J. Ricker-Gilbert, W.J. Burke, W. Chadza and M. Muyanga. 2022. Does subsidizing legume seeds improve farm productivity and nutrition in Malawi? Food Policy 113: 102308.
Laber, M., P. Klimek, M. Bruckner, L. Yang and S. Thurner. 2023. Shock propagation from the Russia–Ukraine conflict on international multilayer food production network determines global food availability. Nature Food 4 (6): 508–517.
Mahlstein, K., C. McDaniel, S. Schropp and M. Tsigas. 2022. Estimating the economic effects of sanctions on Russia: an allied trade embargo. The World Economy 45 (11): 3344–3383.
Mather, D. L. and T. S. Jayne. 2018. Fertilizer subsidies and the role of targeting in crowding out: evidence from Kenya. Food Security 10 (2): 397–417.
Mingolla, S. and L. Rosa. 2025. Low-carbon ammonia production is essential for resilient and sustainable agriculture. Nature Food 6: 610–621. https://doi.org/10.1038/s43016-025-01125-y.
MoFA. 2017. Planting for food and jobs: Strategic plan for implementation (2017–2020). Ministry of Food and Agriculture, Accra.
MoFA. 2023. Planting for food and jobs phase II (PFJ 2.0). a five-year master plan for the renewal of agriculture in Ghana (2024–2028). Ministry of Food and Agriculture, Accra. Available online at https://mofa.gov.gh.
Morris, M., V.A. Kelly, R.J. Kopicki and D. Byerlee. 2007. Fertilizer use in African agriculture: Lessons learned and good practice guidelines. World Bank, Washington, DC.
Mwatu, S. M. 2023. Impact of the Russia–Ukraine war on grain and fertilizer supply: evidence from Kenya. World Food Policy 9 (2): 250–274.
Nations, U. 2023. One year later: Impact of the Russian conflict in Ukraine on Africa. https://www.un.org/osaa/news/one-year-later-impact-russian-conflict-ukraine-africa.
North, D.C. 1990. Institutions, institutional change and economic performance. Cambridge University Press, Cambridge.
OCP. 2022. OCP group annual report. Available online at https://www.ocpgroup.ma
Odionye, N., D. Saa, A. Laamari, W. Adzawla, I. Koffi, E. Afimia, W. Atakora, M. Jemo and P. Bindraban. 2020. Determination of fertilizer cost components and their effect on fertilizer prices and the fertilizer value chain in Ghana. IFDC FERARI Research Report. Available online at https://ifdc.org
Parker, C., S. Scott and A. Geddes. 2019. Snowball sampling. Sage, Thousand Oaks, CA.
Reetz, H.F. 2016. Fertilizers and their efficient use. International Fertilizer industry Association, Paris.
Rojas-Reyes, J.J., L. Rivera-Cadavid and D.L. Peña-Orozco. 2024. Disruptions in the food supply chain: A literature review. Heliyon 10 (14): e34730. https://doi.org/10.1016/j.heliyon.2024.e34730
Rurinda, J., C. Costa Jr, E. Omollo, L. Motaroki and J. Osumba. 2020. Improved nutrient use and manure management in Africa. Policy Brief No. 7, December, 2020. Available online at https://idl-bnc-idrc.dspacedirect.org/server/api/core/bitstreams/1781ee30-a9f4-4f7c-b293-65e85625963b/content
Schnitkey, G., N. Paulson, C. Zulauf, K. Swanson, J. Colussi and J. Baltz. 2022. Nitrogen fertilizer prices and supply in light of the Ukraine-Russia conflict. farmdoc daily 12 (45).
Sheahan, M. and C.B. Barrett. 2017. Ten striking facts about agricultural input use in Sub-Saharan Africa. Food Policy 67: 12–25. https://doi.org/10.1016/j.foodpol.2016.09.010
Snapp, S., T.B. Sapkota, J. Chamberlin, C.M. Cox, S. Gameda, M.L. Jat, P. Marenya, K.A. Mottaleb, C. Negra and K. Senthilkumar. 2023. Spatially differentiated nitrogen supply is key in a global food–fertilizer price crisis. Nature Sustainability 6 (10): 1268–1278.
SustainAfrica. 2024. Website. Available online at https://sustainafrica-initiative.org/
Sutar, P.S., G.C. Kolte and S. Yamini. 2025. Food supply chain disruptions and its resilience: a framework and review for resilience strategies in the digital era. OPSEARCH. https://doi.org/10.1007/s12597-025-00915-z
Umar, M., M. Wilson and J. Heyl. 2017. Food network resilience against natural disasters: a conceptual framework. Sage Open 7 (3): 2158244017717570.
Vos, R., J. Glauber, C. Hebebrand and B. Rice. 2025. Global shocks to fertilizer markets: Impacts on prices, demand and farm profitability. Food Policy 133: 102790.
Walls, H.L., D. Johnston, M. Tak, J. Dixon, J. Hanefeld, E. Hull and R.D. Smith. 2018. The impact of agricultural input subsidies on food and nutrition security: a systematic review. Food Security 10: 1425–1436.
WEF. 2023. Net-zero industry tracker 2023. Available online at https://www.weforum.org/publications/net-zero-industry-tracker-2023/in-full/ammonia-industry-net-zero-tracker/
Willwerth, H.S., C.N. Khaemba, T. Serra, H.C. Michelson, P. Rutsaert and J. Donovan. 2025. Global shocks and local sellers: Kenyan fertilizer markets’ response to the fuel-fertilizer-food price crisis. Food Policy 133: 102889. https://doi.org/https://doi.org/10.1016/j.foodpol.2025.102889
Appendix
Main fertilizer import sources and quantities (‘000 MT’) in Ghana for the period 2020–2023
Citation: International Food and Agribusiness Management Review 2026; 10.22434/ifamr.1370
Main fertilizer import sources and quantities (‘000 MT’) in Kenya for the period 2020–2023
Citation: International Food and Agribusiness Management Review 2026; 10.22434/ifamr.1370
Estimated fertilizer application rate by crop in Kenya for the year 2021.
Citation: International Food and Agribusiness Management Review 2026; 10.22434/ifamr.1370
Estimates of fertilizer application rates in Morocco for the period 2018–2019.
Citation: International Food and Agribusiness Management Review 2026; 10.22434/ifamr.1370
Estimated market prices of fertilizers in Ghana for the period 2020–2022, and proportion of prices paid for by the government as subsidy and by farmers.
Citation: International Food and Agribusiness Management Review 2026; 10.22434/ifamr.1370
Absolute (A, C, E) and proportional (B, , F) cost components of landed urea prices in Ghana for urea imported from the Middle East (A, B), Nigeria (C, D) and Russia (E, F). Prices used are as of April of each year. Source: www.africafertilizer.org.
Citation: International Food and Agribusiness Management Review 2026; 10.22434/ifamr.1370
Absolute (A, C) and proportional (B, D) cost components of landed urea prices in Kenya for urea imported from the Russia (A, B), and the Middle East Nigeria (C, D). Prices used are as of April of each year. Source: www.africafertilizer.org.
Citation: International Food and Agribusiness Management Review 2026; 10.22434/ifamr.1370
Annual trends in (A) total apparent fertilizer consumption by product, and (B) average apparent fertilizer consumption by nutrient in Ghana for the period 2011–2023. Dashed horizontal line indicates the Nairobi 2024 nutrient application target. Source: www.africafertilizer.org.
Citation: International Food and Agribusiness Management Review 2026; 10.22434/ifamr.1370
Annual trends in (A) total apparent fertilizer consumption by product, and (B) average apparent fertilizer consumption by nutrient in Kenya for the period 2011–2023. Dashed horizontal line indicates the Nairobi 2024 nutrient application target. Source: www.africafertilizer.org.
Citation: International Food and Agribusiness Management Review 2026; 10.22434/ifamr.1370
Total apparent fertilizer consumption by nutrient in Morocco for the period 2011–2022. Source: www.ifastat.org.
Citation: International Food and Agribusiness Management Review 2026; 10.22434/ifamr.1370
Changes in international Free on Board (FOB) prices (solid lines) and Cost Insurance and Freight (CIF) prices in Kenya (dotted lines) for (A) Urea and (B) DAP fertilizers from different source markets. Source: www.africafertilizer.org.
Citation: International Food and Agribusiness Management Review 2026; 10.22434/ifamr.1370
Change in retail prices of urea in selected countries in Africa. Broken trend lines indicate missing data. Sources: www.africafertilizer.org and SONACOS
Citation: International Food and Agribusiness Management Review 2026; 10.22434/ifamr.1370
Corresponding author


