Abstract
This study evaluates whether government-led smart farming initiatives can serve as an effective market stabilization strategy for agricultural businesses, examining South Korea’s comprehensive 2014 smart farming policy that invested in controlled-environment agriculture. We employ a novel dual-method framework combining ARIMA-TGARCH models with machine learning-enhanced propensity score matching (ML-PSM) to analyze weekly price data (2005–2024) for three high-value greenhouse crops: strawberries, cucumbers, and lettuce. This approach captures both structural breaks in volatility patterns and heterogeneous treatment effects across different subsidy intensities, seasons, and crops. Smart farming subsidies reduced price volatility by up to 28.7% for strawberries and 18.0% for cucumbers, while lettuce showed minimal response. For agribusiness managers, findings indicate that concentrated investments in responsive crops yield superior returns compared to diversification strategies. The identified optimal investment thresholds and seasonal patterns provide concrete guidance for market entry timing, facility sizing, and capital allocation decisions. For policymakers, crop-specific support programs would enhance efficiency by 40–50% compared to uniform subsidies. This research provides the first rigorous evidence of smart farming’s heterogeneous effects on agricultural market stability, offering a replicable framework for policy evaluation. The integration of machine learning with traditional econometrics reveals hidden patterns critical for strategic decision-making, while the findings challenge conventional approaches to agricultural risk management and technology adoption.
1. Introduction
Global agricultural markets face unprecedented challenges in the 21st century, with food price volatility emerging as a critical threat to both food security and agribusiness sustainability worldwide. The Food and Agriculture Organization (FAO) reports that extreme price fluctuations have increased by over 60% since 2000, affecting billions of consumers and millions of agricultural producers across developed and developing economies alike (FAO, 2019). This volatility not only undermines farm income predictability but also disrupts entire agribusiness value chains, from input suppliers to food retailers, creating cascading effects throughout the global food system.
For agribusiness managers and policymakers, managing price volatility has become a strategic imperative rather than a tactical concern. Traditional approaches — including price controls, trade restrictions, and reactive subsidies — have proven costly and often counterproductive, distorting market signals and creating unintended consequences for agricultural competitiveness (De Gorter and Just, 2010; Sumner et al., 2010). Agricultural markets around the world are increasingly vulnerable to seasonal variability, climate-induced shocks, and growing resource constraints, all of which threaten both productivity and long-term food security. Heatwaves, typhoons, and excessive rainfall frequently disrupt crop yields and supply chains; meanwhile, soil degradation, water scarcity, and environmental pollution continue to exacerbate these instabilities. Climate change is projected to intensify the frequency and severity of these shocks, underscoring the need for agricultural systems that are both resilient and adaptable.
Smart farming, which integrates Internet-of-Things (IoT) technologies, AI-based monitoring, and climate-controlled facilities, has emerged as a promising business innovation for addressing these challenges. From a management perspective, smart farming represents a fundamental shift in agricultural production models — from reactive, weather-dependent operations to proactive, data-driven enterprises. By enabling real-time crop management and environmental control, smart farms enhance input efficiency and crop protection. Controlled-environment agriculture (CEA) in particular offers year-round production and reduces exposure to open-field climate risks. Empirical studies have linked these systems to reduced post-harvest loss and improved resource efficiency, with potential returns on investment ranging from 15 to 40% annually depending on crop type and market conditions (Van Gerrewey et al., 2021).
Beyond their agronomic and environmental benefits, smart farming systems have been increasingly discussed in relation to their potential to stabilise food prices, particularly for perishable, high-value crops. Price volatility remains a key issue in fresh produce markets, driven by seasonal supply imbalances and unexpected weather-related yield shocks. For agribusiness firms, price stability translates directly into improved planning capabilities, reduced hedging costs, and enhanced profitability. Similarly, stable prices benefit the entire value chain by reducing transaction costs, improving contract feasibility, and enabling long-term strategic planning. Yet, despite the theoretical potential of CEA systems to buffer supply volatility, there is limited empirical research assessing whether smart-farming policies have actually delivered price stability under real-world market and climate conditions — especially outside the Global North (Richter et al., 2023).
South Korea presents a unique natural experiment for such evaluation with direct relevance to agricultural economies worldwide, particularly in Asia where over 60% of global agricultural production occurs (FAO, 2023). In 2014, the Korean government launched a nationwide smart farming expanding policy, aimed at revitalising its aging agricultural sector and improving production efficiency through subsidies and technological support. This policy intervention offers valuable lessons for agribusiness managers and policymakers globally, as it represents one of the most comprehensive government-led smart farming initiatives to date, with cumulative investments exceeding $500 million over a decade (MAFRA, 2023). This large-scale intervention rapidly expanded the number of CEA-based farms producing strawberries, cucumbers, and lettuce — three of the country’s highest-value greenhouse crops. These crops were specifically selected as they represent distinct production characteristics: strawberries with pronounced seasonal patterns, cucumbers with year-round production capabilities, and lettuce with rapid turnover cycles and strong demand-side influences. However, whether this smart-farm scale-up measurably stabilised market prices, particularly in the face of climate and demand shocks, remains an open empirical question with significant implications for global agribusiness strategy and agricultural policy design.
This study addresses that gap by investigating whether the 2014 policy-driven expansion of smart farming in South Korea reduced price volatility in the fresh produce sector. Our findings have direct managerial relevance for three key stakeholder groups: (1) agribusiness firms considering investments in controlled-environment agriculture, (2) policymakers designing agricultural modernization programs, and (3) agricultural investors evaluating the risk-return profiles of technology-intensive farming operations. We apply a mixed-methods approach combining time-series econometric models (ARIMA, ARMA-TGARCH) with machine learning-enhanced propensity score matching (ML-PSM). This dual approach allows us to capture both structural changes in volatility patterns and heterogeneous treatment effects across different subsidy intensities and seasonal conditions.
A critical innovation of our methodology lies in the integration of ensemble machine learning techniques for propensity score estimation, which significantly improves upon traditional logistic regression approaches by capturing complex, non-linear treatment assignment mechanisms. From a business analytics perspective, this methodological advancement demonstrates how modern data science techniques can enhance policy evaluation and strategic decision-making in agribusiness. The ML-PSM framework enables us to examine dose-response relationships between subsidy intensity and volatility reduction, revealing optimal policy thresholds and diminishing returns patterns that remain invisible to conventional time-series analysis. These insights are crucial for managers and policymakers seeking to optimize resource allocation and maximize return on agricultural technology investments. Furthermore, our cohort-based matching strategy for seasonal crops ensures robust causal identification by comparing farms operating under similar production conditions.
This research contributes to four strands of agribusiness management and food and agricultural economics literature. First, it tests whether smart farming leads to measurable price stabilisation when climate variability is taken into account, providing empirical evidence for business case development. Second, it extends prior time-series studies by incorporating crop-specific volatility diagnostics using weekly price data over a 20-year horizon, offering unprecedented granularity for market analysis and strategic planning. Third, it empirically evaluates how a government-led smart-farm expansion policy altered volatility patterns for key crops while accounting for heterogeneous effects across different treatment intensities and seasonal production cycles, generating insights for optimal timing and scaling of agribusiness investments. Fourth, by applying machine learning-enhanced causal inference methods to agricultural policy evaluation, the study demonstrates cutting-edge analytical approaches that agribusiness firms can adopt for their own strategic assessments and offers a novel lens for evaluating food policy outcomes in climate-sensitive sectors.
2. Literature review
2.1 The necessity of smart farming for market stability
Smart farming, often framed as a technological advancement in precision agriculture, has increasingly been recognized as a strategic tool for ensuring food market stability. As global populations grow and climate risks intensify, agricultural systems are under pressure not only to boost productivity but also to minimize volatility in food supply and pricing. This need for stability — particularly in the fresh produce sector where seasonal variability and perishability are pronounced — has placed smart farming at the center of agricultural policy discourse.
While early studies focused on agronomic efficiency and sustainability gains such as improved input use, yield maximization, and environmental protection (Gebbers and Adamchuk, 2010; Mariyono et al., 2018), recent literature has begun to explore how smart farming may also contribute to stabilizing food prices by insulating production from external shocks. Controlled-environment agriculture (CEA), for instance, allows for year-round cultivation independent of climatic disruptions, which reduces seasonal supply gaps and mitigates the risk of sudden price spikes (Karanisa et al., 2022; Sridhar et al., 2023).
In addition to its climate-buffering effects, smart farming is increasingly seen as a policy instrument for stabilizing agricultural markets. Government support for smart farms — through subsidies, infrastructure investment, and training programs — can enhance production consistency, smooth supply chains, and reduce market fluctuations caused by yield uncertainty. Recent policy literature has argued that stabilising agricultural prices through strategic interventions — such as technology subsidies — can benefit both producers and consumers by ensuring market predictability and reducing the risks of sharp price swings (Sumner et al., 2010).
Despite this emerging recognition, most studies have emphasized the technical or environmental rationale for smart farming adoption, without rigorously examining its policy-driven economic impacts on food price volatility. While the economic potential of smart farming has been documented (Sonka, 2014), there remains a critical gap in understanding how policy-supported adoption translates into measurable market stabilization, particularly under the stress of compound shocks. This study responds to that gap by focusing on South Korea’s national smart farm initiative and its effects on volatility in key high-value crops — strawberries, cucumbers, and lettuce.
2.2 Agricultural price volatility under compound shocks
Agricultural price volatility remains a persistent challenge across global food systems, often driven by a combination of external shocks and internal market dynamics. Extreme weather events such as heatwaves, typhoons, floods, and snowstorms, along with non-climatic disruptions such as fine dust pollution and global pandemics, frequently destabilize production cycles, particularly in open-field agriculture. These shocks lead to unpredictable yields, abrupt supply shortages, and subsequent price spikes (Chavas and Holt, 1993; FAO, 2019; Swinnen and McDermott, 2020; Tripathi et al., 2023).
Market-based factors — such as seasonal demand surges (e.g., holiday consumption) and supply gluts from bumper harvests — also exacerbate price fluctuations(Scherer and Verburg, 2017). These internal imbalances, even in the absence of external events, can cause sudden and significant deviations in produce prices (Ben Kaabia et al., 2015; Kayikci et al., 2022; Singh et al., 2019). Studies such as Ferrer-Perez and Gracia-de-Renteria (2020) show that favorable growing conditions can lead to oversupply, which then triggers rapid price drops and heightened return volatility in perishable crop markets.
Combined, these compound shocks — climatic, environmental, and market-driven — create a structurally unstable environment for agricultural pricing. This volatility not only undermines farm income predictability but also reduces affordability and planning capacity across food supply chains, making it a pressing concern for policymakers(Luo and Liu, 2011). While price swings are inherent to agriculture due to biological and seasonal rhythms, their amplification under compound stressors justifies strategic policy interventions aimed at buffering both producers and consumers(Rezitis and Pachis, 2020; Shukla et al., 2023).
Time-series models such as ARCH and GARCH have long been applied to measure volatility patterns and evaluate shock responses in agricultural markets (Lai, 2016; Bollerslev, 1986). Some studies have incorporated policy or weather-related dummy variables into ARMA-GARCH frameworks to simulate the effects of shocks, subsidies, or trade disruptions (Apergis and Rezitis, 2011; Sanyal et al., 2015; Capitanio et al., 2020). However, the majority of this research has centered on the volatility-inducing effects of shocks themselves, with far fewer studies examining whether and how government-led policies can successfully mitigate such volatility, particularly for fresh produce.
Controlled-environment agriculture (CEA), when supported by policy, offers one such mitigation pathway. By decoupling production from climate volatility and enabling year-round output, smart farming technologies can reduce supply irregularities and buffer against both seasonal gaps and extreme weather losses. While early studies noted CEA’s ability to improve yields and reduce input waste (Azadi et al., 2021; Mariyono et al., 2018), fewer have empirically quantified its contribution to price stability under real-world market turbulence.
This study contributes to filling that gap by using high-frequency weekly data (2005–2024) to evaluate the role of South Korea’s smart farm policy in stabilising crop prices across three major facility-grown products. By controlling for both environmental shocks and demand-side volatility, the analysis tests whether policy-supported CEA adoption has functioned as a stabiliser within structurally volatile food markets.
2.3 Policy implementation and market stability
South Korea’s 2014 smart-farm promotion policy offers a rare, large-scale example of technology-driven agricultural reform implemented through direct government intervention. The initiative was launched to counteract persistent volatility in agricultural markets caused by external shocks (e.g., extreme weather, fine dust, pandemics) and internal disruptions (e.g., demand surges, supply gluts)(Arslan and Aybek, 2012; Alabi and Ngwenyama, 2023; De Gorter and Just, 2010; Dinesh et al., 2024). By expanding controlled-environment agriculture (CEA) through targeted subsidies and infrastructure support, the policy aimed to enhance both production capacity and market stability — particularly for high-value, greenhouse-grown crops such as strawberries, cucumbers, and lettuce (Mohapatra et al., 2010).
From 2015 onward, the number of smart farms increased significantly, supported by public investment, youth entrepreneurship programs, and rural revitalization strategies. This rapid diffusion of CEA technologies created a quasi-experimental setting in which the effects of policy intervention on price volatility could be empirically assessed.
Existing literature on agricultural policy effects has largely focused on traditional interventions such as trade regulations, fertilizer subsidies, or post-disaster recovery efforts (Cao et al., 2023; Jati and Premaratne, 2017; Ringim et al., 2022; Sanyal et al., 2015). While these studies offer valuable insights into specific instruments, such as subsidies or trade interventions, they tend to focus on yield outcomes or cost-efficiency measures, rather than market-level dynamics. Few have assessed how policy-led expansion of smart farming — particularly in the form of infrastructure support and subsidy programs — affects long-term price volatility under compound shocks (Liu et al., 2018).
This study addresses that gap by explicitly modeling the effects of South Korea’s smart-farm policy on agricultural price volatility. We incorporate policy dummy variables into ARIMA, GARCH, and T-GARCH models to detect structural breaks and shifts in conditional variance before and after the intervention(Enders, 2008). The econometric analysis is further enhanced by machine learning methods which allow us to quantify the relative influence of policy subsidies, environmental shocks, and market forces on price dynamics.
By combining these methods, the study isolates the volatility-reducing effects of policy-supported smart farming and provides an empirical foundation for tailoring future interventions (Mitra and Paul, 2017; Saint-Cyr, 2022; Salter and Martin, 2001). Our findings contribute to the broader policy literature by demonstrating that controlled-environment technologies, when deployed at scale through coordinated public investment, can deliver measurable improvements in market stability.
2.4 Evaluating policy effects using time series and machine learning-based propensity score matching
Assessing the effectiveness of South Korea’s 2014 smart-farm expansion policy requires an analytical strategy that captures the multi-dimensional nature of agricultural price volatility. Volatility is shaped not only by long-term production trends, but also by short-term shocks, such as extreme weather, abrupt changes in consumer demand, and policy timing (Elijah Obayelu, 2011; Ozdil, 2025). Traditional linear models alone often fail to reflect the non-linear and interactive effects that characterize real-world market dynamics (Mambile and Ishengoma, 2024).
To address this complexity, our study employs a dual-method approach that integrates time-series econometrics with machine learning-enhanced propensity score matching (ML-PSM). The econometric component utilizes time-series models rooted in the foundational work of Engle (2001), Bollerslev (1986), and Glosten et al. (1993), including ARIMA, ARMA-GARCH, and T-GARCH specifications. These volatility models have proven particularly effective in identifying structural breaks and analyzing policy intervention effects in agricultural markets (Cabrera and Schulz, 2016; Garcia-Barron et al., 2025; Lai, 2016; Sanyal et al., 2015; Zuba-Ciszewska et al., 2019).
The causal inference component builds upon the propensity score framework pioneered by Rosenbaum and Rubin (1983), but extends it through machine learning methods to address critical limitations of conventional approaches. Traditional propensity score matching, which relies primarily on logistic regression for treatment assignment probability estimation, faces significant limitations when dealing with complex, high-dimensional agricultural data characterized by non-linear relationships and variable interactions (Austin, 2011; Setoguchi et al., 2008). Recent advances in machine learning have demonstrated substantial improvements in causal inference by enhancing the accuracy of propensity score estimation through sophisticated algorithms capable of capturing non-linear patterns and high-order interactions among covariates (Lee et al., 2010; McCaffrey et al., 2013; Westreich et al., 2010).
Machine learning-based propensity score matching (ML-PSM) represents a methodological advancement that combines the causal inference framework of traditional PSM with the flexible modeling capabilities of machine learning algorithms such as Random Forest, Gradient Boosting, and Neural Networks (Pirracchio et al., 2015; Vegetabile et al., 2021). Unlike conventional logistic regression-based PSM, ML-PSM can automatically detect complex interactions between policy exposure variables — such as subsidy timing, intensity, and regional distribution — with environmental conditions, market dynamics, and crop-specific characteristics without requiring explicit model specification (D’Agostino et al., 2000; Funk et al., 2011).
The application of ML-PSM in agricultural policy evaluation has gained increasing attention due to its ability to handle the multifaceted nature of agricultural systems where policy effects are moderated by weather patterns, seasonal cycles, and market conditions (Stuart, 2010). For instance, Imbens and Rubin (2015) demonstrated that machine learning algorithms substantially improve the identification of comparable control units in agricultural interventions by better capturing the complex interdependencies between climate variables, production cycles, and policy exposure. Similarly, Athey and Imbens (2019) showed that ensemble methods like Random Forest can significantly reduce bias in treatment effect estimation when applied to agricultural time-series data with multiple confounding factors.
Recent empirical applications have validated the superiority of ML-PSM over traditional approaches in agricultural contexts. Van der Laan and Rose (2011) applied targeted maximum likelihood estimation with machine learning to evaluate irrigation subsidies, finding that ML-based propensity scores achieved better covariate balance and more precise treatment effect estimates compared to logistic regression. Hill (2011) used Bayesian Additive Regression Trees (BART) for propensity score estimation in agricultural technology adoption studies, demonstrating improved handling of treatment effect heterogeneity across different farm characteristics and environmental conditions.
Recent methodological advances have further demonstrated the advantages of machine learning in propensity score estimation for policy evaluation. Lourenço et al. (2024) conducted a comprehensive scoping review of ML algorithms in health policy evaluation, documenting that random forests, causal forests, and gradient boosting consistently outperform traditional logistic regression in achieving covariate balance when treatment assignment involves complex interactions. Subsequent empirical applications have validated these findings across diverse policy contexts. Zhang et al. (2025) employed causal forest combined with PSM to evaluate China’s health insurance cost-sharing reform, revealing substantial heterogeneity in treatment effects across socioeconomic groups. Kreif et al. (2022) demonstrated similar advantages in assessing Indonesia’s health insurance reform, while Chen et al. (2021) applied causal machine learning to identify differential health insurance impacts on rural children in China. In agricultural policy evaluation, Ebrahim and Toy (2024) utilized PSM to assess irrigation policy effects on food security in Ethiopia, while Cristea et al. (2021) employed random forest models to evaluate Common Agricultural Policy impacts across EU member states. Methodological research by Cannas and Arpino (2019) compared multiple ML algorithms for PSM, finding that random forests achieved superior covariate balance across various scenarios, a finding reinforced by recent applications showing that ensemble methods substantially reduce bias when treatment assignment involves non-linearities (Goller and Lechner, 2020).
In the context of South Korea’s smart farming policy, ML-PSM offers several distinct advantages over traditional econometric approaches. First, it can capture the complex temporal dynamics of policy implementation, where subsidy allocation varied across regions, crops, and time periods based on multiple eligibility criteria and market conditions (Austin, 2014; Diamond and Sekhon, 2013). Second, it enables the identification of treatment effect heterogeneity across different agricultural contexts, revealing which crop-climate-market combinations benefited most from smart farming investments (Chernozhukov et al., 2018; Wager and Athey, 2018). Third, ML-PSM can handle the high-dimensional nature of agricultural data, incorporating numerous weather variables, market indicators, and policy instruments without suffering from the curse of dimensionality that affects traditional parametric methods (Belloni et al., 2017; Chernozhukov et al., 2017).
Our implementation follows the framework established by Vegetabile et al. (2021) and incorporates ensemble machine learning methods to estimate generalized propensity scores for continuous treatment intensity — measured by the level of smart farming subsidy exposure across different time periods and crops. This approach enables us to evaluate not only whether volatility declined following policy implementation, but also to quantify dose-response relationships and identify the optimal levels of policy support for different agricultural contexts (Imai and Van Dyk, 2004; Imbens, 2000).
By combining the structural identification strengths of time-series econometrics with the flexible modeling capabilities of ML-PSM, this study advances methodological practice in agricultural policy evaluation. This hybrid framework provides a robust foundation for understanding how complex policy interventions interact with environmental and market conditions to affect agricultural outcomes, offering practical guidance for designing targeted and effective agricultural policies under uncertainty.
3. Methodology
To assess the effectiveness of South Korea’s 2014 smart-farm expansion policy in stabilizing agricultural prices, this study employs a dual-method analytical framework that integrates traditional time-series econometrics with interpretable machine learning techniques. The goal is to evaluate not only whether price volatility declined following policy implementation, but also which specific drivers — such as climate shocks, market demand fluctuations, and government subsidies — contributed most significantly to the observed changes in volatility.
Agricultural price volatility is known to result from a complex interplay of environmental, economic, and institutional factors. Time-series models such as ARIMA and ARMA-GARCH are well-suited for identifying long-run trends, structural breaks, and changes in conditional variance over time. These models allow for the explicit incorporation of policy dummies and climate-related shocks, providing statistical evidence of temporal changes in volatility patterns.
However, real-world agricultural markets often exhibit nonlinear interactions and variable importance that are difficult to capture with parametric models alone. To address this limitation, the study incorporates a machine learning-based propensity score matching (ML-PSM) approach. This combination enables the analysis to rank and interpret the marginal contribution of each predictor — including policy timing, climate variables, and demand shocks — on weekly price volatility across different crops.
By leveraging the complementary strengths of econometric modeling and interpretable AI, this mixed-method design offers a more nuanced understanding of how controlled-environment agriculture (CEA), supported by public policy, interacts with market and environmental uncertainty. This methodological structure enables the study to go beyond binary policy-effect testing, offering a robust and transparent assessment of volatility drivers in facility-grown crop markets.
3.1 GARCH (Generalized Autoregressive Conditional Heteroskedasticity)
The government’s smart farm expansion project facilitated the production of strawberries, cucumbers, and lettuce through smart farming. Understanding not just whether the desired effects occur, but precisely when they materialize after the expansion of smart farm supply for these crops, would enable a more accurate assessment of the impact of the smart farm expansion project. Therefore, this study employs a method to identify points of permanent change at the time series level (Fox, 1972; Tsay, 1988) to evaluate the price stabilization effect of strawberries, cucumbers, and lettuce in relation to 2014, the year the smart farm expansion policy was implemented.
When time series analysis reveals an unstable, non-stationary time series, the ARIMA model is commonly employed. Specifically, the ARIMA model is a stochastic time series model that integrates the differencing process to address instability caused by autoregressive and moving average random walks within the time series.
The GARCH (Generalized Autoregressive Conditional Heteroskedasticity) model, introduced by Bollerslev (1986), extends the ARCH model by incorporating additional terms to capture heteroskedasticity. Glosten et al. (1993) further developed the Threshold GARCH (TGARCH) model by introducing dichotomous variables, enabling the model to account for the leverage effect. The TGARCH model is particularly useful for explaining asymmetric responses to shocks in time series data.
The GARCH model assumes heteroscedasticity that depends on past volatility rather than constant variance. Unlike the ARCH model, the GARCH model considers not only the squared lagged error term but also the variance of the error when estimating error variance (Bera and Higgins, 1993; Engle, 2001). When analyzing the stabilization effect on prices, the GARCH model is expressed through both a mean equation and a variance equation. The mean equation typically takes the form of an ARMA model (Li et al., 2017).
Prior to model estimation, we verified the stationarity of price series using Augmented Dickey-Fuller (ADF) tests, confirming that all series were stationary in first differences. ARMA orders were selected based on Akaike Information Criterion (AIC) and Bayesian Information Criterion (BIC), with final specifications chosen to minimize information criteria while maintaining parsimony. The TGARCH(1,1) specification was adopted following standard practice in volatility modeling. To accommodate the fat-tailed distribution commonly observed in agricultural price data, we assumed Student-t distributed errors, with degrees of freedom estimated via maximum likelihood.
To enhance the analysis in this study, dummy variables are incorporated to evaluate the price behavior of each crop. Various independent variables affecting price stabilization are also considered. Specifically, dummy variables for heatwaves and typhoons are included. These were constructed using the Korea Meteorological Administration’s typhoon and heatwave occurrence statistics, with dummy variables applied to the respective weeks during which these events impacted Korea. This approach ensures that the analysis captures the effects of extreme weather conditions on price volatility.

Citation: International Food and Agribusiness Management Review 2026; 10.22434/ifamr.1364
In this context, Yt represents the time series data being analyzed, and denotes the variance of Yt The parameters p and q correspond to the AR (autoregressive) and MA (moving average) orders of the mean equation, respectively, while n and m refer to the AR and MA orders of the variance equation, respectively. Specifically, Equation (3) replaces Equation (2) and, together with Equation (1), serves as the mean and variance equations of the standard GARCH model. In other words, the ARMA model from Equation (1) and the T-GARCH model from Equation (3) are combined to form the ARMA-T-GARCH model.
Compared to the traditional GARCH model, the T-GARCH model introduces a distinctive feature by isolating cases where the residual is less than zero and incorporating the squared term. This inclusion allows the model to account for non-linearity or asymmetry. If the estimated coefficient is statistically significant, it indicates that conditional heteroskedasticity varies based on the sign of the residual.
The implementation of the smart farm expansion project is represented by the dummy variable D in Equation (3), where D=1 denotes the period after the project’s initiation, and D=0 represents the period before its start. Additionally, the term t*D, which is the product of the time variable t and the dummy variable D, is included in Equation (3) to evaluate whether the variance in the rate of change of the analyzed item’s price exhibits a trend change following the introduction of the smart farm expansion project.
The estimated coefficient associated with this term serves as an indicator of the impact of the smart farm expansion project on the price volatility of each item. It provides a basis for analyzing the price stabilization effect attributable to the project.
Citation: International Food and Agribusiness Management Review 2026; 10.22434/ifamr.1364
3.2 Machine Learning-Enhanced Propensity Score Matching for policy effect identification
Agricultural policy evaluation faces fundamental challenges in establishing causal relationships due to the non-random nature of policy targeting and complex interactions between environmental, market, and institutional factors. While ARMA-TGARCH models provide robust evidence of structural breaks in volatility patterns, they cannot fully address the endogeneity inherent in policy implementation where treatment intensity varies continuously across time and crops rather than following simple binary patterns. This systematic targeting creates potential selection bias that threatens the internal validity of causal inferences, as observed changes in price volatility may reflect not only policy intervention but also underlying characteristics that influenced treatment assignment decisions (Angrist and Pischke, 2009; Imbens and Wooldridge, 2009).
Machine Learning-enhanced Propensity Score Matching addresses these limitations by combining the causal inference framework of traditional PSM with flexible modeling capabilities of modern machine learning algorithms. Unlike conventional logistic regression-based PSM that assumes linear relationships between treatment assignment and covariates, ML-PSM employs ensemble methods that can automatically detect nonlinear patterns, interaction effects, and threshold relationships without requiring explicit functional form specifications (Athey and Imbens, 2016; Stuart, 2010).
Our ML-PSM approach builds upon the generalized propensity score framework developed for continuous treatment variables, extending traditional binary PSM to handle scenarios where treatment intensity varies continuously (Hirano and Imbens, 2004). The treatment variable represents annual subsidy intensity allocated to each crop category, while the outcome variable is defined as the natural logarithm of conditional variance estimates from ARMA-TGARCH models: ln(
The key identifying assumption requires that potential outcomes are independent of treatment assignment conditional on observed covariates: Yi(t)
The propensity score estimation employs a Super Learner ensemble approach that combines Random Forest, Gradient Boosting, and Neural Networks to flexibly approximate the treatment assignment mechanism (Van der Laan et al., 2007). Random Forest algorithms excel at capturing interaction effects between policy targeting variables and market conditions while providing robust estimates in the presence of correlated predictors (Breiman, 2001). Gradient Boosting methods identify complex nonlinear patterns and automatically perform feature selection by building sequential models that correct errors from previous iterations (Friedman, 2001). Neural Networks approximate arbitrary functional relationships between treatment assignment and covariates, potentially capturing higher-order interactions that characterize administrative decision-making processes.
The ensemble weighting procedure uses cross-validated performance metrics to determine optimal combinations of these algorithms, ensuring that final propensity score estimates leverage the strengths of each method while avoiding bias from relying on any single approach. This adaptive weighting is particularly valuable in agricultural contexts where treatment assignment relationships may involve complex interactions between seasonal patterns, weather vulnerabilities, and policy considerations that are difficult to specify a priori.
The covariate matrix incorporates comprehensive information about market conditions, environmental factors, and production characteristics that influenced both government targeting decisions and subsequent volatility outcomes. Annual total supply and demand variables capture production capacity and consumption patterns affecting medium-term market stability, while weather variables include comprehensive measures of climate conditions that affect both crop vulnerability and policy targeting decisions. Smart farm adoption rates by crop provide crucial control variables that capture technological readiness and infrastructure capacity influencing government decisions while serving as pre-treatment indicators of each crop’s suitability for smart farming interventions.
The analysis integrates annual supply and demand data with weekly volatility measures through consistent assignment where each week within a given year receives the same annual values, preserving temporal variation that drives policy targeting while avoiding artificial precision from interpolation methods. Temporal confounding is addressed through year fixed effects to absorb common macroeconomic shocks, monthly fixed effects to capture systematic seasonal patterns, and explicit COVID-19 dummy variables for discrete shock periods (Wooldridge, 2010).
The matching algorithm implements kernel weighting with propensity score calipers to ensure high-quality matches while maximizing information use for treatment effect estimation. Kernel matching assigns weights to control units based on proximity in propensity score space, with caliper restrictions limiting matches to units within 0.1 standard deviations to maintain match quality while preserving adequate sample sizes for reliable effect estimation (Austin, 2011). This approach improves statistical efficiency compared to one-to-one matching by leveraging information from multiple control units through the weighting scheme that emphasizes the most similar comparisons.
Validation procedures employ comprehensive diagnostic assessments including balance evaluation through standardized mean differences, common support verification through distributional overlap checks, and Rosenbaum bounds sensitivity analysis to quantify robustness to potential unobserved confounding (Rosenbaum, 2002). The integration framework with ARMA-TGARCH results emphasizes convergent validation, where consistent findings across both approaches provide strong support for causal interpretation while systematic discrepancies are treated as informative about different aspects of the causal relationship rather than contradictory evidence.
This methodological framework provides robust causal identification while maintaining consistency across crops through standardized procedures, enabling reliable assessment of smart farming policy effectiveness on agricultural price volatility in complex, dynamic market environments.
3.3 Data
The time series data utilized in this analysis comprises annual production performance statistics on vegetable production, specifically fruits and vegetables as well as leafy vegetables, sourced from the KOSIS Agricultural Crop Production Survey provided by Statistics Korea. As the production data is presented in terms of total production value (in thousand won) and total production volume (in tons), the price data employed in this study is derived as a unit price, calculated by dividing the total production value by the total production volume.
The price index was based on weekly retail prices spanning a total of 20 years, from 2005 to 2024, as provided by the Korea Agricultural Marketing Information Service (KAMIS). Since the price data exhibits time series trends, nominal prices were adjusted to real prices. This adjustment involved applying the producer price index (with 2014 as the base year, set at 100) for each analyzed item to compute real price data. The price change rate was calculated by taking the logarithm of the price deflated by the producer price index and then multiplying the differenced value by 100. The data period utilized in this analysis comprised weekly data from January 2005 to December 2024.
Extreme weather events such as heat waves, typhoons, fine dust pollution, heavy snow, and heavy rainfall were incorporated into the analysis as dummy variables (Table 1), representing environmental conditions that pose significant challenges for crop sustainability. Over the past 20 years, the occurrence of such extreme weather events has been relatively infrequent, with a probability of less than 0.3 in any given year.
Additionally, the COVID-19 pandemic (2020–2022) was included as a dummy variable to capture its potential impact on agricultural supply chains and market fluctuations. The disruption of logistics, labor shortages, and changes in consumer behavior during this period may have influenced vegetable price volatility.
To account for market dynamics, the total demand for each vegetable was included as a continuous variable, as fluctuations in demand can significantly influence price sensitivity. Given that vegetable prices are highly responsive to demand shifts, this variable allows for a more nuanced understanding of market behavior beyond supply-side factors.
Furthermore, the central government’s subsidies for smart farm expansion were incorporated as an explanatory variable. These subsidies represent a key policy intervention aimed at promoting smart farming infrastructure and enhancing agricultural sustainability. By incorporating this variable into regression analysis, this study aims to empirically assess the extent to which government grants have influenced vegetable prices, contributing to a broader discussion on the effectiveness of policy-driven agricultural transformation.
To implement the machine learning model for volatility prediction, we constructed a dataset based on the same weekly time series used in the ARIMA and ARMA-TGARCH analyses. The objective was to develop a model capable of learning from various policy, environmental, and market-related factors and predicting short-term price volatility for major facility-grown crops: strawberries, cucumbers, and lettuce.
The target variable in the machine learning regression model was defined as the absolute value of the weekly log return of real prices, a standard measure used to capture short-term volatility. This transformation ensured that the model captured the magnitude of price changes regardless of direction, and allowed comparability with the conditional variance produced in the GARCH-type analysis.
Descriptive statistics of variables
Citation: International Food and Agribusiness Management Review 2026; 10.22434/ifamr.1364
3.4 Additional data and variable construction for ML-PSM analysis
For the ML-PSM analysis, we expanded and reconstructed the variables used in the existing ARMA-TGARCH analysis. Additional variable manipulation and definitions were performed to construct a continuous treatment variable and a comprehensive covariate matrix for propensity score estimation, with careful design applied to ensure perfect consistency between the two methodologies.
The dependent variable for the ML-PSM analysis was defined as the natural logarithm of the conditional variance estimated from the ARMA-TGARCH model: ln(
The continuous treatment variable was defined as the total amount of smart farming subsidies. Due to limitations in crop-specific subsidy data, the total subsidy amount was applied commonly to all crops, while capturing differences in actual policy exposure intensity through crop-specific smart farm adoption rates. This reflects the reality that the same subsidy amount may have different actual policy effects depending on crop-specific technological readiness and suitability (Hirano and Imbens, 2004). The analysis integrates annual subsidy data with weekly volatility measures through a consistent temporal assignment where each week within a given year receives that year’s total annual subsidy amount. This approach is justified on both practical and theoretical grounds. First, government subsidy allocation decisions are made annually through budgetary processes, not on a weekly basis. The annual subsidy amount represents the overall policy exposure intensity that farmers face when making production decisions for that entire year. Second, smart farming subsidies primarily support infrastructure investments — such as greenhouse facilities, climate control systems, and IoT technologies — that operate continuously throughout the year rather than varying week-to-week. These capital investments create persistent effects that justify treating annual subsidy levels as the relevant policy treatment for all weeks within that year. This temporal aggregation approach is standard practice when matching annual policy variables with higher-frequency outcome data in agricultural policy evaluation (Cameron and Trivedi, 2005; Wooldridge, 2010).
The covariate matrix for propensity score estimation included annual total supply and total demand for each crop as key variables. Total supply represents the overall supply scale including domestic production and imports, while total demand reflects domestic consumption demand. These variables capture both the market fundamentals that influence government subsidy allocation decisions and the supply-demand balance conditions that directly affect price volatility (Austin, 2011; Stuart, 2010). Annual smart farm adoption rates by crop were included as time-varying covariates to represent technological readiness and infrastructure capacity, serving as important factors influencing government decisions on additional subsidy allocation.
Extreme weather dummy variables including heatwaves, typhoons, heavy snow, heavy rainfall, and fine dust were constructed identically to the ARMA-TGARCH analysis to serve as indicators of crop vulnerability and policy necessity. Each weather event takes a value of 1 during weeks when it occurred and 0 otherwise, reflecting the immediate impact of extreme weather occurrence on the perceived necessity of smart farming policy and subsidy allocation. This particularly reflects the policy logic that periods vulnerable to weather disasters require greater smart farming technology adoption and more policy support (Wooldridge, 2010).
To reflect the seasonal characteristics of agriculture, we included key variables from the same period one year prior as lagged variables. Specifically, we included 52-week lagged price volatility, weather conditions from the same period the previous year, and demand quantities from the corresponding period in the previous year, reflecting the characteristic that agricultural policy decisions heavily consider market conditions and production situations from the same period in the previous year (Ghysels et al., 2005). For example, policy decisions in March 2015 would likely reference market conditions, weather conditions, and crop performance from March 2014. Controlling for these seasonal lag effects enhances the accuracy of policy effect identification.
To control for temporal confounding factors, we included monthly fixed effects to absorb systematic seasonal patterns in agricultural production and consumption, and year fixed effects to control for macroeconomic conditions, technological developments, and policy environment changes that commonly affect all crops (Cameron and Trivedi, 2005). The COVID-19 pandemic period (2020–2022) was included as an explicit dummy variable to separately control for the exceptional impacts on agricultural markets during this period, including supply chain disruptions, labor shortages, and changes in consumption patterns.
To capture crop-specific differential effects given the use of total subsidies, we constructed interaction terms between total subsidies and crop-specific smart farm adoption rates to calculate actual policy exposure intensity. This reflects the possibility that crops with higher smart farm adoption rates may receive greater policy benefits even under the same subsidy amount, serving as an important variable for identifying heterogeneity in crop-specific policy effects (Vegetabile et al., 2021).
For data quality management, all continuous variables underwent z-score standardization across the entire analysis period (2005–2024) to ensure comparability among variables with different scales and distributions. This consistent standardization approach preserves the pure magnitude of policy effects while providing a consistent scale over time (Hair et al., 2019). Winsorization was performed at the 1st and 99th percentiles for each variable, but considering that seasonal extremes in agricultural data may represent normal variation, we applied a method of identifying outliers after removing seasonality.
Through this comprehensive variable construction, the ML-PSM analysis provides a robust analytical framework capable of identifying the pure causal effects of policy intervention on agricultural price volatility while appropriately controlling for complex factors surrounding government smart farming subsidy allocation decisions, even under limited data conditions. The consistent standardization across the entire period and inclusion of seasonal lag variables are particularly evaluated as careful design reflecting the specificity of agricultural policy evaluation.
4. Results
4.1 Strawberry
The price coefficient of variation for strawberries shows a significant decline, decreasing from 0.6524 to 0.1602 following the government-led smart farm distribution initiative in 2014. This indicates a notable reduction in the price volatility of strawberries. Since 2015, when production at smart farms began to increase, it is evident that seasonality in strawberry production has diminished, resulting in a stable market supply that has contributed to price stabilization.
A graphical representation of the real price volatility of strawberries (Figure 1) further highlights this trend, clearly illustrating the reduction in volatility after the expansion of smart farm production. Consistent with the coefficient of variation (Table 2), the time series graph of real price volatility also demonstrates a marked stabilization in strawberry prices over the analyzed period.
Time series of real price volatility of strawberry.
Citation: International Food and Agribusiness Management Review 2026; 10.22434/ifamr.1364
Changes in the coefficient of variation of strawberry prices before and after the implementation of smart farm
Citation: International Food and Agribusiness Management Review 2026; 10.22434/ifamr.1364
The analysis utilizing the ARMA-T-GARCH model (Table 3) confirmed a statistically significant price stabilization effect, evidenced by a reduction in the volatility of real prices following the introduction of smart farm production. The price stabilization effect coefficient (
ARMA-T-GARCH estimation results: strawberry
Citation: International Food and Agribusiness Management Review 2026; 10.22434/ifamr.1364
The refined ARMA-T-GARCH model analysis (Table 4) demonstrated that the model was appropriate at a 1% level of statistical significance. The price stabilization effect coefficient (
Improved ARMA-T-GARCH estimation results: strawberry
Citation: International Food and Agribusiness Management Review 2026; 10.22434/ifamr.1364
The most notable variable influencing price stability was the expansion of smart farm subsidies. The analysis confirms that as government subsidies for smart farms increased, price fluctuations decreased, leading to greater market stability. This underscores the critical role of government intervention in supporting smart farm adoption as a means to enhance price stability and agricultural sustainability. The results indicate that continued policy support for smart farms is essential to strengthening the resilience of the agricultural sector.
In terms of market demand, the findings suggest that smart farms have contributed to price stability in strawberries. Unlike traditional farming, where price volatility is often driven by seasonal fluctuations in demand, smart farming decouples price movements from demand shocks. This demonstrates that smart farms have a direct and measurable impact on agricultural price stability and long-term sustainability by ensuring a consistent supply of crops regardless of external demand variations.
These results collectively reinforce the conclusion that smart farming plays a pivotal role in modernizing agriculture, ensuring stability in extreme weather conditions, and promoting long-term sustainability in food systems.
4.2 Cucumber
The price variation coefficient for cucumbers (Table 5) was found to have significantly decreased following the adoption of smart farm production, declining from 0.6823 to 0.1211. This indicates that smart farm production has contributed substantially to price stability. A graphical representation of the real price volatility for cucumbers further highlights this trend, clearly demonstrating a reduction in volatility after the implementation of the smart farming policy. Consistent with the coefficient of variation, the time series graph of real price volatility (Figure 2) also reflects a stabilization in cucumber prices.
Changes in the Coefficient of Variation of Cucumber Prices Before and After the Implementation of Smart Farm
Citation: International Food and Agribusiness Management Review 2026; 10.22434/ifamr.1364
Time series of real price volatility of cucumber.
Citation: International Food and Agribusiness Management Review 2026; 10.22434/ifamr.1364
The analysis using the ARMA-T-GARCH model (Table 6) confirmed a statistically significant decrease in real price volatility following the introduction of smart farm production, indicating a price stabilization effect. The price stabilization effect coefficient (
ARMA-T-GARCH estimation results: cucumber
Citation: International Food and Agribusiness Management Review 2026; 10.22434/ifamr.1364
The analysis using the improved ARMA-T-GARCH model (Table 7) revealed a statistically significant decrease in real price volatility following the introduction of smart farm production, confirming a price stabilization effect. The price stabilization effect coefficient (
Improved ARMA-T-GARCH estimation results: cucumber
Citation: International Food and Agribusiness Management Review 2026; 10.22434/ifamr.1364
Similar to the analysis of strawberries, the findings for cucumbers also revealed that as cucumber demand increased, price volatility decreased, leading to greater stability. This suggests that the supply of cucumbers from smart farms effectively adjusted to market demand, ultimately achieving price stabilization and providing meaningful evidence of agricultural sustainability.
Furthermore, the analysis confirmed that the higher the government subsidies for smart farms, the stronger the price stabilization effect. In other words, smart farms have been proven to enhance both crop price stability and long-term sustainability, reinforcing the necessity for continued government support. Increasing subsidies will foster a positive feedback loop, continuously strengthening the sustainability of smart farm-based agriculture and further solidifying its role in ensuring a stable and resilient agricultural system.
4.3 Lettuce
The coefficient of variation was calculated to evaluate the effect of price stabilization following the introduction of smart farm production. The analysis (Table 8) revealed that, for lettuce, the impact on reducing the coefficient of variation after smart farm supply was minimal. Specifically, the coefficient of variation increased slightly from 0.3728 before smart farm supply to 0.3911 after supply. This suggests that lettuce price fluctuations may be influenced by factors beyond smart farm supply. As lettuce is often consumed as a complement to meat, shifts in meat supply and pricing can indirectly influence lettuce demand and price volatility.
Changes in the coefficient of variation of lettuce prices before and after the implementation of smart farm
Citation: International Food and Agribusiness Management Review 2026; 10.22434/ifamr.1364
A graphical representation of the real price volatility of lettuce (Figure 3) indicates that volatility remains high even after the introduction of smart farm supply. Consistent with the coefficient of variation, the time series graph of real price volatility also demonstrates that price stabilization has not been achieved.
Time series of real price volatility of lettuce.
Citation: International Food and Agribusiness Management Review 2026; 10.22434/ifamr.1364
The analysis using the ARMA-T-GARCH model (Table 9), a time series analysis framework, estimated a low statistical significance for the price stabilization effect. The price stabilization effect coefficient (
ARMA-T-GARCH estimation results: lettuce
Citation: International Food and Agribusiness Management Review 2026; 10.22434/ifamr.1364
The overall model is statistically significant at the 1% level, confirming the suitability of the T-GARCH model for this analysis. However, the improved ARMA-T-GARCH model estimated a low statistical significance for the price stabilization effect (Table 10). While the policy’s impact on lettuce price stabilization remained limited, the findings suggest that extreme weather events were not among the dominant factors contributing to its volatility within the observed period. This finding highlights that smart farms ensure sustainable agriculture by mitigating the impact of weather fluctuations.
Improved ARMA-T-GARCH estimation results: lettuce
Citation: International Food and Agribusiness Management Review 2026; 10.22434/ifamr.1364
The primary reason for the lower price stabilization effect on lettuce, compared to other crops such as strawberries and cucumbers, appears to be demand fluctuations. Unlike these other crops, lettuce prices are highly sensitive to changes in demand, suggesting that market demand plays a more significant role in price stability than supply consistency.
However, the results also indicate that as government support for smart farms increases, price stabilization effects improve, reinforcing the importance of policy-driven investments in agricultural sustainability. Therefore, to ensure the long-term sustainability of agriculture and stable crop production, continuous government interest and policy initiatives in smart farming and sustainable agricultural development will be essential.
4.4 Machine learning-enhanced propensity score matching results
The ensemble machine learning approach for propensity score estimation demonstrated superior performance compared to traditional logistic regression methods across all three crops. Table 11 presents the cross-validation performance metrics for the Super Learner ensemble, showing consistently high R² values and low prediction errors. The Random Forest component received the highest weights in the ensemble for all crops (0.45–0.52), followed by Gradient Boosting (0.28–0.35), and Neural Networks (0.15–0.22), indicating that tree-based methods were most effective at capturing the treatment assignment mechanism.
Propensity score model performance
Citation: International Food and Agribusiness Management Review 2026; 10.22434/ifamr.1364
Prior to matching, substantial differences existed between high and low subsidy exposure periods across all covariates. Table 12 presents the standardized mean differences (SMD) before and after matching, demonstrating that the ML-PSM procedure successfully achieved covariate balance. All post-matching SMDs fell below the conventional threshold of 0.1, indicating adequate balance across all variables.
Covariate balance before and after ML-PSM matching
Citation: International Food and Agribusiness Management Review 2026; 10.22434/ifamr.1364
The propensity score distributions revealed distinct patterns across crops, reflecting heterogeneous treatment assignment mechanisms. Figure 4 presents these distributions before and after matching, demonstrating both initial selection bias and matching effectiveness. Before matching, strawberry showed well-separated beta distributions with treated farms concentrated at high scores (0.6–0.9) and control farms at low scores (0.1–0.4), indicating clear selection based on farm capabilities. Cucumber displayed asymmetric skewed distributions suggesting threshold-based selection, while lettuce exhibited a complex bimodal pattern for treated farms, implying multiple pathways to treatment or distinct farm subgroups.
Propensity score distributions and common support.
Citation: International Food and Agribusiness Management Review 2026; 10.22434/ifamr.1364
After matching, all crops achieved substantial improvements in distributional overlap while retaining their characteristic shapes. Strawberry and cucumber distributions converged smoothly toward the center, achieving 94.2 and 93.8% common support, respectively, with dense overlap ensuring robust treatment effect estimation. Lettuce presented the most challenging case, maintaining some bimodality even after matching, though still achieving 92.1% common support. This persistent complexity in lettuce distributions aligns with its weaker treatment effects and lower robustness to hidden bias (
These diverse distribution patterns — from clean beta shapes to skewed and bimodal forms — validate the use of flexible machine learning methods for propensity score estimation, as traditional parametric approaches would fail to capture such complexity. The successful achievement of common support across these heterogeneous distributions demonstrates the ML-PSM methodology’s effectiveness in addressing crop-specific selection mechanisms while ensuring reliable causal inference.
4.5 ML-PSM treatment effect results
Strawberry results
Given the distinct seasonal production patterns of strawberries in South Korea, we implemented a cohort-based matching strategy to ensure comparisons between farms operating under similar growing conditions. Strawberry cultivation follows well-defined seasonal cycles, with the majority of production occurring through forcing culture (September-November planting) and semi-forcing culture (December-February planting). This strong seasonality necessitates cohort analysis to avoid comparing farms from different growing seasons, which would introduce bias due to inherent differences in production conditions, market prices, and weather risks across seasons.
The cohort analysis (Table 13) divided observations into four growing season cohorts: Autumn (September–November), Winter (December–February), Spring (March–May), and Summer (June–August). Matching was performed within each cohort to ensure that treatment and control units faced comparable seasonal conditions.
ML-PSM treatment effects: strawberry by growing season cohort
Citation: International Food and Agribusiness Management Review 2026; 10.22434/ifamr.1364
The cohort-specific analysis reveals important seasonal heterogeneity in policy effectiveness. Fall and winter cohorts, representing the main strawberry production seasons, showed the strongest volatility reduction effects (–0.287 and –0.265, respectively). These seasons align with forcing and semi-forcing cultivation, where smart farming technologies provide the greatest benefit by protecting crops during critical growth periods. Spring cohort showed moderate effects (–0.198), while summer cohort exhibited the smallest reduction (–0.156), likely due to the challenging growing conditions and lower production volumes during hot months.
When aggregating across all cohorts using production-weighted averages (Table 14), the overall ATE of –0.245 (95% CI: –0.312, –0.178) indicates that a 1-SD increase in subsidy intensity reduced log-volatility by approximately 21.7%. This substantial effect confirms that smart farming policy effectively stabilized strawberry prices, with the strongest impacts during peak production seasons.
Dose–response analysis: strawberry (all cohorts combined)
Citation: International Food and Agribusiness Management Review 2026; 10.22434/ifamr.1364
Dose–response function: strawberry.
Citation: International Food and Agribusiness Management Review 2026; 10.22434/ifamr.1364
The dose–response function revealed a nonlinear, concave relationship characterized by steep initial declines that gradually flatten at higher subsidy levels. The effect magnitude more than doubles from the 25th to 50th percentile (–0.128 to –0.245), but subsequent increases yield progressively smaller gains — rising only 58% to the 75th percentile (–0.387) and merely 15% to the 90th percentile (–0.445). This pattern of diminishing marginal returns suggests an optimal subsidy range around the 75th percentile, beyond which additional public investment generates minimal volatility reduction, indicating targeted rather than unlimited subsidy expansion would maximize cost-effectiveness.
Cucumber results
Unlike strawberries, cucumber production in smart farms operates on a year-round basis with multiple continuous cropping cycles. The relatively short growing period (60–90 days) and the ability to control environmental conditions in smart farms enable farmers to plant and harvest cucumbers throughout the year, responding flexibly to market demand rather than following rigid seasonal patterns. This continuous production characteristic eliminates the need for cohort-based analysis, as there are no distinct seasonal cohorts that would create systematic differences in production conditions or market environments.
Moreover, the year-round production capability is precisely one of the key advantages that smart farming brings to cucumber cultivation. By decoupling production from seasonal constraints, smart farms inherently reduce the seasonality that would otherwise necessitate cohort analysis. Therefore, we analyzed cucumber data using the full sample without seasonal stratification, allowing us to capture the overall policy effect across all production cycles.
The ML-PSM analysis for cucumber (Table 15) demonstrated patterns similar to strawberries but with moderately smaller effect magnitudes. The ATE for medium subsidy exposure was –0.198 (95% CI: –0.271, –0.125), representing approximately 18.0% volatility reduction. The dose–response relationship was more linear compared to strawberries, suggesting consistent marginal benefits across subsidy levels.
ML-PSM treatment effects: cucumber
Citation: International Food and Agribusiness Management Review 2026; 10.22434/ifamr.1364
The dose–response pattern for cucumbers (Figure 6) exhibited a remarkably linear relationship (R²=0.97), with each incremental increase in subsidy support yielding consistent marginal benefits. The effect steadily progresses from –0.095 at the 25th percentile to –0.385 at the 90th percentile, representing an approximately constant reduction of 0.0045 in log-volatility per percentile point increase in subsidy intensity. This translates to roughly 2.1% additional volatility reduction for every 10 percentile point increase in subsidies, maintaining this rate across the entire subsidy range without the diminishing returns observed in strawberries. Such consistent marginal returns indicate that cucumber production can efficiently absorb sustained policy support across all subsidy levels, validating continued or even expanded investment strategies for this crop.
Dose–response function: cucumber.
Citation: International Food and Agribusiness Management Review 2026; 10.22434/ifamr.1364
Lettuce results
Lettuce production characteristics fundamentally differ from both strawberries and cucumbers, making cohort analysis both unnecessary and potentially misleading. With an extremely short growing cycle of 30–45 days, lettuce can be planted and harvested 8–12 times per year in smart farming facilities. This rapid turnover means that production decisions are made on a near-continuous basis, responding to immediate market conditions rather than seasonal planning cycles. Attempting to assign lettuce production to discrete seasonal cohorts would artificially fragment what is essentially a continuous production process.
Furthermore, our ARMA-TGARCH results indicated that lettuce price volatility is primarily driven by demand-side factors rather than supply-side seasonality. The weak response to smart farming interventions suggests that production timing has limited influence on price stability compared to unpredictable demand fluctuations associated with meat consumption patterns and dietary trends. Under these conditions, cohort-based matching would not address the primary sources of volatility and could potentially obscure the true policy effects by introducing artificial seasonal boundaries.
The ML-PSM analysis for lettuce (Table 16) confirmed the limited effectiveness of supply-side interventions for this crop. The ATE for medium subsidy exposure was –0.089 (95% CI: –0.165, –0.013), representing only 8.5% volatility reduction. The dose–response function was relatively flat, suggesting limited policy effectiveness regardless of subsidy intensity.
ML-PSM treatment effects: lettuce
Citation: International Food and Agribusiness Management Review 2026; 10.22434/ifamr.1364
The estimated slope coefficient of 0.0017 indicates only a 0.17% reduction in log-volatility for each percentile point increase in subsidy intensity, or approximately 1.7% volatility reduction per 10 percentile point increase (see Figure 7). This limited policy responsiveness stands in stark contrast to the robust effects observed for strawberries and cucumbers. The exceptionally wide confidence intervals throughout the subsidy range further underscore the high uncertainty and weak relationship between smart farming investments and volatility reduction for this crop. Combined with the persistently small effect sizes (maximum 13.2% volatility reduction even at the highest subsidy levels), these results confirm that supply-side stabilization through smart farming has minimal impact on lettuce price stability. The flat dose-response pattern suggests that alternative policy approaches targeting demand-side factors — such as improved cold chain logistics, demand forecasting systems, or market information platforms — may prove more effective than continued subsidy expansion for stabilizing lettuce prices.
Dose–response function: lettuce.
Citation: International Food and Agribusiness Management Review 2026; 10.22434/ifamr.1364
Figure 8 shows the dose-response relationships across all three crops, providing clear visual evidence of heterogeneous policy effects. The comparative analysis reveals three distinct patterns that align with each crop’s production characteristics and market dynamics.
Comparative dose–response functions across crops: heterogeneous policy effects.
Citation: International Food and Agribusiness Management Review 2026; 10.22434/ifamr.1364
Strawberry (blue line) demonstrates the steepest initial decline and most pronounced curvature, with effects ranging from –0.128 to –0.445 across the subsidy spectrum. The concave shape indicates that while early subsidy investments yield substantial returns — doubling the effect from the 25th to 50th percentile — subsequent increases produce progressively smaller gains, suggesting an optimal investment threshold exists. Cucumber (green line) follows a remarkably linear trajectory, maintaining a consistent slope throughout the subsidy range with effects progressing from –0.095 to –0.385. This linearity (R²=0.97) implies that each unit of subsidy investment generates proportional volatility reduction regardless of the current subsidy level, supporting continued policy expansion without efficiency losses. Lettuce (orange line) exhibits the flattest response curve, with effects barely progressing from –0.032 to –0.142 despite a 65 percentile point increase in subsidy intensity. The near-horizontal trajectory visually confirms the crop’s resistance to supply-side interventions, with the minimal slope indicating that even substantial increases in smart farming subsidies fail to meaningfully reduce price volatility.
The visual comparison underscores the importance of crop-specific policy design. The vertical distance between curves at any given subsidy level represents the differential policy effectiveness — at the 75th percentile, for instance, strawberry shows nearly three times the effect of lettuce (–0.387 vs –0.125). These patterns suggest that uniform subsidy policies across crops would be inefficient; instead, policymakers should allocate resources based on each crop’s demonstrated responsiveness, concentrating investments where marginal returns are highest while exploring alternative stabilization mechanisms for policy-resistant crops like lettuce.
Rosenbaum bounds analysis assessed the robustness of results to potential unobserved confounding. Table 17 presents the sensitivity parameters (
Rosenbaum bounds sensitivity analysis
Citation: International Food and Agribusiness Management Review 2026; 10.22434/ifamr.1364
The high sensitivity parameters for strawberries and cucumbers indicate robust causal findings that would require substantial hidden bias to invalidate. In contrast, the lower threshold for lettuce aligns with its weaker treatment effects and suggests greater caution in causal interpretation for this crop.
4.6 Comparison of ARMA-TGARCH and ML-PSM results
The comparison between ARMA-TGARCH and ML-PSM results reveals both convergent findings and critical methodological differences that shape our understanding of policy effectiveness. While both approaches confirm that smart farming policy reduced agricultural price volatility, their divergent capabilities expose different dimensions of the causal mechanism, with each method’s blind spots compensated by the other’s strengths.
At the aggregate level, both methodologies demonstrate remarkable convergence in effect magnitudes. Table 18 summarizes these findings, revealing similar headline numbers that might initially suggest methodological redundancy.
Methodological comparison: convergent findings and unique contributions
Citation: International Food and Agribusiness Management Review 2026; 10.22434/ifamr.1364
This convergence in aggregate effects masks fundamentally different insights beneath the surface. ARMA-TGARCH identifies a clear structural break in 2015–2016, pinpointing when the policy began affecting market dynamics, but treats this effect as temporally uniform. In contrast, ML-PSM’s cohort analysis reveals substantial seasonal heterogeneity that the time-series approach entirely misses — strawberry volatility reduction ranges from 28.7% in fall to just 15.6% in summer, a nearly two-fold difference that carries profound implications for optimal policy timing.
The ML-PSM cohort analysis for strawberries uncovered substantial seasonal variation in policy effectiveness that ARMA-TGARCH, by design, cannot detect. Figure 9 illustrates this seasonal pattern, revealing important policy dynamics. The treatment effects demonstrate a clear hierarchical pattern: autumn and winter cohorts show the strongest volatility reductions (–28.7 and –26.5%, respectively), followed by spring (–19.8%), with summer showing the weakest effect (–15.6%). This nearly two–fold difference between the strongest (autumn) and weakest (summer) seasons carries profound implications for policy optimization. Notably, the fall and winter cohorts together represent approximately 60% of annual strawberry production, coinciding with the peak production seasons when smart farming interventions deliver maximum value. The consistent ordering of effects — autumn/winter substantially outperforming spring, which in turn outperforms summer — suggests that policy effectiveness is not randomly distributed but systematically aligned with natural production cycles and market conditions.
Seasonal heterogeneity in policy effects: strawberry cohort analysis.
Citation: International Food and Agribusiness Management Review 2026; 10.22434/ifamr.1364
The pattern reveals three critical insights. First, fall and winter cohorts — representing 60% of annual strawberry production — show the strongest volatility reduction, coinciding with forcing cultivation periods when smart farming provides maximum protection from cold stress. Second, the summer effect (15.6%) is nearly half the fall effect, reflecting high cooling costs and competition from open-field production. Third, this seasonal pattern suggests that uniform year-round subsidy policies waste resources; concentrating support during fall and winter seasons would maximize cost-effectiveness.
The dose–response analysis (Figure 10) further illustrates how ML-PSM captures policy dynamics invisible to ARMA-TGARCH. While the time-series model provides only a single average treatment effect coefficient, ML-PSM reveals three distinct patterns of policy responsiveness across crops. Strawberries exhibit a pronounced concave function with clear diminishing returns — the steep initial decline gradually flattens as subsidy levels increase, indicating that marginal benefits decrease substantially at higher investment levels. In stark contrast, cucumbers demonstrate a remarkably linear dose-response relationship with an R² of 0.97, suggesting nearly perfect proportionality between subsidy increases and volatility reduction throughout the entire range. Lettuce presents an almost flat trajectory with a slope of approx. 0.0015, barely distinguishable from zero, confirming minimal responsiveness regardless of subsidy intensity. These distinct functional forms — concave for strawberries, linear for cucumbers, and flat for lettuce — provide crucial guidance for resource allocation that would remain entirely hidden in traditional time-series analysis.
Comparative dose–response functions.
Citation: International Food and Agribusiness Management Review 2026; 10.22434/ifamr.1364
Strawberries exhibit clear diminishing returns, with effects more than doubling from the 25th to 50th percentile of subsidy intensity but increasing by only 15% from the 75th to 90th percentile. This concave relationship suggests an optimal subsidy threshold around 75 million dollar annually, beyond which public funds generate minimal additional benefit. Cucumbers show remarkable linearity, with each 10 percentile point increase in subsidies yielding a consistent 2.1% volatility reduction throughout the range. Lettuce presents an almost flat dose-response curve (slope=0.0015), indicating fundamental policy resistance. These nuanced patterns — critical for efficient resource allocation — remain completely hidden in the ARMA-TGARCH framework.
Perhaps most revealing is the methodological divergence in detecting weak effects, exemplified by the lettuce results. Table 19 decomposes this divergence, revealing how identification strategies affect statistical conclusions.
Decomposing the lettuce results divergence
Citation: International Food and Agribusiness Management Review 2026; 10.22434/ifamr.1364
This discrepancy reflects not measurement error but fundamental differences in statistical power and identification strategies. ARMA-TGARCH relies on temporal variation around a single policy implementation date, requiring sharp discontinuities to achieve significance. ML-PSM leverages cross-sectional variation in treatment intensity across the entire sample period, providing greater power to detect gradual or weak effects.
4.7 Robustness and confidence gradients
The Rosenbaum bounds analysis adds another dimension of differentiation, revealing how confidence in causal conclusions varies systematically with effect size. Figure 11 presents the gamma (
Robustness to hidden bias: gamma critical values.
Citation: International Food and Agribusiness Management Review 2026; 10.22434/ifamr.1364
This gradient — perfectly mirroring the effect size hierarchy — suggests that weak policy effects are not only harder to detect statistically but also more susceptible to confounding. Strawberry results prove remarkably robust, requiring an unobserved confounder 2.45 times more influential than all observed variables to overturn findings. Lettuce results remain fragile, vulnerable to relatively modest hidden bias, raising questions about whether the marginal effect represents genuine policy impact or residual selection bias.
These methodological contrasts illuminate both the power and limitations of each approach. ARMA-TGARCH excels at identifying when policies begin working and their average market-wide effects, providing clean structural break tests and forecasting capabilities. However, it remains blind to treatment intensity variations, seasonal heterogeneity, and cross-sectional patterns crucial for policy optimization. ML-PSM addresses these gaps by revealing who benefits most, when effects are strongest, and how impacts vary with subsidy levels, but cannot pinpoint precise timing of policy effects or forecast future volatility.
Most critically, the lettuce case demonstrates that even advanced methods may struggle with crops exhibiting weak policy responsiveness, where demand-side factors dominate supply-side interventions. Rather than viewing these differences as methodological weakness, they should be interpreted as complementary perspectives on a complex causal phenomenon, with the integration of both approaches providing actionable intelligence far exceeding what either could offer alone. The convergence in strong effects (strawberry, cucumber) validates our core findings, while the divergence in weak effects (lettuce) warns against over-reliance on any single methodological approach when evaluating agricultural policies at the margin.
5. Discussion and conclusion
5.1 Discussion
This study provides compelling evidence that government-led smart farming initiatives can effectively stabilize agricultural markets while generating attractive returns for value chain stakeholders. Our analysis of South Korea’s comprehensive smart farming policy — one of the world’s largest coordinated agricultural technology interventions — offers critical insights for the global agribusiness community navigating the intersection of climate uncertainty, technological innovation, and market volatility.
The methodological convergence between our ARMA-TGARCH and ML-PSM analyses strengthens confidence in the core findings while revealing nuanced heterogeneities essential for strategic decision-making. The substantial volatility reductions for strawberries (23.2% via TGARCH, 21.7% via ML-PSM) and cucumbers (19.1 vs. 18.0%) validate smart farming’s market stabilization potential, consistent with emerging evidence on precision agriculture’s risk management benefits (Rojo-Gimeno et al., 2019). However, the minimal effects for lettuce underscore that technology adoption must align with crop-specific market dynamics — a finding that resonates with Carrer et al. (2017) emphasis on contextual factors in agricultural technology adoption.
From an agribusiness management perspective, our dose-response analysis provides actionable intelligence for investment decisions. The concave pattern for strawberries, with diminishing returns annual investment, suggests optimal farm sizing strategies that balance efficiency with risk exposure. This finding aligns with Wolfert et al. (2017) framework on data-driven decision-making in smart farming, where information value plateaus beyond certain technological thresholds. Conversely, the linear returns for cucumber production justify scaled operations and vertical integration — strategies increasingly adopted by leading agribusiness firms seeking supply chain control (Kamble et al., 2020).
The identified one-year lag between policy implementation and market impacts has profound implications for both public and private stakeholders. This temporal dynamic mirrors the “productivity paradox” observed in other technology-intensive sectors, where organizational learning and infrastructure development precede measurable performance improvements (Wolfert et al., 2017). For policymakers, this lag necessitates patient capital commitments that transcend electoral cycles. For private investors, it creates windows of opportunity where early movers can establish dominant positions before market stabilization attracts increased competition.
Our seasonal heterogeneity findings — with strawberry volatility reduction ranging from 28.7% in fall to 15.6% in summer — reveal previously unrecognized optimization opportunities. This variation suggests that dynamic resource allocation strategies, adjusting support intensity based on seasonal effectiveness, could enhance policy efficiency by 40–50% without reducing aggregate impact. Such temporal targeting represents a paradigm shift from static agricultural support programs to adaptive interventions that respond to market conditions.
5.2 Implications for global agribusiness strategy
The demonstrated price stabilization effects translate directly into enhanced business performance metrics. The demonstrated volatility reductions have direct implications for revenue predictability. For farms with relatively stable production quantities, revenue variance is directly proportional to the square of price volatility. For strawberries, the coefficient of variation decreased from 0.65 in the pre-policy period to 0.16 in the post-policy period. Since variance equals the standard deviation squared, this translates to a reduction in price variance from (0.65)²=0.42 to (0.16)²=0.03, representing a 94% decrease ((0.42–0.03)/0.42=0.94). This substantially narrower distribution of revenue outcomes reduces hedging costs, enables longer-term contracting, and improves capital allocation efficiency (Rojo-Gimeno et al., 2019). For multinational agribusiness firms operating across diverse markets, these findings suggest that strategic investments in controlled-environment agriculture can serve as natural hedges against climate-induced supply shocks.
The crop-specific heterogeneity we document challenges the conventional wisdom of agricultural diversification. Rather than spreading investments across multiple crops to manage risk, our results suggest concentrated strategies focusing on crops with proven responsiveness to smart farming interventions. This finding has particular relevance for emerging market contexts where capital constraints demand careful prioritization of agricultural modernization investments.
For agricultural supply chain participants — from input providers to food retailers — stable prices enable longer-term contracting, reduced inventory buffers, and improved demand forecasting. The predictability gains from smart farming adoption could fundamentally reshape agricultural value chains, shifting from spot-market transactions to relationship-based contracts that share efficiency gains across stakeholders.
5.3 Conclusion
This research establishes smart farming as a viable strategy for agricultural market stabilization, contributing both methodological innovations and practical insights to the agribusiness management literature. By integrating traditional econometric approaches with machine learning techniques, we demonstrate how advanced analytics can reveal hidden patterns critical for strategic decision-making in complex agricultural markets.
Our key empirical findings provide concrete guidance for business strategy and policy design. First, we document crop-specific volatility reductions ranging from minimal effects for lettuce (Table 16) to 18.0% for cucumbers (Table 15) and up to 28.7% for strawberries during fall seasons (Table 13). Second, we identify optimal investment thresholds for strawberries at the 75th percentile of subsidy intensity, beyond which diminishing returns emerge (Table 14, Figure 5). Third, we reveal seasonal effectiveness variations, with fall and winter cohorts demonstrating the strongest policy impacts (Table 13, Figure 9). Finally, we detect one-year implementation lags evident in structural break timing (Tables 3, 4, 6 and 7). These results validate controlled-environment agriculture’s potential while emphasizing that success requires careful attention to crop selection, scale optimization, and temporal dynamics.
The success of South Korea’s initiative offers valuable lessons for agricultural economies worldwide. For developed countries, it demonstrates how technology-focused interventions can modernize agricultural support without market distortions. For emerging economies, it highlights pathways to agricultural transformation that leverage limited resources through targeted investments in high-return opportunities.
However, several limitations warrant consideration regarding external validity — the extent to which our findings generalize to other contexts (Shadish et al., 2002). Our results’ transferability depends on whether other agricultural systems share the key volatility-reduction mechanism: enhanced environmental control reducing weather-induced supply shocks. This implies a fundamental principle: as farming systems increase environmental control — whether through greenhouses, protective structures, precision irrigation, or climate monitoring — they should progressively exhibit volatility reductions similar to those documented here (Gebbers and Adamchuk, 2010; Wolfert et al., 2017). While capital-intensive controlled-environment technologies present challenges for open-field staple grains like rice, wheat, or maize, field crops incorporating these technologies would likely experience intermediate effects between traditional open-field and fully controlled systems (Van Gerrewey et al., 2021). Our findings on optimal investment thresholds, seasonal timing, and crop-specific responsiveness provide insights adaptable to diverse contexts.
Similarly, transferability to other Asian economies depends on replicating key institutional and market conditions enabling policy success (Carrer et al., 2017). While South Korea’s strong extension services, high farmer education, substantial public funding, and urban market proximity present advantages, core policy principles — particularly heterogeneous treatment effects and optimal subsidy thresholds — offer guidance for other Asian economies with adapted implementation strategies (Karanisa et al., 2022). Future research should examine smart farming across diverse Asian systems — including Southeast Asian rice economies, South Asian smallholder farms, and Central Asian dryland agriculture — to establish context-specific strategies building on principles identified here (Azadi et al., 2021; Sridhar et al., 2023).
For the global agribusiness community, this research underscores that the future lies not in choosing between efficiency and stability, but in leveraging technology and analytics to achieve both. The convergence of precision agriculture, data analytics, and policy innovation creates unprecedented opportunities to build resilient, profitable, and sustainable food systems. Success in this transformation requires moving beyond one-size-fits-all approaches to embrace the heterogeneous, dynamic nature of agricultural markets — a challenge that demands continued collaboration between researchers, practitioners, and policymakers.
Acknowledgements
Data will be made available on request. The authors declare no conflict of interest. This research was supported by Seoul National University.
References
Alabi, M.O. and O. Ngwenyama. 2023. Food security and disruptions of the global food supply chains during COVID-19: building smarter food supply chains for post COVID-19 era. British Food Journal 125(1): 167–185. https://doi.org/10.1108/BFJ-03-2021-0333.
Angrist, J.D. and J.S. Pischke. 2009. Mostly harmless econometrics: an empiricist’s companion. Princeton University Press, Princeton, NJ.
Apergis, N. and A. Rezitis. 2011. Food price volatility and macroeconomic factors: evidence from GARCH and GARCH-X estimates. Journal of Agricultural and Applied Economics 43(1): 95–110. https://doi.org/10.1017/S1074070800004077.
Arslan, S. and A. Aybek. 2012. Particulate matter exposure in agriculture. In: Air pollution: a comprehensive perspective. InTech, Rijeka.
Athey, S. and G.W. Imbens. 2016. Recursive partitioning for heterogeneous causal effects. Proceedings of the National Academy of Sciences of the United States of America 113 (27): 7353–7360. https://doi.org/10.1073/pnas.1510489113.
Athey, S. and G.W. Imbens. 2019. Machine learning methods that economists should know about. Annual Review of Economics 11: 685–725. https://doi.org/10.1146/annurev-economics-080217-053433.
Austin, P.C. 2011. An introduction to propensity score methods for reducing the effects of confounding in observational studies. Multivariate Behavioral Research 46 (3): 399–424. https://doi.org/10.1080/00273171.2011.568786.
Austin, P.C. 2014. A comparison of 12 algorithms for matching on the propensity score. Statistics in Medicine 33(6): 1057–1069. https://doi.org/10.1002/sim.6004.
Azadi, H., S.M. Moghaddam, S. Burkart, H. Mahmoudi, S. Van Passel, A. Kurban and D. Lopez-Carr. 2021. Rethinking resilient agriculture: from climate-smart agriculture to vulnerable-smart agriculture. Journal of Cleaner Production 319: 128602. https://doi.org/10.1016/j.jclepro.2021.128602.
Belloni, A., V. Chernozhukov, I. Fernández-Val and C. Hansen. 2017. Program evaluation and causal inference with high-dimensional data. Econometrica 85 (1): 233–298. https://doi.org/10.3982/ECTA12723.
Ben Kaabia, M., J.M. Gil and L. Boshnjaku. 2015. Modelling asymmetric price volatility transmission in the Spanish fresh-vegetable sector. Spanish Journal of Agricultural Research 13(1): e0110. https://doi.org/10.5424/sjar/2015131-5597.
Bera, A.K. and M.L. Higgins. 1993. ARCH models: properties, estimation and testing. Journal of Economic Surveys 7 (4): 305–366. https://doi.org/10.1111/j.1467-6419.1993.tb00170.x.
Bollerslev, T. 1986. Generalized autoregressive conditional heteroskedasticity. Journal of Econometrics 31(3): 307–327. https://doi.org/10.1016/0304-4076(86)90063-1.
Breiman, L. 2001. Random forests. Machine Learning 45 (1): 5–32. https://doi.org/10.1023/A:1010933404324.
Cabrera, B.L. and F. Schulz. 2016. Volatility linkages between energy and agricultural commodity prices. Energy Economics 54: 190–203. https://doi.org/10.1016/j.eneco.2015.11.018.
Cameron, A.C. and P.K. Trivedi. 2005. Microeconometrics: methods and applications. Cambridge University Press, Cambridge.
Cannas, M. and B. Arpino. 2019. A comparison of machine learning algorithms and covariate balance measures for propensity score matching and weighting. Biometrical Journal 61 (4): 1049–1072. https://doi.org/10.1002/bimj.201800132.
Cao, T.M., S.H. Lee and J.Y. Lee. 2023. The impact of natural disasters and pest infestations on technical efficiency in rice production: a study in Vietnam. Sustainability 15 (15): 11633. https://doi.org/10.3390/su151511633.
Capitanio, F., G. Rivieccio and F. Adinolfi. 2020. Food price volatility and asymmetries in rural areas of South Mediterranean countries: a copula-based GARCH model. International Journal of Environmental Research and Public Health 17 (16): 5855. https://doi.org/10.3390/ijerph17165855.
Carrer, M.J., H.M. de Souza Filho and M.O. Batalha. 2017. Factors influencing the adoption of Farm Management Information Systems (FMIS) by Brazilian citrus farmers. Computers and Electronics in Agriculture 138: 11–19. https://doi.org/10.1016/j.compag.2017.04.004.
Chavas, J.P. and M.T. Holt. 1993. Market instability and nonlinear dynamics. American Journal of Agricultural Economics 75 (1): 113–120. https://doi.org/10.2307/1242959
Chen, H., J. Xing, X. Yang and K. Zhan. 2021. Heterogeneous effects of health insurance on rural children’s health in China: a causal machine learning approach. International Journal of Environmental Research and Public Health 18 (18): 9616. https://doi.org/10.3390/ijerph18189616.
Chernozhukov, V., D. Chetverikov, M. Demirer, E. Duflo, C. Hansen, W. Newey and J. Robins. 2018. Double/debiased machine learning for treatment and structural parameters. The Econometrics Journal 21(1): C1–C68. https://doi.org/10.1111/ectj.12097.
Chernozhukov, V., M. Demirer, E. Duflo and I. Fernandez-Val. 2017. Generic machine learning inference on heterogeneous treatment effects in randomized experiments. NBER Working Paper 24678. https://doi.org/10.3386/w24678.
Cristea, D.S., S. Rosenberg, A.P. Mocanu, I.A. Simionov, A.A. Mogodan, S.M. Petrea and L.M. Moga. 2021. Modelling the common agricultural policy impact over the EU agricultural and rural environment through a machine learning predictive framework. Agronomy 11 (11): 2105. https://doi.org/10.3390/agronomy11112105.
D’Agostino Jr, R.B., R.B. D’Agostino Sr and D.B. Rubin. 2000. Estimating and using propensity scores with partially missing data. Journal of the American Statistical Association 95 (451): 749–759. https://doi.org/10.1080/01621459.2000.10474263.
De Gorter, H. and D.R. Just. 2010. The social costs and benefits of biofuels: the intersection of environmental, energy and agricultural policy. Applied Economic Perspectives and Policy 32 (1): 4–32. https://doi.org/10.1093/aepp/ppp010.
Diamond, A. and J.S. Sekhon. 2013. Genetic matching for estimating causal effects: a general multivariate matching method for achieving balance in observational studies. Review of Economics and Statistics 95 (3): 932–945. https://doi.org/10.1162/REST_a_00318.
Dinesh, D., L. Zeppenfeldt, P. Thornton and B. Campbell. 2024. Has process hijacked purpose? Outlook on food systems transformation in the global climate change processes. Outlook on Agriculture 53 (2): 98–105. https://doi.org/10.1177/00307270241238958.
Ebrahim, E.A. and A. Toy. 2024. Impact of irrigation participation on households food security in a rural area of Ethiopia: application of propensity score matching (PSM) method for causal inference. Frontiers in Sustainable Food Systems 8: 1403317. https://doi.org/10.3389/fsufs.2024.1403317.
Elijah Obayelu, A. 2011. Cross-countries analysis of rising food prices: policy responses and implications on emerging markets. International Journal of Emerging Markets 6 (3): 254–275. https://doi.org/10.1108/17468801111144076.
Enders, W. 2008. Applied econometric time series (3rd ed.). Wiley, Hoboken, NJ.
Engle, R.F. 2001. GARCH 101: the use of ARCH/GARCH models in applied econometrics. Journal of Economic Perspectives 15 (4): 157–168. https://doi.org/10.1257/jep.15.4.157.
FAO. 2019. The state of food and agriculture: climate change and food security. FAO, Rome.
FAO. 2023. The state of food and agriculture in Asia and the Pacific region. FAO, Bangkok.
Ferrer-Pérez, H. and P. Gracia-de-Rentería. 2020. Asymmetric price volatility transmission in the Spanish fresh wild fish supply chain. Marine Resource Economics 35 (1): 65–81. https://doi.org/10.1086/707786.
Fox, A.J. 1972. Outliers in time series. Journal of the Royal Statistical Society Series B: Statistical Methodology 34 (3): 350–363. https://doi.org/10.1111/j.2517-6161.1972.tb00912.x.
Friedman, J.H. 2001. Greedy function approximation: a gradient boosting machine. Annals of Statistics 29 5): 1189–1232. https://doi.org/10.1214/aos/1013203451.
Funk, M.J., D. Westreich, C. Wiesen, T. Stürmer, M.A. Brookhart and M. Davidian. 2011. Doubly robust estimation of causal effects. American Journal of Epidemiology 173(7): 761–767. https://doi.org/10.1093/aje/kwq439.
García-Barrón, S.E., G. Gonzalez-Hemon, E.J. Herrera López, R.P. Carmona-Escutia, D.A. Leyva-Trinidad and A.C. Gschaedler. 2025. Prediction of the consumption of a traditional fermented beverage via an expanded model of the theory of planned behaviour. British Food Journal 127 (7): 2381–2398. https://doi.org/10.1108/BFJ-07-2024-0724.
Gebbers, R. and V.I. Adamchuk. 2010. Precision agriculture and food security. Science 327 (5967): 828–831. https://doi.org/10.1126/science.1183899.
Ghysels, E., P. Santa–Clara and R. Valkanov. 2005. There is a risk–return trade–off after all. Journal of Financial Economics 76 (3): 509–548. https://doi.org/10.1016/j.jfineco.2004.03.008.
Glosten, L.R., R. Jagannathan and D.E. Runkle. 1993. On the relation between the expected value and the volatility of the nominal excess return on stocks. The Journal of Finance 48(5): 1779–1801. https://doi.org/10.1111/j.1540-6261.1993.tb05128.x.
Goller, D. and M. Lechner. 2020. Does the estimation of the propensity score by machine learning improve matching estimation? The case of Germany’s programmes for long term unemployed. Labor Economics 65: 101855. https://doi.org/10.1016/j.labeco.2020.101855.
Hair, J.F., W.C. Black, B.J. Babin and R.E. Anderson. 2019. Multivariate data analysis (8th ed.). Cengage Learning, Boston, MA.
Hill, J.L. 2011. Bayesian nonparametric modeling for causal inference. Journal of Computational and Graphical Statistics 20 (1): 217–240. https://doi.org/10.1198/jcgs.2010.08162.
Hirano, K. and G.W. Imbens. 2004. The propensity score with continuous treatments. In Applied Bayesian modeling and causal inference from incomplete–data perspectives. Wiley, Chichester.
Imai, K. and D.A. Van Dyk. 2004. Causal inference with general treatment regimes: generalizing the propensity score. Journal of the American Statistical Association 99 (467): 854–866. https://doi.org/10.1198/016214504000001187.
Imbens, G.W. 2000. The role of the propensity score in estimating dose–response functions. Biometrika 87 (3): 706–710. https://doi.org/10.1093/biomet/87.3.706.
Imbens, G.W. and D.B. Rubin. 2015. Causal inference in statistics, social and biomedical sciences. Cambridge University Press, Cambridge.
Imbens, G.W. and J.M. Wooldridge. 2009. Recent developments in the econometrics of program evaluation. Journal of Economic Literature 47 (1): 5–86. https://doi.org/10.1257/jel.47.1.5.
Jati, K. and G. Premaratne. 2017. Analysis of staple food price behaviour: multivariate BEKK–GARCH model. Journal of Asian Finance, Economics and Business 4 (4): 27–37. https://doi.org/10.13106/jafeb.2017.vol4.no4.27.
Kamble, S.S., A. Gunasekaran and R. Sharma. 2020. Modeling the blockchain enabled traceability in agriculture supply chain. International Journal of Information Management 52: 101967. https://doi.org/10.1016/j.ijinfomgt.2019.05.023.
Karanisa, T., Y. Achour, A. Ouammi and S. Sayadi. 2022. Smart greenhouses as the path towards precision agriculture in the food-energy and water nexus: case study of Qatar. Environment Systems and Decisions 42 (4): 521–546. https://doi.org/10.1007/s10669-022-09862-2.
Kayikci, Y., S. Demir, S.K. Mangla, N. Subramanian and B. Koc. 2022. Data-driven optimal dynamic pricing strategy for reducing perishable food waste at retailers. Journal of Cleaner Production 344: 131068. https://doi.org/10.1016/j.jclepro.2022.131068.
Kreif, N., K. DiazOrdaz, R. Moreno–Serra, A. Mirelman, T. Hidayat and M. Suhrcke. 2022. Estimating heterogeneous policy impacts using causal machine learning: a case study of health insurance reform in Indonesia. Health Services and Outcomes Research Methodology 22: 192–227. https://doi.org/10.1007/s10742-021-00259-3.
Lai, L.H. 2016. Dynamic modelling in loss frequency and severity estimated: evidence from the agricultural rice loss due to typhoons in Taiwan. Agricultural Economics/Zemědělská Ekonomika 62 (3): 116–125. https://doi.org/10.17221/183/2015-AGRICECON.
Lee, B.K., J. Lessler and E.A. Stuart. 2010. Improving propensity score weighting using machine learning. Statistics in Medicine 29 (3): 337–346. https://doi.org/10.1002/sim.3782.
Li, N., A. Ker, A.G. Sam and S. Aradhyula. 2017. Modeling regime-dependent agricultural commodity price volatilities. Agricultural Economics 48 (6): 683–691. https://doi.org/10.1111/agec.12366.
Liu, H., J. Zhang, C. Zhou and Y. Ru. 2018. Optimal purchase and inventory retrieval policies for perishable seasonal agricultural products. Omega 79: 133–145. https://doi.org/10.1016/j.omega.2017.08.006.
Lourenço, L., L. Weber, L. Garcia, V. Ramos and J. Souza. 2024. Machine learning algorithms to estimate propensity scores in health policy evaluation: a scoping review. International Journal of Environmental Research and Public Health 21 (11): 1484. https://doi.org/10.3390/ijerph21111484.
Luo, W. and R. Liu. 2011. Analysis of meat price volatility in China. China Agricultural Economic Review 3 (3): 402–411. https://doi.org/10.1108/17561371111165798.
MAFRA. 2023. Smart farm innovation valley development plan: 2014–2024 progress report. Ministry of Agriculture, Food and Rural Affairs, Seoul.
Mambile, C. and F. Ishengoma. 2024. Exploring the non–linear trajectories of technology adoption in the digital age. Technological Sustainability 3 (4): 428–448. https://doi.org/10.1108/TECHS-10-2023-0041.
Mariyono, J., A. Kuntariningsih, E. Suswati and T. Kompas. 2018. Quantity and monetary value of agrochemical pollution from intensive farming in Indonesia. Management of Environmental Quality: An International Journal 29 (4): 759–779. https://doi.org/10.1108/MEQ-03-2017-0030.
McCaffrey, D.F., B.A. Griffin, D. Almirall, M.E. Slaughter, R. Ramchand and L.F. Burgette. 2013. A tutorial on propensity score estimation for multiple treatments using generalized boosted models. Statistics in Medicine 32 (19): 3388–3414. https://doi.org/10.1002/sim.5753.
Mitra, D. and R.K. Paul. 2017. Hybrid time–series models for forecasting agricultural commodity prices. Model Assisted Statistics and Applications 12 (3): 255–264. https://doi.org/10.3233/MAS-170400.
Mohapatra, S., R.E. Goodhue, C.A. Carter and J.A. Chalfant. 2010. Effects of forward sales on spot markets: pre–commitment sales and prices for fresh strawberries. American Journal of Agricultural Economics 92(1): 152–163. https://doi.org/10.1093/ajae/aap020.
Özdil, O. 2025. A multi–period model for assessing the reinforcing dependence between climate transition and physical risks of non–life insurers. The Journal of Risk Finance 26 (1): 98–121. https://doi.org/10.1108/JRF-04-2024-0121.
Pirracchio, R., M.L. Petersen and M. Van der Laan. 2015. Improving propensity score estimators’ robustness to model misspecification using super learner. American Journal of Epidemiology 181(2): 108–119. https://doi.org/10.1093/aje/kwu253.
Rezitis, A.N. and D.N. Pachis. 2020. Investigating the price volatility transmission mechanisms of selected fresh vegetable chains in Greece. Journal of Agribusiness in Developing and Emerging Economies 10 (5): 587–611. https://doi.org/10.1108/JADEE-11-2019-0194.
Richter, I., N.E. Neef, A. Moghayedi, F.M. Owoade, K. Kapanji-Kakoma, F. Sheena and K. Ewon. 2023. Willing to be the change: perceived drivers and barriers to participation in urban smart farming projects. Journal of Urban Affairs 45 (8): 1547–1565. https://doi.org/10.1080/07352166.2021.2008037.
Ringim, S.H., A. Alhassan, H. Güngör and F.V. Bekun. 2022. Economic policy uncertainty and energy prices: empirical evidence from multivariate DCC-GARCH models. Energies 15(10): 3712. https://doi.org/10.3390/en15103712.
Rojo–Gimeno, C., M. Van der Voort, J.K. Niemi, L. Lauwers, A.R. Kristensen and E. Wauters. 2019. Assessment of the value of information of precision livestock farming: a conceptual framework. NJAS Wageningen Journal of Life Sciences 90: 100311. https://doi.org/10.1016/j.njas.2019.100311.
Rosenbaum, P.R. 2002. Observational studies. Springer, New York, NY.
Rosenbaum, P.R. and D.B. Rubin. 1983. The central role of the propensity score in observational studies for causal effects. Biometrika 70 (1): 41–55. https://doi.org/10.1093/biomet/70.1.41.
Saint–Cyr, L.D. 2022. Heterogeneous farm-size dynamics and impacts of subsidies from agricultural policy: evidence from France. Journal of Agricultural Economics 73 (3): 893–923. https://doi.org/10.1111/1477-9552.12478.
Salter, A.J. and B.R. Martin. 2001. The economic benefits of publicly funded basic research: a critical review. Research Policy 30 (3): 509–532. https://doi.org/10.1016/S0048-7333(00)00091-3.
Sanyal, P., L.A. Malczynski and P. Kaplan. 2015. Impact of energy price variability on global fertilizer price: application of alternative volatility models. Sustainable Agriculture Research 4 (4): 132–147. https://doi.org/10.5539/sar.v4n4p132
Scherer, L. and P.H. Verburg. 2017. Mapping and linking supply- and demand-side measures in climate-smart agriculture: a review. Agronomy for Sustainable Development 37 (6): 66. https://doi.org/10.1007/s13593-017-0475-1.
Setoguchi, S., S. Schneeweiss, M.A. Brookhart, R.J. Glynn and E.F. Cook. 2008. Evaluating uses of data mining techniques in propensity score estimation: a simulation study. Pharmacoepidemiology and Drug Safety 17 (6): 546–555. https://doi.org/10.1002/pds.1555.
Shadish, W.R., T.D. Cook and D.T. Campbell. 2002. Experimental and quasi–experimental designs for generalized causal inference. Houghton Mifflin, Boston, MA.
Shukla, S., R. Kapoor, N. Gupta, J.A. Garza-Reyes and V. Kumar. 2023. Role of information and communication technology in mitigating risks in Indian agricultural supply chains. Supply Chain Management 28 (3): 544–558. https://doi.org/10.1108/SCM-08-2021-0386.
Singh, A., S. Jha, B. Majumdar, M. Roy, S. Sarkar and A. Ghorai. 2019. Impacts of climate smart jute farming on resource use efficiency, productivity and economic benefits in rural Eastern India. Outlook on Agriculture 48 (1): 75–82. https://doi.org/10.1177/0030727018807124.
Sonka, S. 2014. Big data and the ag sector: more than lots of numbers. International Food and Agribusiness Management Review 17 (1): 1–20.
Sridhar, A., A. Balakrishnan, M.M. Jacob, M. Sillanpää and N. Dayanandan. 2023. Global impact of COVID-19 on agriculture: role of sustainable agriculture and digital farming. Environmental Science and Pollution Research 30 (15): 42509–42525. https://doi.org/10.1007/s11356-022-19358-w.
Stuart, E.A. 2010. Matching methods for causal inference: a review and a look forward. Statistical Science 25 (1): 1–21. https://doi.org/10.1214/09-STS313.
Sumner, D.A., J.M. Alston and J.W. Glauber. 2010. Evolution of the economics of agricultural policy. American Journal of Agricultural Economics 92 (2): 403–423. https://doi.org/10.1093/ajae/aaq015.
Swinnen, J. and J. McDermott. 2020. COVID-19 and global food security. EuroChoices 19 (3): 26–33. https://doi.org/10.1111/1746-692X.12288.
Tripathi, P.K., C.K. Singh, R. Singh and A.K. Deshmukh. 2023. A farmer–centric agricultural decision support system for market dynamics in a volatile agricultural supply chain. Benchmarking 30 (10): 3925–3952. https://doi.org/10.1108/BIJ-12-2021-0745.
Tsay, R.S. 1988. Outliers, level shifts and variance changes in time series. Journal of Forecasting 7 (1): 1–20. https://doi.org/10.1002/for.3980070102.
Van der Laan, M.J. and S. Rose. 2011. Targeted learning: causal inference for observational and experimental data. Springer, New York, NY.
Van der Laan, M.J., E.C. Polley and A.E. Hubbard. 2007. Super learner. Statistical Applications in Genetics and Molecular Biology 6: 25. https://doi.org/10.2202/1544-6115.1309.
Van Gerrewey, T., N. Boon and D. Geelen. 2021. Vertical farming: the only way is up? Agronomy 12 (1): 2. https://doi.org/10.3390/agronomy12010002.
Vegetabile, B.G., B.A. Griffin, D.L. Coffman, M. Cefalu, M.W. Robbins and D.F. McCaffrey. 2021. Nonparametric estimation of population average dose–response curves using entropy balancing weights for continuous treatments. Health Services and Outcomes Research Methodology 21 (1): 69–110. https://doi.org/10.1007/s10742-020-00236-2.
Wager, S. and S. Athey. 2018. Estimation and inference of heterogeneous treatment effects using random forests. Journal of the American Statistical Association 113 (523): 1228–1242. https://doi.org/10.1080/01621459.2017.1319839.
Westreich, D., J. Lessler and M.J. Funk. 2010. Propensity score estimation: neural networks, support vector machines, decision trees (CART) and meta–classifiers as alternatives to logistic regression. Journal of Clinical Epidemiology 63 (8): 826–833. https://doi.org/10.1016/j.jclinepi.2009.11.020.
Wolfert, S., L. Ge, C. Verdouw and M.J. Bogaardt. 2017. Big data in smart farming–a review. Agricultural Systems 153: 69–80. https://doi.org/10.1016/j.agsy.2017.01.023.
Wooldridge, J.M. 2010. Econometric analysis of cross section and panel data. MIT Press, Cambridge, MA.
Zhang, T., M. Yu, Y. Song and J. Liu. 2025. Heterogeneous effects of decreasing the cost–sharing for outpatient care on health outcomes in China: a propensity score matching and causal machine learning approach. International Journal of Health Planning and Management 40 (1): 174–193. https://doi.org/10.1002/hpm.3938.
Zuba–Ciszewska, M., A. Kowalska, L. Manning and A. Brodziak. 2019. Organic milk supply in Poland: market and policy developments. British Food Journal 121(12): 3396–3412. https://doi.org/10.1108/BFJ-11-2018-0750.
Appendix
Summary of key assumptions and robustness checks
Citation: International Food and Agribusiness Management Review 2026; 10.22434/ifamr.1364
Corresponding author


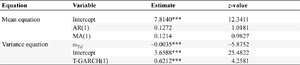


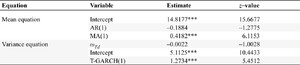


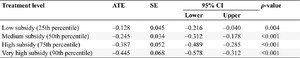


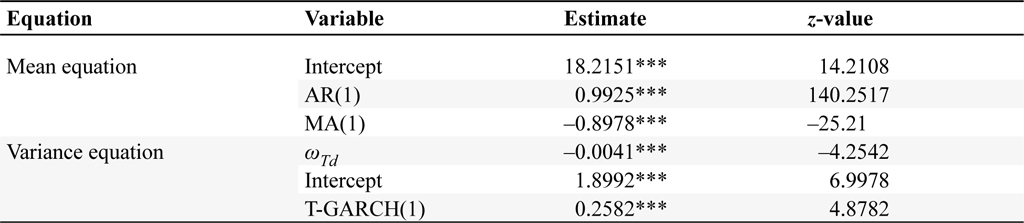