Abstract
This paper explores coverage selection strategies for the Annual Forage insurance program using robust portfolio optimization approaches, such as shrinkage and ensemble learning methods. The objective of the proposed models is to obtain an expected return with the lowest risk possible. Compared to previous efforts, a wider range of coverage selection parameters (i.e., coverage level, productivity factor, and index intervals) is considered. The proposed methods are used to protect cool-season forage production in Texas, using historical market, production, and actuarial data. This work provides empirical evidence on the effectiveness of the Annual Forage program in managing forage production risks.
1. Introduction
The rise in climate risk in recent years has increased the offer of weather insurance in both developed and developing countries (Clement et al., 2018). These climate-related crop insurance programs commonly use weather indicators, such as rainfall or satellite-sensed indexes, to compensate farmers for their losses without measuring actual production (Carter et al., 2017; Clement et al., 2018; Miranda and Farrin, 2012; Singh and Agrawal, 2019; Tadesse et al., 2015). In the USA, rainfall index insurance available to forage producers include the Pasture, Rangeland, Forage (PRF) and Annual Forage programs. For instance, in 2023, Annual Forage insurance was available in 8 states and 7.20 million acres participated in the program (USDA RMA, 2024a). Like other weather index insurance, the Annual Forage may be subject to basis risk and the indemnity farmers receive depends solely on their coverage selection. Therefore, appropriate selection of coverage is necessary to effectively mitigate the risk of limited precipitation. Unfortunately, compared to the PRF program, less attention has been paid to developing robust coverage selection strategies for the Annual Forage program (Cho and Brorsen, 2021; Zapata and García, 2022; Zapata et al., 2024).
In this study, we introduce and evaluate four coverage selection strategies for the Annual Forage program. The proposed strategies are based on portfolio analysis in combination with shrinkage and ensemble learning methods (Zapata et al., 2024). Forage yields are incorporated into the selection process to derive risk-efficient coverages aimed at stabilizing farmers’ returns around target levels. The proposed coverage selection strategies are illustrated in an empirical application related to cool-season forage production in Texas.
The analysis of the Annual Forage program has been limited in scope, with only a handful of studies thoroughly examining its effectiveness in reducing the risk of forage loss due to lack of rainfall. Previous studies have evaluated the performance of selected coverages, but often considered a narrow range of options; therefore, failing to explore the full spectrum of choices available to producers (Graff et al., 2021, 2023; Maples et al., 2016; ShalekBriski et al., 2020). A restricted selection could lead to suboptimal coverage and limit its applicability in risk management. On the other hand, a more systematic approach has been implemented in the PRF program to identify optimal coverage. Particularly, Diersen et al. (2015), Cho and Brosen (2021), Zapata and García (2022) and Zapata et al. (2024) used optimization techniques to explore a broader range of coverage alternatives and develop more robust decision-making frameworks. However, similar analytical coverage selection strategies have not been explored for the Annual Forage.
Although both the PRF and Annual Forage programs are based on the same rainfall index and both use the same coverage design, there are some differences between the two programs that are relevant to coverage selection. Specifically, a reduced number of index intervals is available in the Annual Forage, which makes indemnity payments more sensitive to coverage choices and may reduce the applicability of some existing coverage selection methods. Hence the need exists to identify tailored and valid coverages for the Annual Forage program. We adapted and evaluated different coverage selection strategies originally developed for the PRF insurance program to the Annual Forage settings (Zapata et al., 2024). Compared to Zapata et al. (2024), we present a more realistic application of rainfall index insurance, considering both expected farm sales and indemnities in coverage selection decisions. Including farm sales in the analysis allowed us to explore and evaluate the intrinsic basis risk of the Annual Forage program, as well as its potential to be used as a comprehensive risk management tool, rather than simply as a mechanism to maximize indemnity payments. Therefore, this study represents one of the first attempts to develop comprehensive coverage selection strategies for the Annual Forage program. Our study implements an optimization procedure that incorporates statistical learning methods to enhance our understanding and utility of the Annual Forage insurance in managing forage production risks.
The following section provides a brief description of the Annual Forage design and compensation mechanism. Then, we present the different coverage selection strategies and how to use them to secure a target return. We proceed to illustrate the proposed methods in a case of cool-season forage production in Texas. Here we describe the production, market, and actuarial data used to estimate, tune, and test the different models. Lastly, we use the empirical results to contrast the performance of the different coverage selection strategies and derive our final conclusions.
2. Annual Forage program
The Annual Forage is a rainfall index-based crop insurance program. The program uses a coordinate grid system and a rainfall index, where the indemnities received by farmers depend on the realizations of the rainfall index on the grid where their operation is located1 (USDA RMA, 2024b). The rainfall index is reported for 12 overlapping 2-month index intervals (i.e., January–February, February–March, …, December–January) and the size of each grid is 0.25 degrees in latitude by 0.25 degrees in longitude (about 17 by 17 miles).
Coverage is defined by the selection of the productivity factor (

Citation: International Food and Agribusiness Management Review 2026; 10.22434/ifamr.1251
which is allocated among the index intervals by the distribution of the percent of value. For instance, the liability assigned to the jth index interval is wj
The available insurable index intervals also depend on the forage planting date. Currently, the six index intervals after the planting month are available. For example, in Texas, cool-season forage crops planted in September can be covered by distributing the percent of value among the following six index intervals: October–November, November–December, December–January, January–February, February–March, and March–April. Thus, there are 4 possible valid combinations of three non-adjacent index intervals to be considered. Also, a maximum percent of value of 40% can be assigned to a particular index interval, setting the practical minimum percent of value to 20%.
The indemnity received is determined by the chosen coverage and subsequent rainfall index realizations. Particularly, an indemnity payment is triggered when the rainfall index (I) of the selected index intervals falls below the chosen coverage level. The indemnity payment rate, max  , is proportional to the difference between the selected coverage level and the observed rainfall index, where Ij is the rainfall index of the jth index interval. Each Ij has a historical mean of approximately 100 and past index realizations are updated each year to maintain their constant expected value.
Different premium and subsidy rates are associated with the available index intervals and coverage levels. For example, each index interval has a unique premium rate (
Citation: International Food and Agribusiness Management Review 2026; 10.22434/ifamr.1251
Therefore, the net indemnity received by farmers can be represented as a weighted sum of the net index interval indemnity payments (rj), with weights given by the percent of value:
Citation: International Food and Agribusiness Management Review 2026; 10.22434/ifamr.1251
3. Coverage selection
The Annual Forage insurance program is designed to compensate producers for potential forage losses caused by the lack of precipitation. However, the program does not consider actual forage production or rainfall received. As described above, the indemnity received depends solely on the realizations of the rainfall index and the selected coverage. However, policyholders can tailor their coverage selections to meet their economic goals. In this study, we propose and evaluate different coverage selection strategies based on robust portfolio optimization methods.
3.1 Target returns
We assume that a risk-averse forage producer would prefer the least risky option among several alternatives that yield the same expected return. By participating in the Annual Forage, producers can protect a portion of the value of their crop while reducing the variability of their returns. Consider the net farm sales (
We further assume that the target expected return is equal to the expected value of forage under favorable precipitation conditions (
Citation: International Food and Agribusiness Management Review 2026; 10.22434/ifamr.1251
where E(
Again, the goal of a risk-averse producer is to choose a coverage with an expected net indemnity of E(R) that minimizes the variance of the net farm income, which is given by
Citation: International Food and Agribusiness Management Review 2026; 10.22434/ifamr.1251
where is the variance of the net farm sales,
3.2 Portfolio-based strategies
Portfolio optimization methods have been used to develop risk-efficient coverages for rainfall index-based insurances such as the Pasture, Rangeland Forage (PRF) program (Zapata and García, 2022; Zapata et al., 2024). In this study, we adapted and evaluated different coverage selection strategies to the specifications of the Annual Forage insurance program. Compared to Zapata et al. (2024), we incorporated net farm sales into the selection process, presenting a more realistic application of robust portfolio analysis. Overall, the objective of portfolio-based coverage selection strategies is to obtain an expected net farm income at the lowest risk possible, where risk is commonly measured by the corresponding variance or standard deviation of the coverage’s returns.
The mean-variance (MV) approach is a common specification of the coverage selection problem (Diersen et al., 2015; Jimenez Maldonado, 2011; Zapata and García, 2022; Zapata et al., 2024). It is an intuitive strategy that relies on observed sample moments to identify optimal coverage, but might underperform in real out-of-sample circumstances. However, the MV selection strategy can be adjusted to improve its out-of-sample performance. For this aim, we considered two general alternative specifications based on shrinkage and ensemble learning techniques. The shrinkage approach represents a penalized selection of the coverage parameters to produce a more stable coverage. On the other hand, ensemble procedures are based on random subspace methods to generate and combine multiple coverages for a more robust selection.
Mean-variance approach
The objective of the MV coverage selection strategy is to identify a coverage that minimizes the variance of net farm income subject to achieving the target return. Namely, the MV coverage selection problem can be represented as (Zapata and García, 2022):
Citation: International Food and Agribusiness Management Review 2026; 10.22434/ifamr.1251
where w is a vector containing the distribution of the percent of value (w1, w2, … , w6), and d is the corresponding vector of indicator variables, such that dj equals one if the jth index interval is selected (i.e., wj > 0 ), and zero otherwise. The above V(
Penalized selection
In the penalized coverage selection (PS), a regularization is added to the MV objective function to have a more uniform distribution of the percent of value among the available index intervals. A more even allocation of the percent of value could result in more stable coverage, as the effect of less representative rainfall index realizations on coverage selection decisions is lessened.
A penalization is added to the MV formulation in equation 6 such that the regularized objective function is given by , where
Random subspace methods
Coverage selection strategies based on random subspace methods generate an assembled coverage by combining multiple coverage alternatives. Two ensemble strategies are adapted to the context of the Annual Forage program, bagging selection (BS) and random subset selection (RSS). BS uses bootstrapping techniques to create random samples in which optimal coverages are identified and then compounded into a single selection (Zapata et al., 2024). Like the BS strategy, RSS generates aleatory subsets, but the search space for the optimal coverage at each subsample is also a random subset of all possible combinations of the selection parameters (Zapata et al., 2024).
The assembled coverages derived from diverse selections are expected to produce more stable returns. To obtain heterogeneous coverage options, random subsamples are created by bootstrapping the historical rainfall indexes and the set of valid combinations of coverage level, productivity factor, and index intervals. Past rainfall indexes are represented by the set
Optimal coverage of the BS strategy is derived by sampling the set
Citation: International Food and Agribusiness Management Review 2026; 10.22434/ifamr.1251
where  is the average of the sampled rainfall indexes from the jth index interval at the bth bootstrap iteration. Once the rainfall indexes are calibrated, optimal coverage is derived using the MV approach described above for each bootstrap sample considering all the valid combinations of the selection parameters in
The individual coverage selections from the bootstrap samples (w*b, b = 1, … , B) are then combined to derive an assembled coverage. This merged coverage must comply with the Annual Forage coverage selection restrictions. To this aim, the following aggregation rule is used for both the BS and RSS strategies. Selected coverage levels and productivity factors from the B bootstrap samples are combined by computing their means, which are rounded to the nearest valid levels. In the case of the distribution of the percent of value, the individual sample allocations are aggregated in a manner that minimizes the sum of squared differences between the percent of value of the bootstrap coverages and the assembled coverage, subject to satisfying all allocation restrictions. Namely, the random subspace allocation of the percent of value (wbag) is the solution to
Citation: International Food and Agribusiness Management Review 2026; 10.22434/ifamr.1251
where  is the optimal percent of value for the jth index interval in the bth bootstrap sample.
4. An application to cool-season forage in Texas
The different coverage selection strategies considered in this study were used to derive coverage for cool-season forage production. We considered forage wheat varieties adapted to South Texas growing conditions to calculate expected hay yields under different weather scenarios, and the Annual Forage coverage was tailored to compensate for potential forage losses caused by limited precipitation. The coverages proposed by each of the selection methods were estimated, tuned, and evaluated using historical actuarial information, forage yields, hay prices, and production costs.
4.1 Production and market data
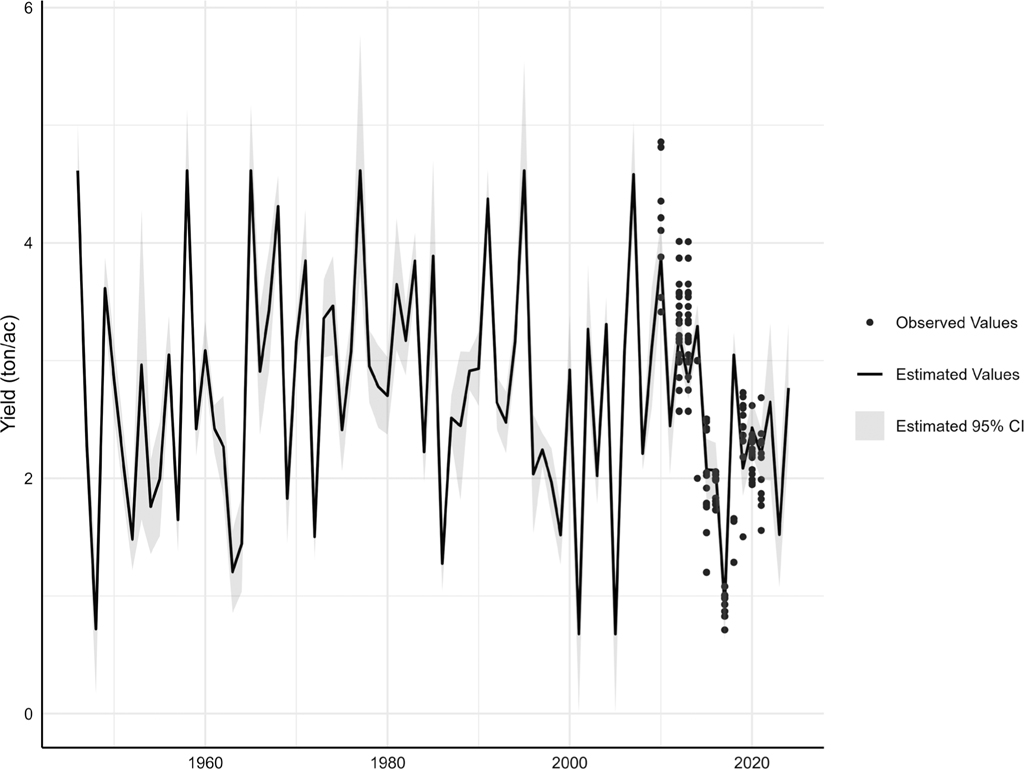
Texas is the largest cattle producer in the USA (USDA NASS, 2024). However, data on the state’s forage production is scarce. Due to the lack of publicly available historical records at the farm or county levels, the proposed coverage selection strategies were illustrated using cool-season forage variety trial results. Forage wheat yield data were compiled from Texas A&M AgriLife’s cool-season annual forage variety trial reports for the South Texas demonstration site (i.e., College Station) (Texas A&M AgriLife, 2022). Variety trial data are available from 2010 to 2021, and the recorded yields (dry ton/ac) are presented in Figure 1. Forage yields were estimated by clipping and weighing the production of each plot during the growing season. Forage wheat varieties were planted in late September and early October each year and were grown under similar irrigation and fertilization regimes. Different varieties were planted over the years, but all exhibited the same yield trends. Therefore, we selected a set of varieties that remained relatively constant throughout the evaluation period. The observed forage wheat yields were used to project forage yields for the period of available rainfall indexes (i.e., 1949–2024). Therefore, the predicted yields represent potential forage yields of existing forage wheat varieties under past growing conditions.
In consultation with local forage specialists, forage yield was assumed to be a function of minimum temperatures and drought conditions during the growing season, which runs from late September to March. To estimate a functional form for the conditional expected yield, observed forage yields were regressed on the corresponding minimum temperatures and Palmer Z index (a monthly measure of short-term drought) for Brazos County reported by NOAA NCEI (2024). To reduce the correlation between the explanatory variables, both monthly minimum temperatures and the Palmer Z index were grouped into periods with similar effects (i.e., October, November to December, and January to March).
Ordinary Least Squares (OLS), Ridge and Lasso regression methods were evaluated to identify the model specification with the best out-of-sample performance in predicting yield. Models’ performance was measured by the mean squared error3 (MSE). An 80/20 train-test split was used, with 80% of the data used to fit each yield model and the remaining 20% used to test it. The train-test process was repeated 1000 times using different random samples to reduce possible sampling effects. The OLS approach yielded the lowest MSE among the three estimation alternatives and it was used to estimate the conditional expected yield function. The entire dataset of observed yields and weather conditions was then used to estimate and project forage wheat yields from 1949 to 2024. The estimated OLS yield regression parameters are presented in Table 1 and the estimated yields in Figure 1.
Observed and estimated forage wheat yields used to calculate farm sales. CI, confidence interval.
Citation: International Food and Agribusiness Management Review 2026; 10.22434/ifamr.1251
Estimated forage yield coefficients.
Citation: International Food and Agribusiness Management Review 2026; 10.22434/ifamr.1251
Projected yields along with corresponding forage prices and cost of production were used to calculate the expected net farm sales. Namely, historical Texas hay prices were obtained from USDA NASS (2024) and the production costs were adapted from the Coastal Bend region dryland wheat enterprise budget developed by Texas A&M AgriLife Extension (2024). In 2024, the variable cost, which consists of cutting and baling the hay, was estimated at $72.92 per ton and all other production expenses totaled $202.84 per acre. The Price Paid Index for Commodities, Services, Interest, Taxes, and Wage Rates (PPITW) (USDA NASS, 2024) was used to generate cost estimates for the years 2017 through 2023, with 2024 production costs as baseline. Past hay prices and deflated costs were used as observed values during the training and evaluation of the coverage selection models and are presented in Table 2.
Realized and expected hay yields, prices, costs, and returns, 2017–2024.
Citation: International Food and Agribusiness Management Review 2026; 10.22434/ifamr.1251
4.2 Actuarial data
The different coverage selection strategies were evaluated using the actuarial data from Grid 12735 located in Brazos County, TX, USA, where the forage variety trials were conducted. Although our empirical application focused on a specific grid in Texas, our data-driven methods are valid and can be directly extended to all participating regions and grids nationwide. By focusing on a single location, we were able to conduct a detailed analysis of the optimal coverages and contrast the different solutions in terms of indemnity payments and related risk. However, given the vast and diverse agroecosystems covered by the Annual Forages program, the coverages identified for Grid 12735 may not be directly extrapolated to other locations.
The rainfall indexes (i.e., 1949–2024) for the year 2024 were downloaded from the USDA RMA (2024c) decision support tool. As mentioned above, the rainfall indexes are adjusted each year to incorporate the latest realizations of the index and reset their average values around 100. For example, the historical rainfall indexes from 1949 to 2023 reported in 2024 have a mean close to 100. Unfortunately, only the most recent historical values of the rainfall index (i.e., adjusted for 2023) are publicly available. We used a recursive rescaling process to recover the corresponding “to-date” historical rainfall indexes for years prior to 2023. Namely, the rainfall index of the jth index interval for year i adjusted to reference year
Citation: International Food and Agribusiness Management Review 2026; 10.22434/ifamr.1251
In this way we recovered the set of historical rainfall indexes adjusted to each past year of interest (i.e.,
Also, corresponding county base values, premium rates, and subsidy factors, as well as the actual realization of the rainfall index for years 2017 through 2024 were obtained from the USDA RMA (2024d) actuarial information repository. This actuarial information was used to evaluate the performance of the coverage selection strategies by comparing projected returns with actual realizations during the testing phase. It is worth mentioning that for the 2024 coverage, the index intervals available to producers changed depending on the planting date. Before 2024, four 6-month growing seasons covered by 6 index intervals were available. Currently, protection is available for the following 6 months after planting. Therefore, in our empirical application, where the forage is assumed to be planted in September and harvested in March, the first growing season (i.e., September to March) was selected for years prior to 2024 and the default available index intervals to choose for 2024 were October–November, November–December, December–January, January–February, February–March and March–April. The distribution of the rainfall indexes of interest of Grid 12735 are presented in Figure 2.
Historical distribution of rainfall index by index interval for Grid 12375, 1949–2024.
Citation: International Food and Agribusiness Management Review 2026; 10.22434/ifamr.1251
4.3 Return and loss expectations
As described above, we consider that farmers make their coverage selection decisions based on their expectations about future returns and weather-related losses. Therefore, their expectations about coming forage yields, prices, and cost of production are incorporated into the selection process. In the absence of complete historical data, a pragmatic approach was followed to derive farmers’ production and market expectations. First, we assumed that each year farmers would want to secure a return equivalent to the expected return under favorable growing conditions. In our study, this optimistic return is represented by the net farm sales associated with an expected yield above the mean, produced and sold at expected hay costs and prices, respectively. To achieve this target return, a farmer could protect the expected loss caused by limited precipitation (i.e., E(R) in equation 4) by participating in the Annual Forage program.
Policyholders make their coverage selection decisions before planting with the information available at that time. Therefore, to emulate the farmers’ decision process, expected future yields, prices, and costs were updated each year by incorporating new outcomes. For a given year, the expected yield represents the average of all previous yields, excluding the one for the year being covered. All past observations are considered as the estimated yields characterized potential realizations of current forage wheat varieties (Figure 1). An optimistic expected yield is also estimated to calculate the target return. This optimistic yield only considers those past yields that are higher than the expected yield. On the other hand, price expectations are represented by a forecasted hay price using a first-order differencing specification with 2 lags. Different price regression models were trained using historical data from 1949 to 2016 and the specification that best fit the data was selected using the Akaike information criteria. Like expected yield calculations, the price forecasting model considers all past observations prior to the year of interest. Lastly, cost expectations for the coming year are given by the most recent cost estimates at the time (i.e., previous year values). Expected hay price, yield and cost of production are also included in Table 2.
We further assumed that farmers’ forage yields and the market hay price and custom harvesting costs (i.e., cutting and baling) are independent. Therefore, the expected value of the net farm sales is given by:
Citation: International Food and Agribusiness Management Review 2026; 10.22434/ifamr.1251
where p is the hay price, y is the forage yield, h is the custom harvesting cost rate, and c represents all other costs. Similarly, the target return is equal to E(
4.4 Estimation, Tuning and Testing of Coverage Selection Models
A recursive training set was used to estimate the different coverage selection models. Particularly, annual coverage selections were derived for years 2017 through 2024, the period in which the Annual Forage insurance program has been used successively at the location of the study (USDA RMA, 2024a). For each year under consideration, the optimal coverage to attain the target return was identified using the expected forage yield, hay price and costs of production for that year, as well as its corresponding county base value, premium rates, subsidy factor, and the adjusted rainfall indexes (i.e., Iji,
The tuning parameter (
The optimal value of the hyperparameters was obtained by calculating the MSE between the observed and expected net farm income in the validation set for each
As in the validation set, the net farm income associated with the proposed coverages for the years 2017 to 2014 were compared with the actual realizations using the MSE. As illustrated in Table 2, significant differences were observed in forage yields, prices, and costs during the testing period. Particularly, producers experienced volatile yields and rising hay prices and production costs. In addition to the proposed coverage selection strategies, a Naïve coverage was evaluated as reference. This Naïve coverage consists of allocating 1/3 of the percent of value to the first, third, and fifth available index intervals and selecting a coverage level of 90% and a productivity factor of 150%. Similar Naïve strategies have been evaluated in previous applications (Graff et al., 2021, 2023). Note that the Naïve strategy is a special case of the PS model in which it is possible to assign an equal percent of value to each of the selected index intervals (minimizing the penalization) to obtain the target compensation. However, the Naïve coverage is not entirely comparable with the proposed methods since it targets a fixed return, in this case different from the return sought by the other selection methods. Also, average payouts for Grid 12735 are reviewed to illustrate the actual indemnity payments received by farmers (USDA RMA, 2024a).
4.5 Results
The performance of the four proposed coverage selection models, mean-variance (MV), penalized selection (PS), bagging selection (BS), and random subset selection (RSS), was evaluated in protecting expected forage wheat returns during 2017 to 2024 in Grid 12735 of Texas. The optimal coverages proposed for each model are presented in Table 3. These coverages were intended to obtain the expected net indemnity and net farm income for each year in Table 4 and were derived using actuarial information related to each year. The expected indemnity payments needed to achieve the target returns in Table 2 for the years 2020, 2021, 2022 and 2024 were outside the feasible range. Therefore, for these years, we used the 95th percentile of the expected payouts as a proxy for expected indemnities. Note that the expected indemnity from the Naïve model is higher than the corresponding 95th percentile levels, making it a riskier alternative.
In general, the suggested coverages by the MV and PS strategies were more similar to each other and different than the counterpart selections obtained from the BS and RSS models (Table 3). All models chose a 90% coverage level in all years evaluated. Furthermore, and as designed in the Annual Forage program, the productivity factor was the main parameter used to adjust the forage value to be protected. Particularly, the productivity factor increased with the target indemnity. Relatively higher productivity factors were selected between 2020 and 2024, when higher indemnities were sought. In terms of model selections, the RSS chose the highest productivity factors and the BS the lowest.
Optimal coverage by model, 2017–2024.
Citation: International Food and Agribusiness Management Review 2026; 10.22434/ifamr.1251
Regarding the allocation of the percent of value, three index intervals were always selected to meet the program restrictions (Table 3). The most frequently chosen index intervals were September–October, December–January, and February–March. On the other hand, the least frequently selected index intervals were November–December and January–February. Interestingly, the first available index interval was always chosen, September–October for 2017 to 2013 and October–November for 2024. Also, the MV and PS models, as well as the BS and RSS methods, always chose the same index intervals. For instance, the BS and RSS strategies selected the September–October, December–January, and February–March index intervals from 2017 to 2023. Therefore, it may be appropriate for the Annual Forage program to re-evaluate the number of index intervals available to simplify the coverage selection process. Among the selected index intervals, except for 2024, a higher and similar percent of value was allocated to the outer index intervals and a relatively small share to the inner index interval. This distribution pattern was consistent across all coverage selection strategies. On average, a relatively higher percent of value was assigned to the index intervals of September–October, January–February, and February–March. In general, for a given year, similar coverages were suggested between related models, i.e., between ensemble learning-based strategies (BS and RSS) and between the PS and MV models. However, more diverse coverages were identified by each model over time as target returns were dynamically updated. Moreover, the similarities between the coverage selections of the MV and PS models suggest that the penalty imposed on the PS strategy had a modest effect on the percent of value allocation. Nonetheless, the distribution of the percent of value of the PS strategy resulted in the allocation with the lowest variance among the selected wj variables. Overall, the observed distributions of the percent of value highlight the importance of selecting the right index intervals to stabilize farm returns as illustrated in Tables 4 and 5.
Realized, Expected, and Actual Returns, 2017–2024.
Citation: International Food and Agribusiness Management Review 2026; 10.22434/ifamr.1251
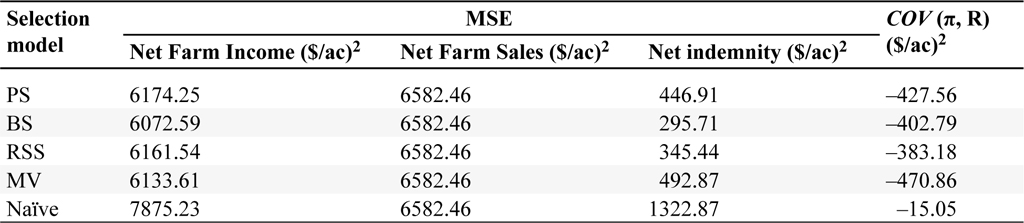
Out-of-sample mean squared error (MSE) results
Citation: International Food and Agribusiness Management Review 2026; 10.22434/ifamr.1251
The coverage selections in Table 3 were evaluated using the out-of-sample forage yield and hay price, and actuarial information and rainfall indexes reported for each year. The resulting net indemnities and net farm income from each of the proposed coverages are presented in Table 4. It should be noted that the returns reported in Table 4 are expressed per acre basis and the realized net indemnity payments represent the net benefit associated with each coverage selection model. Overall, net farm income increased by participating in the Annual Forage program. For instance, the net indemnity payments received each year were on average greater than the net farm sales. Therefore, the Annual Forage program could be an effective tool to protect against adverse production and market conditions, as in those years with lower net farm sale values (i.e., 2017, 2018, and 2023). Among all models, the Naïve strategy obtained the highest indemnity payments, but its proposed coverages targeted relatively higher compensations compared to the other models (Table 4). When considering only comparable coverages (those targeting the same return: PS, BS, RSS and MV), the MV strategy yielded the highest indemnity payments. However, the goal of the proposed coverage strategies is not to attain the highest payouts, but to achieve the target return with the minimum risk. By definition, the MV strategy generates the optimal coverage (i.e., the lowest risk for any expected return) on the training set. However, the MV strategy was outperformed by the BS method in the out-of-sample set (Table 5). Even modest differences in performance between models at the acre level can translate into economically significant differences at the farm level. For instance, in Texas, about half of hay and haylage operations manage more than 100 acres (USDA NASS, 2024). Thus, it may be natural to assume that medium and large operations might be more inclined to implement the proposed coverage selection strategies, since the overall benefits they can obtain from the Annual Forage program increase linearly with the number of acres insured.
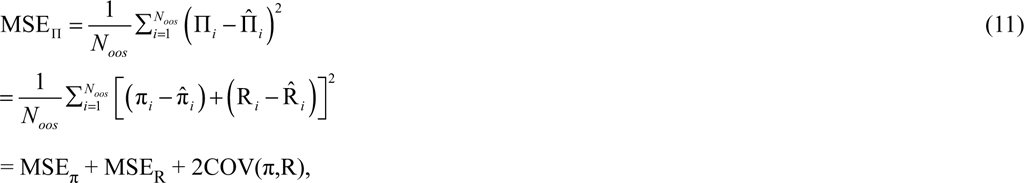
The MSE was used to compare the out-of-sample performance of the different coverage selection models. Namely, realized net farm income and indemnity payments were compared with their corresponding expected values. The MSE of the net farm income (MSE
Citation: International Food and Agribusiness Management Review 2026; 10.22434/ifamr.1251
where the circumflex (^) denotes expected values, Noos is the number of out-of-sample observations, MSE
Overall, during the test period, the realized net farm income and net indemnity payments were higher than their expected levels (Table 4). When comparing the performance of the coverage selection models, the net indemnities received using the BS strategy were, on average, closer to the expected payouts, resulting in the smallest MSER (295.71). The net indemnities of the RSS strategy followed with a MSER equal to 345.44. On the other hand, the highest MSER values were associated with the Naïve strategy (which aimed for higher payouts) (1322.87), MV (492.87), and PS (446.91) models. Compared with the baseline MV model, the BS strategy reduced the MSER by 40.00%. Given the similar percent of value assigned to the selected index intervals across models, the gains in accuracy are primarily attributed to the choice of the index intervals, which was different between the random subspace methods and the PS and MV selection strategies (Table 3).
In the case of net farm income, the smallest MSE
The covariance is also an indicator of the model’s ability to serve as an effective risk management decision- making tool by identifying coverages that compensate farmers when net farm sales are low, thereby reducing the variability of returns. In the case of the models evaluated, the MV and Naïve strategies presented the highest and lowest out-of-sample covariance, respectively. The high covariance of the MV model indicates that a systematic selection process can capture the inherent correlation between indemnities and farm sales. Therefore, the low covariance of the Naïve strategy (–15.05) is not surprising given its fixed and independent selection of the coverage decision parameters.
Realized net indemnities resulting from the proposed coverage selection methods were also compared to actual net payments received by farmers from the Annual Forage program over the period 2019 to 2024. For the locality of interest, a coverage level of 85% was chosen by all enrolled acres each year, and no information is available on indemnity payments for 2017 and 2018 (USDA RMA, 2024a). Except for 2019, the proposed coverage selection strategies resulted in higher insurance payouts than the actual average net indemnity payments received by farmers in Brazos County, the county in which Grid 12735 is located (Table 4). The potential for higher and less risky returns could increase farmers’ participation in the Annual Forage program. It is worth mentioning that the region has been experiencing a prolonged drought during the years considered in the study (U.S. Drought Monitor, 2025).
5. Summary and conclusions
In this study, four coverage selection strategies are adapted and evaluated in the context of the Annual Forage insurance program. The mean-variance (MV) strategy serves as a benchmark and basis for a penalized selection (PS) and two random subspace selection strategies: bagging selection (BS) and random subset selection (RSS). Although not entirely comparable, the proposed methods were compared with a Naïve selection strategy commonly considered in previous applications and with actual payouts.
The out-of-sample performance of the proposed models was evaluated on Texas Grid 12735 for the years 2017 to 2024. The Annual Forage program was used to protect cool-season forage wheat returns and reduce net farm income variability. The target return represented an optimistic return obtained under favorable weather conditions. Historical hay prices and actuarial information along with estimated forage yields and production costs were used to train, tune, and test the coverage selection methods in question. The resulting mean square error of net farm income is represented in terms of the sum of net farm sales and net indemnity errors and their correlation. Overall, the BS strategy obtained the lowest out-of-sample mean squared error for both net farm income and net indemnity. In particular, the BS model reduced the net indemnity error by 40% compared to the baseline MV strategy. But the MV strategy resulted in the highest negative correlation between net farm sales and indemnity payouts, an important consideration in basis risk management. On the other hand, higher indemnity payments were associated with the Naïve strategy, but this practical approach to coverage selection has limited potential to stabilize farmers’ returns.
In general, a 90% coverage level and a productivity factor that matches the target return were observed in the coverage selections derived from the different models. Furthermore, the choice of appropriate index intervals appears to be more relevant to stabilizing returns than the distribution of percent of value. Specifically, under the current configuration of the Annual Forage program, which began in 2024, the October–November, January–February, and March–April index intervals were chosen for all systematic coverage selection strategies under evaluation. It is worth emphasizing that the coverage selection process is not static but dynamic, depending on changing production and market conditions, as well as individual objectives and risk preferences.
Although the identified coverages may be relevant only to the geographic area of the study, the proposed data-driven coverage selection strategies can be implemented across all participating grids in the country. Therefore, to help farmers effectively participate in the Annual Forage program, systematic coverage selection frameworks such as those analyzed in this study must be transformed into practical decision-aid tools. Farm managers and consultants can benefit from these decision-making instruments by simplifying and facilitating the coverage selection process, potentially encouraging greater participation in the Annual Forage program. Furthermore, we illustrated the capability of a rainfall-based crop insurance to stabilize farm income under uncertain environmental and market conditions. For similar programs to be a viable option for other countries, they need to be adapted to the specific socioeconomic and agroecosystem circumstances of each region.
Lastly, empirical results suggest that the Annual Forage program may be a suitable mechanism for forage producers to increase their net farm income, since relatively higher net indemnities can be obtained with the appropriate coverage selection. However, for the Annual Forage program to be an effective risk management tool, policyholders must accurately formulate their production and market expectations. Additionally, there should be a stronger negative correlation between net farm sales and net indemnity payments to improve the program’s effectiveness in mitigating risk. These could be areas to consider for future research. Particularly, expectation formation and correlation assessments can benefit from improving the availability of forage production data through private and public initiatives.
References
Carter, M., A. de Janvry, E. Sadoulet and A. Sarris. 2017. Index insurance for developing country agriculture: a reassessment. Annual Review of Resource Economics 9(1): 421–438.
Cho, W. and B.W. Brorsen. 2021. Design of the rainfall index crop insurance program for pasture, rangeland, and forage. Journal of Agricultural and Resource Economics 46(1): 85–100.
Clement, K.Y., W.W. Botzen, R. Brouwer and J.C. Aerts. 2018. A global review of the impact of basis risk on the functioning of and demand for index insurance. International Journal of Disaster Risk Reduction 28: 845–853.
Diersen, M., P. Gurung and S. Fausti. 2015. Optimal allocation of index insurance intervals for commodities. Selected Paper. Southern Agricultural Economics Association, Atlanta, GA, January 31–February 3.
Graff, N.A., B.L. Fischer and J.L. Outlaw. 2021. Overview of the dual use crop insurance policy for forage producers. AFPC Briefing Paper No. 21-22.
Graff, N.A., B.L. Fischer, H.L. Bryant and D.P. Anderson. 2023. Dual use insurance for annual forage producers: comparing risk management alternatives. Agricultural Finance Review 83(3): 437–452.
Jimenez Maldonado, A.J. 2011. Developing decision rules for the rainfall index insurance program: an application to Pennsylvania producers. Ph.D. Dissertation, The Pennsylvania State University, State College, PA.
Maples, J.G., B.W. Brorsen and J.T. Biermacher. 2016. The rainfall index annual forage pilot program as a risk management tool for cool-season forage. Journal of Agricultural and Applied Economics 48(1): 29–51.
Miranda, M.J. and K. Farrin. 2012. Index insurance for developing countries. Applied Economic Perspectives and Policy 34: 391–427.
NOAA National Center for Environmental Information. 2024. Climate at a glance. Available online at https://www.ncdc.noaa.gov/cag/
ShalekBriski, A., W. Brorsen, J.K. Rogers, J.T. Biermacher, D. Marburger and J. Edwards. 2021. Design of the rainfall index annual forage program. Agricultural Finance Review 81: 114–131.
Singh, P. and G. Agrawal. 2019. Efficacy of weather index insurance for mitigation of weather risks in agriculture: an integrative review. International Journal of Ethics and Systems 35: 584–616.
Tadesse, M.A., B.A. Shiferaw and O. Erenstein. 2015. Weather index insurance for managing drought risk in smallholder agriculture: lessons and policy implications for sub-Saharan Africa. Agricultural and Food Economics 3: 1–21.
Texas A&M AgriLife. 2022. Texas small grains archives. Available online at https://varietytesting.tamu.edu/small-grains-archives/
Texas A&M AgriLife Extension. 2024. Texas crop and livestock budgets: District 11 – Coastal Bend. Soft red winter wheat. Available online at https://agecoext.tamu.edu/wp-content/uploads/2024/03/2024D11WheatUCB.pdf
USDA NASS. 2024. Quick stats.
USDA RMA. 2024a. Summary of business. Available online at https://www.rma.usda.gov/SummaryOfBusiness
USDA RMA. 2024b. Annual Forage. Available online at https://old.rma.usda.gov/en/Policy-and-Procedure/Insurance-Plans/Annual-Forage
USDA RMA. 2024c. Decision support tool annual forage. Available online at http://af.agforceusa.com/ri
USDA RMA. 2024d. Actuarial information browser. Available online at https://webapp.rma.usda.gov/apps/ActuarialInformationBrowser/Default.aspx
U.S. Drought Monitor. 2025. Time Series. Available online at https://droughtmonitor.unl.edu/DmData/TimeSeries.aspx
Zapata, S. D. and J. M. García. 2022. Risk-efficient coverage selection strategies for the Pasture, Rangeland, and Forage (PRF) insurance program. Journal of Agricultural and Applied Economics 54: 286–305.
Zapata, S.D., X. Villavicencio and A. Xicay. 2024. A statistical learning approach to pasture, rangeland, forage (PRF) insurance coverage selection. Applied Economic Perspectives and Policy 46(4): 1429–1449.
Corresponding author
For some locations and planting dates, there is a dual use option available where farmers can insure both their annual forage and small grain productions (Graff et al., 2021). The part of the policy related to the protection of forage production is the same as described here.
ShalekBriski et al. (2021) found that several weather variables affect forage yields and suggested alternatives for weather-based insurance programs.
The mean squared error is defined as:
Citation: International Food and Agribusiness Management Review 2026; 10.22434/ifamr.1251
where Noos is the out-of-sample size, yi is the observed value, and ŷi is the predicted value for the ith instance.


