Abstract
Florida is a significant producer in the domestic and global orange juice markets. However, Florida producers have faced substantial challenges over the past two decades, including the spread of citrus greening disease and recurring extreme weather events such as hurricanes and freezes. This study examines Florida’s rapidly changing orange juice industry by integrating supply chain mapping with a resilience framework and Actor-Network Theory (ANT). Focusing on three supply chain sectors: production and imports, processing and distribution, and retail and consumption, we uncover how sustained production declines have reshaped supply chain relationships, coordination mechanisms and market dynamics across the network. We identify adaptations including increased consolidation and reliance on imported orange juice. We highlight that resilience is enacted through the evolving relationships among human and non-human actors, where continuous negotiation, adaptation, and reconfiguration of roles enable the system to maintain functionality despite persistent disruptions. This study offers actionable insights into how actors adapt through strategies such as sourcing diversification and network reconfiguration. Our findings advance the theoretical understanding of supply chain resilience in agricultural contexts while providing practical guidance for policymakers, industry stakeholders, and researchers seeking to enhance industry sustainability.
1. Introduction
The orange, belonging to the Citrus sinesis family, is cultivated in several countries, such as the United States, Brazil, China, and Mexico, among others (Topuz et al., 2005). While widely recognized as a source of vitamin C, oranges also contain other important nutritional characteristics, including carotenoids, flavonoids, and essential oils (Pupin et al., 1999; Topuz et al., 2005). Oranges are consumed as fruit and juice. This includes freshly squeezed juice, pasteurized juice, and juice reconstituted from concentrate. Approximately 85% of cultivated oranges are processed into orange juice in the United States (Luckstead and Devadoss, 2021; USDA-NASS, 2023). Processed orange juice ranks among the world’s most popular fruit juices and is consumed globally (Morton Enterprises, 2018; Neves et al., 2011). In the United States, orange juice constitutes a significant portion of the juice and juice drinks industry, with 100% orange juice sales accounting for approximately 50% of the total juice sold in retail outlets (FDOC, 2024a; Trejo-Pech et al., 2017).
Florida is a significant producer in both the domestic and international orange juice markets. It serves as one of the primary hubs for orange production and orange juice processing alongside Sao Paulo in Brazil. This geographical concentration of orange production highlights the unique dynamics of the orange juice market as a few specific regions dominate global production, making the industry susceptible to supply chain disruptions due to supply shocks (Wang et al., 2006).
Over the past two decades, Florida has faced challenges that have affected its citrus industry. In the 2003/2004 crop season, Florida produced approximately 10.9 million tons of oranges, representing 84% of the total orange production within the United States (USDA-NASS, 2023). By the 2021/2022 crop season, Florida orange production fell to 1.85 million tons, representing an 83% reduction in production in 20 years (Figure 1). Four major historical and current challenges account for the decline in the economic size of the Florida orange juice industry: plant disease, extreme weather events, urbanization and unfavorable market conditions.

Orange production in Florida, California and the United States, 2002–2022. Source: USDA-NASS (2023).
Citation: International Food and Agribusiness Management Review 2026; 10.22434/ifamr.1239
The first major challenge is citrus greening disease, also known as huanglongbing (HLB). This devastating bacterial disease, spread by the Asian Citrus Psyllid, has become endemic to Florida since its detection in 2005. Its adverse economic effects on commercial citrus production have materialized in three primary ways. First, the disease elevates the mortality rate of citrus trees, resulting in reduced tree populations. Second, it diminishes the marketable yield per tree by adversely affecting fruit quantity, size, visual appearance, and flavor profile. Last, combating greening necessitates increased production costs, as growers resort to applying additional insecticides, foliar sprays, and fertilizers to mitigate the damage caused by the disease (Farnsworth et al., 2014).
Second, extreme weather events have been a historical threat to Florida’s agricultural sector. In the past two decades, Florida has faced nine major hurricanes (Bickel, 2022). The 2004–2005 season alone saw four hurricanes affect citrus-producing areas within six weeks. Hurricane Irma in the 2017–2018 season caused crop losses ranging from 30 to 70%, totaling an estimated $760 million in damages (FDOC, 2019; NOAA, 2019). Hurricane Ian in 2022 added further devastation, resulting in estimated losses of $247 million for citrus growers (Court et al., 2023). Alongside hurricane threats, periodic freezes, especially temperatures below –2.2°C, also pose an ongoing risk to citrus health (Ferrarezi et al., 2020; Luckstead and Devadoss, 2021).
Third, urbanization presents another challenge. Florida’s population grew by 35% between 2002 and 2023 (U.S. Census Bureau, 2023), intensifying pressure on agricultural land. Farmland has increasingly been converted into residential and commercial developments (Satterthwaite et al., 2010). In many cases, growers, particularly small and mid-sized ones, have exited the industry and sold land to developers in response to economic pressures from greening and climate shocks.
The fourth challenge emerges from intensified market competition and shifting consumer preferences. International competition from Brazilian and Mexican imports places downward pressure on Florida’s prices. Meanwhile, shifting consumer preferences such as reduced breakfast consumption and increased health concerns about sugar content have also driven down orange juice demand (Heng et al., 2019; Peterson, 2016). As a result of declining production and increased labor and input costs (Calvin et al., 2022), the market price of orange juice continues to rise, driving consumers to look for alternatives.
Together, these intersecting factors, biological, climatic, and economic, act as resilience disruptors, highlighting a supply chain under sustained pressure. Rather than viewing them as isolated shocks, this study conceptualizes them in a broader system consisting of several interconnected human and non-human elements that adjust and adapt to change over time. Although prior studies have examined features of Florida’s citrus industry, such as market structure, coordination mechanisms, and international competition (Azevedo and Chaddad, 2006; Binkley et al., 2002; Wang et al., 2006), there remains a lack of system-wide analysis that integrates these multiple disruptions within a resilience framework. Existing studies on this industry also predate the systemic effects of citrus greening and recent climatic volatility, leaving a limited understanding of how these interconnected disruptions transform actor relationships, governance structures, and value flows.
To address this gap, this study employs a supply chain mapping approach informed by the Actor-Network Theory (ANT) and the Supply Chain Resilience framework (Hald and Spring, 2023; Stone and Rahimifard, 2018) with the Florida orange juice industry as a case study. This approach is supplemented by both primary and secondary data to systematically analyze how the Florida orange juice industry responds to multiple disruptions. Supply chain resilience provides a lens for understanding continuity under stress, while ANT emphasizes the dynamic relations through which human and non-human actors co-produce change. Together, they enable a relational perspective on how resilience is enacted within a complex agricultural system.
This study approaches resilience, not as a fixed attribute of organizations, but as an action continuously performed through the relations and negotiations among human and non-human actors within the Florida orange juice network. Specifically, this study aims to:
(1) Map and trace how diverse human and non-human actors interact, reconfigure, and adapt during prolonged disruptions to uncover structural changes across three key supply chain sectors: production and imports, processing and distribution, and retail and consumption.
(2) Examine how governance mechanisms, market concentration, and price spreads, collectively shape and sustain supply chain resilience through network reorganization.
(3) Quantify shifting consumption patterns and consumer preferences for OJ amid ongoing supply disruptions using nationwide primary and secondary data.
(4) Discuss emerging opportunities/innovations that could inform strategic interventions by industry actors and policymakers, ultimately contributing to a more resilient supply chain.
This study contributes to the agricultural supply chain literature through a comprehensive examination of an industry transformation. Rather than isolating causal relationships within a single supply chain sector, it captures the interaction of multiple, simultaneous disruptions, revealing systemic patterns often overlooked in narrower analyses. The findings inform stakeholder decision-making and the development of effective interventions in an industry facing existential challenges.
Theoretically, the study reframes resilience as a performed property of a heterogeneous network rather than a static organizational capability. Guided by the principles of heterogeneity, relationality, and performativity from the ANT, resilience is conceptualized as an outcome continually enacted through evolving relationships among non-human (e.g., biological, technical, institutional) and human actors. This relational perspective recasts Florida’s orange juice industry as a dynamic network in which actors and materials co-produce adaptation in response to external disruptions.
The remainder of the study is structured as follows. Section 2 is a literature review. Section 3 presents methods and data sources. Section 4 maps the orange juice supply chain actors, alongside their economic scope and industry trends. Section 5 discusses the Florida orange juice industry as a network of human and non-human actors adapting to disruption. Section 6 concludes the study with findings, implications, contributions, and limitations.
2. Literature review and theoretical foundation
2.1 Supply chain resilience
In recent years, supply-chain resilience has become a concept that has gained increasing prominence as global supply networks face mounting risks from environmental, economic, and geopolitical disruptions. Resilience in this context refers not just to the ability of supply chains to withstand shocks, but also to the ability to adapt, reorganize, and even transform in response to disruptive events (Tukamuhabwa et al., 2015; Wieland and Durach, 2021).
Early literature on resilience primarily focused on an engineering perspective, emphasizing robustness, redundancy, and a system’s capacity to return to a pre-disruption equilibrium (Christopher and Peck, 2004; Sheffi and Rice, 2005). However, more recent theoretical advances conceptualize supply chains as complex adaptive systems, recognizing that interdependent actors and institutions co-evolve under stress (Ponomarov and Holcomb, 2009; Tukamuhabwa et al., 2015). This social-ecological view expands resilience beyond stability to include the capacity for adaptation and transformation (Wieland and Durach, 2021). Building on this multidimensional understanding, Ponomarov and Holcomb (2009) defines supply chain resilience as “the adaptive capability of the supply chain to prepare for unexpected events, respond to disruptions, and recover by maintaining continuity of operations at a desired level of connectedness and control.” Wieland and Durach (2021) highlight two dominant perspectives in resilience theory: engineering resilience, which emphasizes recovery and continuity, and social-ecological resilience, which foregrounds adaptability and the ability to reorganize in the face of systemic change.
This broadened view of resilience is especially relevant for agricultural supply chains, where biological and climatic factors can abruptly disrupt production. The socio-ecological perspective is particularly significant because the Florida orange juice supply chain is disrupted by systemic changes such as citrus greening, climate variability, market consolidation, and declining domestic consumption. Rather than aiming for restoration of a declining system, resilience in this case implies strategic shifts, such as sourcing diversification, vertical coordination, or functional reconfiguration. This view aligns with empirical observations in the Florida orange juice supply chain. Actors exhibit varied responses, ranging from exit and consolidation to strategic imports and process innovations, highlighting resilience as both a system-level and actor-specific phenomenon.
While the social-ecological lens explains what resilience entails (adaptation and transformation), it does not fully capture how these changes occur within networks of human and non-human relationships. To address this gap, ANT provides a complementary framework that explains how resilience is enacted through interactions, negotiations, and alignments among diverse entities.
2.2 Actor-Network Theory
Actor-Network Theory (ANT), offers a complementary lens for examining how order and stability emerge within complex systems (Callon, 1984; Latour, 2005; Law, 1992). ANT proposes that both human and non-human entities, such as technologies, regulations, pathogens, and natural forces, can influence outcomes. These heterogeneous entities, referred to as actants, interact to create and sustain the networks through which social and economic activity occurs.
ANT rests on three interrelated principles that together explain how social and material order is produced and maintained. The first principle, heterogeneity, recognizes that networks consist of diverse actors, both human and non-human, that can exert influence within a system. Accordingly, technologies, natural elements, regulations, and even ideas or discourses are granted agency alongside people and organizations. Their combined actions create the conditions under which coordination, innovation, or disruption occurs. The second principle, relationality, shifts the analytical focus from individual actors to the relationships that connect them. Agency is not viewed as an inherent property of any single entity but as something that emerges through interactions, alignments, and dependencies among actors. This means that changes in one element of the network can reverberate through others, reshaping collective outcomes. The third principle, performativity, highlights that networks are not fixed structures but ongoing accomplishments. They are enacted and stabilized through repeated practices, technologies, and institutional routines that bring the network into being and sustain it over time (Callon, 1984; Hald and Spring, 2023; Latour, 2005; Law, 1992; Yao and Liu, 2022).
Building on these foundations, ANT introduces several analytical concepts that describe how networks form and persist. Translation refers to the process through which actors negotiate roles, align interests, and establish shared meanings that enable collective action (Callon, 1984). Enrollment captures how certain actors are recruited or positioned within the network, often through the alignment of interests or the creation of mutual dependencies (Callon, 1984). Inscription describes how knowledge, rules, or expectations become materialized, such as in technical standards, price data, or regulatory documents, allowing interactions to be coordinated across time and space (Latour, 2005). Together, these processes explain how networks of human and non-human actors are assembled, stabilized, and sometimes reconfigured in response to disruption.
Hald and Spring (2023) argue for the relevance of applying ANT in supply chain management research, noting that its use has been relatively limited compared to other disciplines. They contend that adopting an ANT perspective enables researchers to better understand how supply chains emerge, evolve, and transform over time (Condé and Münch, 2025). By emphasizing the continuously evolving nature of networks, ANT provides a useful framework for analyzing and understanding systems such as the Florida orange juice industry.
Applying ANT to the Florida orange juice industry highlights how resilience is performed through interactions among human and non-human actors. For instance, citrus greening functions as a biological actor that reshapes farming practices while hurricanes operate as a climatic actor that periodically disrupts production. Each actor plays a role in reshaping the network. From this perspective, supply chain transformation can be understood as a process of continuous translation, from disruption to adaptation, where network stability is constantly negotiated. ANT complements the supply chain resilience framework by showing how resilience is enacted through the relational work of aligning actors and reorganizing networks to maintain functionality (Hald and Spring, 2023; Yao and Liu, 2022). In this way, resilience is not an inherent capacity but a performed outcome of interactions among several actors (Hald and Spring, 2023).
In this study, the Florida orange juice industry is conceptualized as a heterogeneous actor network sustained through continuous translation among biological, climatic, and institutional elements. By mapping these relationships, the study interprets resilience as a process of adaptation and reassembly, a dynamic performance through which diverse actors collectively maintain continuity amid persistent and intersecting disruptions.
3. Methods
3.1 Research design
This study leverages supply chain mapping and the ANT framework with the Florida orange juice supply chain as a case study. It focuses on how industry actors and governance structures have evolved in response to prolonged disruptions. This design is appropriate because the Florida orange juice industry represents a bounded system with unique structural and historical characteristics, allowing for in-depth analysis of systemic dynamics (Barratt et al., 2011).
To capture both supply and demand-side dynamics, the study integrates multiple secondary data sources (e.g., industry reports, USDA statistics, FDOC records, and prior studies) with primary survey data on consumer behavior. We analyze these data through a supply chain mapping approach, which enables us to visualize relationships across the industry and assess how actors respond to disruption. By utilizing the ANT as a framework, the study further interprets how human and non-human actors, such as growers, processors, consumers, diseases, regulations, and climatic events, interact to shape supply-chain resilience. ANT informs the interpretation of relationships and adaptive practices observed in the data.
3.2 Supply chain mapping
Supply chain mapping was employed as the foundational step within the case study design. This method provides a systematic approach to visualizing the structure, relationships, and constraints within a supply chain as it is a fundamental step in achieving strategic and effective supply chain management (Farris, 2010; Gardner and Cooper, 2003). From an ANT perspective, these maps are interpreted as critical socio-material networks where connections between actors, both human (e.g., growers, processors, regulators) and non-human (e.g., citrus greening, hurricanes, labeling standards, processing technologies), shape how the system performs resilience. This approach helps identify how disruptions create new alignments, such as import reliance, blending practices, or regulatory adjustments, which reconfigure the network.
3.3 Data sources and survey instrument
We use multiple data sources to analyze the relationships and trends among supply chain actors in the Florida orange juice industry. Secondary data sources in this study include: (1) yearly citrus reference books from the Florida Department of Citrus (FDOC), (2) estimates from the Economic Market Research Department (EMRD) of the FDOC, (3) citrus summary statistics from the United States Department of Agriculture (USDA), (4) economic estimates from Citrus Research and Education Center at the University of Florida, (5) the FDOC Nielsen Custom Database, and (6) other relevant published articles focused on the citrus and orange juice industry in Florida. These secondary data sources were critical for developing an orange juice supply chain map and assessing industry trends.
While secondary data provide macro-level insights into supply chain performance and market trends, they cannot capture the nuanced shifts in consumer attitudes and purchasing behaviors that ultimately drive market dynamics. To address this gap, we incorporate a valuable source of primary data that illuminates consumer preferences and consumption patterns for orange juice. The consumer data were collected through a monthly online survey developed and administered by the Florida Agriculture Market Research Center (FAMRC). Since July 2016, the survey has been distributed monthly to a consumer panel representative of the U.S. population through a third-party company, Toluna. Eligible respondents are food shoppers responsible for at least 50% of household grocery shopping and are above 18 years of age. Each month, approximately 500 responses are collected, resulting in a robust dataset that spans over seven years of consumer behaviors and preferences. This survey instrument incorporates attention check screeners to ensure data quality by verifying that participants read the questions carefully (Jones et al., 2015).
Specifically, this dataset enables us to analyze how consumer perceptions about orange juice have evolved in recent years, particularly as production challenges have led to higher prices and changing product formulations. The data have been widely utilized in consumer behavior research on orange juice, including studies on the key factors behind OJ demand and return-on-investment analysis (Heng et al., 2019), the impact of COVID-19 on OJ markets (Heng and House, 2021), consumer responses to rising orange juice prices (Yoon et al., 2024), and factors influencing consumer lapsing and returning behavior (Chen et al, 2025). In section 4.3, we draw on this dataset to examine shifts in consumer perception and the role of OJ marketing efforts in sustaining positive attitudes and demand.
4. Supply chain structure and mapping
Supply chain mapping follows two steps: (1) identifying key supply chain actors from production to consumption, and (2) depicting interactions and linkages between these actors. Based on the collected data and the different functions of actors along the supply chain, we characterize the orange juice supply chain into three broad stages: (1) production and imports, (2) processing and distribution, and (3) retailing and consumption. The resulting orange juice supply chain map is presented in Figure 2.
Orange juice supply chain map. Source: FDOC (2024). Percentage volume (%) imported from Brazil and Mexico and percentage volume (%) of frozen concentrated orange juice (FCOJ) and not from concentrate (NFC) was calculated using January–December 2023 data.
Citation: International Food and Agribusiness Management Review 2026; 10.22434/ifamr.1239
4.1 Production and imports
Growing regions and yield
Favorable climatic conditions make Florida ideal for orange production. During most of the 20th century, orange production thrived in Florida’s northern and central regions. In recent years, recurrent winter freezes and frosts in these areas have gradually driven the southward migration of orange groves within the state (NASA, 2005). Currently, Polk, DeSoto, Highlands, and Hendry counties collectively account for 59% of Florida citrus production (USDA-NASS, 2023).
Florida’s orange production has faced severe challenges in recent decades, with citrus greening (Huanglongbing, HLB) emerging as the most critical disruptor (Trejo-Pech et al., 2018). As shown in Figure 3, yields per acre have declined steadily, falling by 63% between the 2002/03 and 2021/22 seasons. The disease’s economic impact from 2012 to 2016 was estimated at $4.4 billion and over 7,900 lost jobs (Trejo-Pech et al., 2018). While other factors may affect yield (e.g., climatic events, less intensive use of inputs due to increased costs, etc.), there is consensus that greening has been the main driver of yield reductions.
The disease also alters the physical and chemical properties of the fruit, causing oranges to become misshapen, unevenly colored, and less sweet. The juice extracted from infected trees typically exhibits lower Brix levels, which indicate soluble solids and reflect sugar content, and is more bitter. Both factors diminish flavor quality (Dala-Paula et al., 2019; USDA-AMS, 1983). As a result, many growers struggle to meet the industry’s minimum Brix standard of 10.5% for processing-grade oranges (U.S. Food and Drug Administration, 2023). This decline in juice quality directly reduces grower revenues and has led processors to increasingly rely on blending domestic juice with imports to maintain product consistency and meet market expectations (Florida Farm Bureau, 2022).
Input costs
Commercial orange production in Florida is often carried out on large expanses of land. For cultivation, orange trees are grown in lath houses, transported to nurseries, and finally moved to orchards after about 12–16 months when the trees begin to bud (Britannica, 2023). Before greening, grove maintenance was relatively inexpensive, and the most expensive production input was harvesting labor.
Citrus greening has, however, caused a significant increase in input costs for orange production. To control the spread of greening and improve the productivity of affected trees, grove owners have adopted additional cultural practices, such as nutritional foliar sprays (Morgan et al., 2016; Rouse et al., 2017). Additionally, the use of fertilizers, insecticides, and fungicides to control for the disease increased over the years (Singerman, 2023). These changes led to an increase in the estimated cost of production per acre since the onset of greening (Singerman, 2020). Comparing the 2003–2004 and 2021–2022 seasons reveals a 72% increase in the cultural costs of orange production, rising from $879 to $1513 per acre. When adjusted for inflation, the real costs show a 15% increase over the same period (Figure 3).
Cultural cost per acre with tree replacement in southwest Florida and yield per acre in boxes. Sources: Muraro (2004–2012), Singerman (2015–2023); USDA-NASS (2023).
Citation: International Food and Agribusiness Management Review 2026; 10.22434/ifamr.1239
These rising production costs, driven by intensified use of foliar sprays, fertilizers, insecticides, and fungicides to combat citrus greening, have placed mounting financial pressure on growers, particularly those operating at smaller scales. This financial strain continues to contribute to structural shifts in the production landscape, including accelerated industry consolidation and reduced participation of small-scale actors. These changes not only affect farm-level viability but also alter the governance structure and relationships within the supply chain, as processors must adapt sourcing arrangements and coordination mechanisms in response to a narrowing base of domestic suppliers.
Growers and bearing acreage
Orange growers can be categorized into three distinct groups: (1) large agribusiness firms with more than 2000 ha of citrus; (2) medium-size growers with 100 to 2000 ha of citrus; and (3) small-size growers with less than 100 ha of citrus. This sector has witnessed a growing trend of consolidation, with large agribusiness firms expanding their market dominance in recent years (Morris, 2010; USDA-NASS, 2002–2022). Inevitably, rising production costs, coupled with the pressure to meet industry quality standards (Brix levels), have disproportionately burdened smaller-scale growers. Recent estimates from the USDA’s National Agricultural Statistics show that Florida’s orange-bearing acreage stands at 231 300 acres in the 2023–2024 season, representing a significant 59% reduction from the 2003–2004 production season (USDA-NASS, 2024). This reduction is predominantly attributed to the impact of greening (Singerman, 2019), although urbanization and extreme weather events have also contributed to the decline in citrus and orange production. These developments further signal a major shift in the production structure of the supply chain, where small-scale operations are increasingly at risk of exiting the industry. At the same time, they reflect broader consolidation trends that have shaped the Florida orange juice supply chain over the past two decades.
Varieties, harvesting and grading
Florida’s citrus industry grows sweet orange varieties such as Valencia, Hamlin, and Navel, among others. Each of these varieties holds a distinct place in the citrus season from mid-September through June. For example, Valencia oranges are a late-season fruit, while Navel oranges are an early to mid-season variety (USDA-NASS, 2023). As depicted in Figure 4, the citrus harvesting season runs from September to June, with different varieties being harvested at different times. Valencia oranges accounted for approximately 55% of the total orange production in the 2021–2022 growing season. This variety stands out as a top choice for orange juice processing due to its exceptional internal quality and vibrant orange color, making it ideal for producing high-quality orange juice (Tucker et al., 1998; USDA-NASS, 2023).
Orange harvesting seasons in Florida. Source: USDA-NASS (2023).
Citation: International Food and Agribusiness Management Review 2026; 10.22434/ifamr.1239
Orange harvesting is predominantly done by hand. Mechanical harvesting techniques are limited to a small share of citrus acreage (Calvin et al., 2022; Castro-Garcia et al., 2019; Moseley et al., 2012). Following harvest, the oranges are loaded into field bins and transported to processing facilities via trailers, for conversion into various citrus products (Trejo-Pech et al., 2018). The continued reliance on manual labor is partly due to citrus greening, which reduces yields and makes it economically unviable to invest in mechanical harvesting equipment for smaller operations. In addition, infected trees often have weaker branches and more fragile fruit, increasing the risk of damage during mechanized collection. Managing greening through nutritional programs, psyllid control, replanting, pruning, and canopy management has further intensified labor requirements, consequently increasing labor costs for growers.
Juice quality in Florida’s orange industry is primarily determined by the Brix level, acidity, and their ratio. The U.S. Department of Agriculture (USDA) sets standards for identifying processing-grade fruit used in Frozen Concentrated Orange Juice (FCOJ) and Not-from-Concentrate (NFC) products, classifying them as U.S. Grade A, Grade B, or Substandard based on sweetness, flavor, and color (USDA-AMS, 2023).
Orange juice imports
As shown in Figure 5, the volume of imported orange juice has significantly increased due to the continued decline in domestic production. Export volume has also steadily declined over the same period. The United States now relies heavily on imports from Brazil and Mexico, which together accounted for over 93% of total orange juice imports in the past five years. Within the same period, these two countries’ imports account for over 80% of NFC orange juice consumed (FDOC, 2024b). Between 2003 and 2023, the total volume of imported orange juice from Brazil increased by 75% from 229 million to 401 million. Notably, imports of NFC orange juice from Brazil surged by 1344%, from 64 million liters in 2003 to 924 million liters in 2023. Similarly, NFC imports from Mexico grew by 2670%, from 3 million liters to 83 million liters over the same period (FDOC, 2024b). Separately, Figure 6, which depicts total U.S. orange juice imports from all countries, shows that NFC now constitutes 49% of total orange juice imports, a dramatic increase from just 6% in 2003.
Estimated orange juice supply and use within the United States. Source: FDOC (2021). SSE, single strength equivalent. *Texas has been excluded from the figure due to its relatively low production volume.
Citation: International Food and Agribusiness Management Review 2026; 10.22434/ifamr.1239
US imports of orange juice, 2003–2023. Source: FDOC (2024). SSE, single strength equivalent.
Citation: International Food and Agribusiness Management Review 2026; 10.22434/ifamr.1239
The growing reliance on imported orange juice, particularly NFC, signals a significant structural shift in the Florida orange juice supply chain. This shift has implications for industry governance, value distribution, and resilience. On one hand, importation has become a critical strategy for maintaining product availability and stabilizing supply in the face of declining domestic production. From a resilience perspective, this shift illustrates how supply chain actors are adapting to long-term disruptions by diversifying sourcing and reconfiguring supply relationships. These transformations reflect one of the central concerns of this study, which is to understand how structural adaptations unfold in response to persistent stressors in the Florida orange juice industry. On the other hand, this increased dependence introduces new vulnerabilities, especially given that Brazil, the world’s leading orange juice producer, with an estimated production of about 307 million boxes in the 2023/24 season is now facing its own production constraints due to extreme weather (heatwaves and low rainfall) and rising incidence of citrus greening (Fundecitrus, 2024; USDA-FAS, 2023).
4.2 Processing and distribution
More than 90% of oranges grown in Florida are destined for processing and juicing. This is in contrast with California, where more than 80% of orange production is sold in the fresh market. Most processing plants are concentrated in central Florida, reflecting historical citrus-growing areas established in the early 1900s. These facilities were built before the southward migration of groves caused by recurring freezes and other weather risks. Rather than relocating, processors remained around central Florida because transporting harvested fruit was more cost-effective and less disruptive than rebuilding processing infrastructure (Morris, 2010).
Two main types of processors operate within Florida’s orange juice supply chain: (1) marketing processors, who process and sell juice under their own brands, and (2) bulk processors, who primarily process and ship juice to packers in bulk form (Wang et al., 2006). Processors also perform juice packing, which may involve reconstituting frozen concentrated orange juice (FCOJ) using high-quality water in a hygienic environment before packaging it into various formats for retailers, food service outlets, and consumers (Tetrapak, 2017). In terms of coordination, grower–processor relationships are managed through a range of contractual arrangements. These include fixed-price contracts, which guarantee predetermined payments, and pool arrangements, where compensation is based on average prices established by a group of producers (Trejo-Pech et al., 2018). Such agreements help stabilize growers’ incomes while ensuring processors maintain a reliable and predictable supply of fruit.
Processed orange juice is produced primarily in two forms: Frozen Concentrated Orange Juice (FCOJ) and Not-from-Concentrate (NFC) juice, also known as Single Strength Orange Juice (SSOJ). NFC is generally regarded as superior in quality, as it preserves more of the natural flavor compared to juice reconstituted from FCOJ (Mims et al., 2000). Juice quality largely depends on the characteristics of the harvested fruit and the initial processing, since later stages cannot improve the core quality parameters of a batch. However, quality can be enhanced through blending by mixing lower-quality juice with higher-quality juice or concentrate to achieve the desired sweetness and flavor (Mims et al., 2000; Tetrapak, 2017). Greening further complicates this process by altering the sensory and physicochemical properties of the juice. Juice from HLB-infected trees contains less sucrose and total sugars, along with reduced malic acid, leading to a loss of sweetness and a more pronounced sour taste (Dala-Paula et al., 2019). To counter this, processors blend juice from healthy fruit with juice from infected trees to improve overall taste and maintain acceptable quality. Increasingly, they blend Florida-grown juice with imported juice to meet the required Brix levels (Grosser et al., 2023). Additionally, processors may incorporate supplementary ingredients such as orange-peel oil, orange essence, resins, and peel molasses to standardize flavor and sweetness (Dala-Paula et al., 2019; Kiefl et al., 2018).
Due to intensified production challenges within the state, the Florida Citrus Processors Association (FCPA) and Florida Citrus Mutual (Growers Association) petitioned the U.S. Food and Drug Administration to lower the minimum Brix requirement from 10.5 to 10% (Citrus Industry Magazine, 2021; Food Safety Magazine, 2023). This petition demonstrates how industry actors adapt not only through operational strategies but also through institutional and regulatory channels, reflecting evolving governance mechanisms that underpin supply chain resilience amid prolonged disruption.
In addition to declining domestic production, Florida processors rely on multiple juice sources, including pre-existing inventory (beginning stocks), imports, and smaller domestic receipts from California and Texas. In response to the sustained decline in state production, both FCOJ and NFC imports have steadily increased (Figure 7). For example, in the 2020–2021 season, Florida-grown oranges accounted for 74% of the oranges processed into NFC juice, while imports contributed 26%. By the 2022–2023 season, imports were projected to supply 79% of the NFC juice processed in the state, with Florida-grown oranges contributing only 21% (FDOC, 2023). Figure 8 further illustrates this trend: total juice (FCOJ and NFC) produced from Florida-sourced oranges has fallen by approximately 95% between the 2003–2004 and 2022–2023 seasons.
Florida processors orange juice sources. Source: FDOC-EMRD estimates (2024). Imports include California and Texas.
Citation: International Food and Agribusiness Management Review 2026; 10.22434/ifamr.1239
Orange juice produced from all Florida-sourced oranges. Source: FDOC-EMRD Florida Processors Database (2024).
Citation: International Food and Agribusiness Management Review 2026; 10.22434/ifamr.1239
Florida orange juice processors also play another significant role by acting as dealers in a process referred to as intercannery transfer. This mechanism enables processors to sell and distribute imported orange juice or existing inventory to one another. Intercannery transfers enables processors to optimize their resources and respond to fluctuations in market conditions and consumer preferences. These transfers contribute to the overall flexibility and adaptability of the supply chain, ensuring that orange juice products remain readily available to consumers while efficiently utilizing existing inventory and imported supplies. From a resilience perspective, this practice represents a key adaptive strategy, enabling the supply chain to maintain continuity, optimize capacity, and buffer against localized disruptions.
4.3 Consumption
Retailers, food service, and institutional outlets are the final link to consumers in the supply chain. Consumers represent the supply chain’s last actor and begin the cash cycle by paying for finished products. Several noteworthy consumption trends are apparent. Sales of orange juice have been experiencing a consistent decline, mirrored by a reduction in per capita consumption (Figure 9). In 2021, per capita orange juice availability (i.e., the amount of food available for human consumption) was 8.32 liters in the US, a decrease of 55% compared to two decades earlier (USDA ERS, 2023). This downward trend can be attributed to shifting consumer habits, including decreased breakfast consumption, heightened awareness of sugar intake, diminished consumer awareness, and the accessibility of alternative drinks, such as energy drinks and flavored water (Bloomberg, 2019; Ferdman, 2014; Heng et al., 2019; Luckstead and Devadoss, 2021; Peterson, 2016).
Retail sales and per capita consumption of orange juice in the United States. Source: FDOC (2021).
Citation: International Food and Agribusiness Management Review 2026; 10.22434/ifamr.1239
This decline in consumption has also been exacerbated by the increase in orange juice production costs, which has translated into increased orange juice prices. According to the Consumer Price Index, inflation within the orange juice category peaked at 14.1% in January 2023 (Yoon et al., 2024). Despite the decline in orange juice consumption, the United States continues to maintain its position as the world’s largest consumer of orange juice (Neves et al., 2020). A notable surge in demand for orange juice was observed during the COVID-19 pandemic. This spike in consumption was associated with increased demand for vitamin C in the American diet as consumers sought ways to boost their immune systems. However, this heightened demand was not sustained long-term (USDA, 2020).
Post-pandemic, there have been notable price increases in the retail orange juice market, leading to decreased purchases of orange juice. Between February 2022 and February 2023, there was a 10% increase in prices for NFC orange juice and a 15.6% increase in prices for reconstituted orange juice (Citrus Industry Magazine, 2023). This upward price trend coincided with a decline in sales volume. There was a 5.9% decrease in NFC orange juice sales and a 20% decrease in reconstituted orange juice sales during the same period (Citrus Industry Magazine, 2023). Figure 10 illustrates the trend in retail orange juice prices, showing a consistent increase in nominal prices from the 2020–2021 season to the 2022–2023 season. However, when adjusted for inflation, real prices increased by 12% compared to the 35% increase in nominal prices.
Average retail prices of total orange juice between 2020–2024 in USD per gallon. Source: Retail sales trend various issues, FDOC (2023).
Citation: International Food and Agribusiness Management Review 2026; 10.22434/ifamr.1239
Recent research also indicates that, on average, consumers are willing to pay a premium for orange juice grown and processed in Florida (Heng et al., 2021). In fact, according to a nationwide consumer survey (Heng et al., 2019, 2021), over 70% of consumers believe that their orange juice is from Florida despite the significant production decline in Florida oranges during the past decades. As highlighted earlier, major Florida orange juice brands are now blending their products with imports due to production quality and quantity constraints. Brands like Florida’s Natural, which once exclusively produced 100% Florida orange juice, now incorporate blends of imported oranges into their products (Bohman, 2023), reflecting a strategic adaptation aimed at ensuring resilience amid ongoing production disruptions and rising prices.
Despite the decline in orange juice consumption, generic marketing communications have been consistently utilized to keep orange juice on top of consumers’ minds. For example, the Florida Department of Citrus (FDOC) was granted an average of $15.37 million annually from the 2020–2021 to 2022–2023 fiscal years to engage in domestic orange juice marketing promotions. The department leveraged various marketing channels, such as social media and eCommerce, to highlight the positive attributes of orange juice. A recent study by Chen et al. (2025) indicates that strengthening positive images of orange juice helps retain the current consumers and regain lapsed consumers.
To further examine consumer perceptions of orange juice and identify time-relevant changes, we employed the primary data source described in Section 2.3. Following Chen et al. (2025), an attitudinal scale with 15 statements measuring perceptions about orange juice on a seven-point Likert scale (from 1 for strongly disagree to 7 for strongly agree) was used. These measuring items were decomposed into five meaningful factors using Exploratory Factor Analysis with the principal component method and varimax rotation: (1) quality perception, including items such as “100% orange juice is a high-quality product”, (2) naturalness, including items such as “100% orange juice has no added sugar,” (3) family enjoyment, including items such as “ 100% orange juice is a beverage my whole family enjoys,” (4) healthfulness, including items such as “100% orange juice is a simple way to do something healthy,” and (5) sugar and calorie perception, including items such as “100% orange juice has too much sugar.”
Figure 11 presents the seven-year average rating for each factor and reveals meaningful patterns in consumer perceptions. Among the five factors, orange juice is most highly regarded for its quality (average=6.0) and is also considered natural (average=5.2), enjoyable for families (average=5.3), and healthy (average=5.2). Comparatively, consumers’ perceptions about orange juice’s sugar and calorie content scored lower (average =3.9), indicating consumers’ disagreement with statements such as “orange juice has too much sugar” and “orange juice is too high in calories.” These time-trend data show that perceptions peaked in 2021 across most categories, likely influenced by pandemic-related consumption patterns, with a slight downward trend in naturalness and healthfulness ratings since then. These findings indicate that despite declining consumption trends, consumers continue to hold orange juice in high regard. This persistent positive sentiment creates a strategic opportunity for the industry to reinvigorate demand through marketing campaigns that highlight these favorable attributes.
Changes in consumer perceptions of orange juice, 2017–2023. Source: FDOC Consumer Orange Juice Tracker, managed by University of Florida’s Food and Resource Economics Department – Florida Agricultural Market Research Center. Consumer perceptions about orange juice were measured on a 7-point Likert scale ranging from 1 (strongly disagree) to 7 (strongly agree). The presented values are the average scores for each factor, including perceptions about quality, naturalness, family enjoyment, healthfulness, and sugar and calorie content.
Citation: International Food and Agribusiness Management Review 2026; 10.22434/ifamr.1239
Orange juice promotions have demonstrated a positive impact on consumption. According to the FDOC Consumer Orange Juice Tracker, awareness of OJ promotions is associated with a higher share of active OJ consumers (those who purchased OJ in the past month). For example, in 2023, among those who were aware of OJ promotions, 74.6% were active consumers, compared to 44.7% among those unaware, indicating that promotion-aware consumers were more likely to be active OJ buyers. Further analysis of maximum willingness to pay (WTP) and health perceptions reinforces this pattern (Figure 12). Consumers who are aware of OJ promotions reported both higher WTP and more favorable health perceptions. In 2023, promotion-aware consumers were willing to pay 8% more for a 1.5-liter not-from-concentrate OJ compared with those unaware ($6.09 vs. $5.64). Similarly, their positive perceptions ratings were 10% higher (6.0 vs. 5.5). For long-term resilience, the orange juice industry could leverage consumer goodwill generated through marketing to stabilize demand, while simultaneously implementing adaptive strategies to address ongoing production and supply chain challenges.
Differences in maximum WTP and health perceptions of orange juice consumers by promotion awareness. Source: FDOC Consumer Orange Juice Tracker, managed by University of Florida’s Food and Resource Economics Department – Florida Agricultural Market Research Center. The OJ Health Perception variable is a composite measure based on 10 positive perceptions about OJ in the OJ tracker (see Heng et al. (2019) for details on the OJ Good variable). The Maximum WTP variable is measured by asking: “At what price would you think this 52 oz. container of 100% orange juice is starting to get expensive, but you still might consider buying it?”
Citation: International Food and Agribusiness Management Review 2026; 10.22434/ifamr.1239
5. Networked governance, adaptation, and resilience in the Florida orange juice industry
The following sections illustrate how the Florida orange juice supply chain functions as a complex adaptive system shaped by the interactions of human and non-human actors. Across production and processing, these actors continually adjust relationships and strategies to sustain production and operations amid ongoing disruptions. Guided by the Actor–Network Theory (ANT), this analysis integrates governance structures and adaptive strategies to explain how resilience develops through the evolving configuration of the network.
5.1 Networked adaptation and translation
Building on the initial supply chain mapping, ANT provides a relational framework to reinterpret how Florida’s orange juice industry adapts to prolonged disruption through the interactions of human and non-human actors (Figure 13). Rather than viewing resilience as isolated managerial decisions taken by actors along a chain, ANT highlights how interactions and negotiations among these actors collectively shape the system’s continuity. These actors include growers, processors, regulators, and trade associations, as well as non-human entities such as the citrus-greening bacterium, hurricanes, Brix standards, fertilizers, blending technologies, and imported juice. Together, they form a shifting network that is continuously reassembled to sustain production, processing, and consumption in the Florida orange juice industry. Hence, this supply chain is not a fixed system but a dynamic network that has adapted to decades of disruption. The resilience shown by the industry exists not because of a single strong actor, but because the network continually reorganizes itself to cope with changing conditions (Hald and Spring, 2023; Yao and Liu, 2022).
Translation processes between human and non-human actors. Source: Authors.
Citation: International Food and Agribusiness Management Review 2026; 10.22434/ifamr.1239
Translations due to biological and climatic disruptors
Citrus greening (HLB), one of the most significant non-human disruptors, functions as an actant that reconfigures production and supply of oranges. This factor triggers new translations such as the adoption of foliar nutrition programs, intensified fertilizer use, and the reallocation of financial and managerial resources toward disease management. Subsequently, rising costs progressively dis-enroll smaller growers, driving consolidation and new governance structures that favor large, vertically integrated actors (Figure 13). Likewise, recurring winter freezes have historically translated climatic risk into geographic reorganization, driving the southward migration of groves and altering the spatial alignment between production zones and processing plants. In turn, urbanization also acts as a slower but equally influential force of network translation: rising land values and suburban expansion dis-enroll agricultural lands and small growers, while enrolling new actors such as developers and local planners. Together, these non-human actors continually reshape and renegotiate the relationships that make orange juice production feasible.
Institutional and technical translation
At the processing level, quality standards such as Brix thresholds operate as inscriptions that regulate several actors around measurable benchmarks. When disease and hurricanes push juice below these thresholds, processors engage in network repair through blending, supplementation, or regulatory petitions to adjust the Brix standard. These practices illustrate how actors employ technical and institutional mechanisms to re-stabilize the supply chain network when its integrity is threatened (Figure 13).
The growing reliance on imports from Brazil and Mexico further exemplifies resilience through reconfiguration. Imports act as new non-human actors that compensate for domestic shortages and quality declines, extending the network transnationally. However, this adaptation also creates new forms of dependency, as the stability of the Florida network becomes tied to the climatic conditions, disease pressures, and trade policies of other countries. In this way, every effort to restore balance within the system also introduces new vulnerabilities, highlighting the continuous and relational nature of resilience.
Networked adaptation
The transformations observed across production and import dynamics represent more than technical responses to stressors; they are ongoing acts of co-ordination and adaptation within a fluid network of interdependent actors. Examining these dynamics through the ANT principles of heterogeneity, relationality, and performance provides deeper insight into how resilience is achieved.
The principle of heterogeneity emphasizes that resilience arises from interactions among multiple, diverse actors, including growers, pathogens, technologies, regulatory agencies, and trade mechanisms. Each contributes distinct capabilities and constraints that shape adaptive responses. Relationality highlights that these actors operate interdependently through continuous coordination and negotiation. Resilience thus emerges from dynamic relationships between growers and processors adapting to greening, regulators setting standards, and importers balancing supply and quality. Finally, performativity emphasizes that resilience is enacted through everyday practices rather than predetermined structures. Actions such as petitions to modify Brix thresholds, blending imported juice to maintain standards, and reorganizing domestic production illustrate how networks are sustained through practice (Citrus Industry Magazine, 2021; Food Safety Magazine, 2023).
Taken together, these principles reveal that resilience is not a fixed characteristic of the supply chain. Resilience is an ongoing accomplishment achieved through repeated coordination and adjustment among people, technologies, and institutions. Each act of collaboration or adaptation temporarily stabilizes the network, allowing the Florida orange juice industry to reorganize and continue functioning amid persistent disruption.
5.2 Networked governance and structural reconfiguration
Governance and co-ordination mechanisms
Governance is a central element of supply chain organization, encompassing the relationships and coordination mechanisms that structure interactions among actors (Gereffi et al., 2005; Kaplinsky and Morris, 2012). In the Florida orange juice industry, governance emerges not only through formal institutions but through a web of interactions linking growers, processors, regulators, and technologies that collectively sustain production and trade. These arrangements represent continuous processes of translation and enrollment, where human and non-human actors align interests to stabilize the system.
Regulations, contracts, and integration strategies act as inscriptions that make coordination visible and enforceable across space and time. For example, the Florida Administrative Code Rule 20-3.005 functions as an inscription that formalizes transactions, structures data sharing with the Florida Department of Citrus, and maintains trust between growers and processors (Florida Department of State, 2022). Similarly, contractual norms, whether fixed-price or pool arrangements, translate uncertainty into predictable outcomes by enrolling growers and processors into shared economic expectations. In this sense, governance operates as a networked process where order is continually enacted through documents, standards, and shared routines. These governance processes also underpin broader structural shifts in the industry, as recurring disruptions and adaptive strategies have reconfigured ownership patterns and market concentration.
Past events also shed light on how translation and reconfiguration processes have come about in the Florida orange juice supply chain. During the 1970s and 1980s, backward vertical integration (BVI) was a dominant strategy, enabling processors to secure fruit supply through ownership of groves. These arrangements reduced transaction costs and stabilized relationships by enrolling land, labor, and capital within vertically controlled networks. However, climatic shocks such as hurricanes and freezes, combined with rising land prices and the spread of citrus greening, destabilized this configuration. Processors subsequently dis-enrolled from grove ownership and re-enrolled in forward integration, shifting control downstream toward processing, branding, and retail (Fernandes, 2003; Trejo-Pech et al., 2018).
This structural shift reflects the reorganization of the actor network in response to environmental and economic disruptions. Processors leveraged technological and institutional non-human actors, such as long-term contracts, blending systems, and marketing infrastructures, to maintain stability without direct ownership of production. These adaptive translations not only preserved juice supply but also redefined power relations within the network, concentrating decision-making among downstream actors while reducing growers’ influence.
Ultimately, governance in Florida’s orange juice supply chain can be understood as a performative and relational process, a continual negotiation among human and non-human actors that enables the system to function under uncertainty. The shift from backward to forward integration, and the evolution of contracting mechanisms (see Section 4.2) demonstrate how resilience is enacted through networked governance rather than hierarchical control.
Industry concentration and market structure
These governance and structural changes have also contributed to an increase in concentration within the Florida citrus sector. The structural landscape of the industry has undergone significant transformation over the past two decades, characterized by consolidation among growers, processors, and brands.
Data from the U.S. Department of Agriculture indicate a steady reduction in orange-bearing acreage and the exit of small producers (Figure 14). The share of smaller operations (less than 25 acres) declined by 12.6%, while large farms (more than 100 acres) increased by 9.7%. These shifts suggest a trend toward larger, more capital-intensive operations, reflecting the rising costs of production and the selective enrollment of actors with sufficient financial and technological capacity to withstand recurring disruptions. Similarly, the orange juice processing industry has experienced substantial consolidation in response to climatic and biological challenges. The number of processors declined from 52 in the 1980s to 31 by the 1990s (Davis, 2023), and to roughly 14 by the late 2010s (Singerman, 2019). This decline in local processing capacity has coincided with increasing concentration in the retail market, where three major brands now control 50–60% of orange juice sales.
Orange bearing acres by operation size. Source: U.S. Department of Agriculture, National Agricultural Statistics Service. Census of Agriculture (2002, 2007, 2012, 2017, 2022).
Citation: International Food and Agribusiness Management Review 2026; 10.22434/ifamr.1239
This consolidation represents another form of network reconfiguration. Biological and economic pressures such as greening, hurricanes, and rising input costs act as non-human actors that destabilize existing relationships and prompt selective enrollment of well-capitalized firms. As a result, smaller growers and processors are progressively dis-enrolled, while production and decision-making become concentrated among large agribusinesses and multinational companies.
5.3 Price spreads as inscriptions
The redistribution of power and coordination among actors is also reflected in economic outcomes, most notably in the evolution of price relationships across the chain. Price spreads between farmgate and retail levels offer valuable insight into how value and risk are distributed within the Florida orange juice supply chain (Langemeier, 2022).
Over the past two decades, both the frozen concentrated orange juice (FCOJ) and not-from-concentrate (NFC) segments have experienced widening gaps between producer and retail prices (Figures 15 and 16). For FCOJ, the farmgate price increased from $0.50 per gallon (3.7854 liter) in 2000–2001 to $1.34 in 2015–2016, while retail prices rose by 56%, raising the farm share from 16 to 27%. For NFC juice, farmgate prices rose 242% between 2000–2001 and 2021–2022, from $0.50 to $1.74 per gallon, yet the farm share remained lower than that of FCOJ. This suggests that increases in growers’ costs are not evenly transmitted through the chain, as a larger portion of retail value is absorbed by downstream processing, packaging, and marketing (USDA-ERS, 2023).
Price spread of frozen concentrated orange juice between farmgate and retail. Source: USDA-ERS (2023). Data on frozen concentrated orange juice price spreads are only available up until the 2015–2016 season. Farmgate price is referred to as “farm value” in the USDA report.
Citation: International Food and Agribusiness Management Review 2026; 10.22434/ifamr.1239
Price spread, orange juice not from concentrate (NFC), per gallon. Source: USDA-ERS (2023).
Citation: International Food and Agribusiness Management Review 2026; 10.22434/ifamr.1239
Viewed through ANT, price relationships can be interpreted as economic inscriptions that both represent and mediate relationships among actors. Prices act as non-human actors that capture and communicate disruptions while simultaneously shaping how growers, processors, and retailers respond. Prices in this chain serve as indicators of cost and scarcity, as well as instruments of governance that signal how value is redistributed across the network. Currently, processors and retailers, positioned closer to consumers, capture greater value, while growers remain exposed to production volatility and limited bargaining power.
The principle of relationality is evident in how prices connect multiple actors, transmitting signals that influence behavior, coordinate decisions, and redistribute value. Performativity is also reflected in how prices actively shape these relationships, influencing negotiation strategies and risk allocation. The widening farmgate-to-retail spread indicates both market imbalance and a broader reconfiguration of relationships among actors within the Florida orange juice network.
5.4 Re-enrolling the network: building innovation and future resilience
While there is no known cure for citrus greening, emerging innovations can enroll new actors while also re-enrolling lost actors into the network. A key example is the introduction of oxytetracycline (OTC), an antibiotic used to manage greening symptoms in mature orange trees, which constitute the majority of Florida’s current inventory (Archer et al., 2023). Early foliar applications proved ineffective because they failed to deliver sufficient concentrations to the phloem where the bacterium resides (Al-Rimawi et al., 2019; Vincent et al., 2022). Recent advances in trunk injection methods have improved efficacy by delivering the antibiotic directly into the vascular system, significantly reducing bacterial loads and improving yield and juice quality (Archer et al., 2023; Vincent et al., 2022).
Similarly, tree replacement programs offer growers an opportunity to sustain and expand citrus production (Singerman and Fritz, 2021; USDA 2017). Replanting is a vital step to ensure continued orange production in the state (Zansler and Spreen, 2021). Data from the Florida Department of Citrus (FDOC) indicates a decline in replacement rates since the early 2000s (Figure 17). This decline implies that, on average, fewer than one tree is replanted for each lost, resulting in decreasing tree populations and acreage. A replanting analysis by the FDOC considers the impact of a replant rate of 125% over the next ten years. In comparison to the current 80% replant rate, the 125% rate is expected to increase orange production yields in the future, presenting an opportunity for the citrus industry to recover from the effects of greening.
Tree replacement rate in Florida. Source: FDOC (Zansler and Spreen, 2021). Notes: Replacement rate is calculated as the difference between loss rate and replanting rates.
Citation: International Food and Agribusiness Management Review 2026; 10.22434/ifamr.1239
These technological and policy initiatives demonstrate how innovation facilitates new alignments among scientific, regulatory, and production actors. The adoption of OTC injections mobilizes research institutions, growers, and regulators in collaborative experimentation, while replanting initiatives, supported by USDA’s Tree Assistance Program (TAP), enroll financial and policy resources to restore capacity. Each of these developments functions as an act of re-enrollment that strengthens the network’s ability to adapt and recover.
Viewed through the lens of Actor–Network Theory, the Florida orange juice supply chain demonstrates that resilience is neither static nor the outcome of singular decisions. Institutional interventions and support highlight the importance of policy actors in sustaining resilience, ensuring that the network can reorganize and continue functioning amid ongoing disruption. Resilience is enacted through the practices, technologies, and institutional arrangements that translate disruption into continuity, reflecting a system that endures not through stability but through its capacity to reorganize.
6. Conclusion
The Florida orange juice industry has faced compounding challenges over the past two decades. On the supply side, citrus greening disease has been the dominant factor driving the sharp decline in production, but growers and processors are also contending with repeated hurricanes, freezes, rising labor and input costs, and increasing competition from imports. These pressures have diminished Florida’s historical dominance in orange production and forced significant structural adaptations across the supply chain. Processors are increasingly reliant on imported frozen concentrated orange juice and not-from-concentrate orange juice imports to maintain operational continuity and meet consumer demand. At the retail level, persistent supply disruptions have contributed to rising orange juice prices. These price increases have exacerbated the trend of declining per capita consumption due to shifting consumer preferences and health concerns.
This study provides a comprehensive, system-wide analysis of the Florida orange juice supply chain, capturing the emerging patterns of consolidation, sourcing adaptation, and strategic responses that are reshaping the industry. It reveals how supply chain actors have adopted resilience strategies including sourcing diversification, intercannery transfers, blending techniques, and marketing shifts to navigate prolonged disruptions. The findings also highlight new vulnerabilities introduced by the industry’s growing dependence on external sources of juice. However, this period of disruption presents several strategic opportunities for industry. For instance, consumer loyalty to Florida-branded orange juice remains high, suggesting potential for targeted marketing and value-added branding initiatives. Additionally, investments in disease-resistant tree varieties, replanting programs, and improved delivery mechanisms for treatments like antibiotics offer promising avenues for long-term production recovery.
In addition to its practical insights, this study advances the literature by demonstrating how supply chain mapping can be utilized in conjunction with resilience frameworks to analyze agricultural sectors confronting major structural changes. By introducing the Actor–Network Theory (ANT) as a lens, the study reinterprets resilience as a networked process rather than a static outcome. This demonstrates that supply chains are complex adaptive systems, where interdependent actors and institutions co-evolve under stress, respond to disruptions, and recover by maintaining continuity of operations at a desired level of connectedness and control (Ponomarov and Holcomb, 2009; Tukamuhabwa et al., 2015).
By incorporating ANT, this study also demonstrates that resilience in the Florida orange juice industry is not solely a managerial or organizational achievement but a performative outcome of continuous negotiations among heterogeneous actors. Non-human entities such as pathogens, prices, technologies, and regulatory codes actively participate in shaping adaptation and coordination. These inscriptions translate disruptions into actions that sustain continuity, reinforcing that resilience is embedded within the relational and material networks that constitute the supply chain itself.
The Florida orange juice industry survives not by returning to a former state of stability, but by continually shifting and reorganizing its human and non-human actors to sustain continuity. Production adapts through new disease management practices and structural consolidation; processing adjusts through blending technologies, import reliance, and intercannery transfers; while consumption remains anchored through enduring brand trust, health narratives, and emotional connections with consumers.
This relational perspective moves beyond descriptive supply chain mapping by uncovering the invisible linkages through which coordination, power, and adaptation occur. It highlights that resilience emerges not from the stability of individual actors but from the dynamic capacity of the network to reorganize its relationships when disrupted. These theoretical contributions extend existing frameworks for supply chain analysis into new, highly disrupted agricultural contexts, offering fresh insights into the co-evolution of industry structure and resilience in the wake of systemic changes.
This study has two important limitations. First, due to data reporting and sharing restrictions, there is a lack of granular data on specific characteristics or names of supply chain actors (especially processors and brands). As a result, some assessments could not be performed, such as quantifying industry concentration and consolidation both vertically and horizontally over time, as well as conducting a causal analysis of the driving factors behind changes in market power dynamics. Second, this study employs ANT as an interpretative framework, rather than a methodological approach to tracing the networked process through which resilience is enacted. Nevertheless, these limitations present opportunities for future research to explore topics like: (1) how market structural changes are influenced by supply chain disruptions discussed in this study (e.g., citrus greening and hurricanes); (2) the effectiveness of replanting and tree replacement programs in enhancing the industry’s economic outcomes and individual supply chain actors’ performance; (3) how Florida processors’ increasing reliance on imports impacts orange juice pricing at different stages of the supply chain (e.g., farm gate and retail prices); and (4) applying Actor–Network Theory methodologically to enable detailed qualitative mapping of translations among actors, providing a more dynamic understanding of how relationships are formed, stabilized, and transformed under disruption. Combining ANT with longitudinal or participatory data could reveal how resilience is continuously performed through everyday negotiations and material practices, providing a deeper account of adaptation in agri-food supply chains.
Finally, the findings of this study carry broader implications for policymakers and industry stakeholders. Strengthening the resilience of Florida’s citrus industry through investments in disease-resistant varieties, improved risk management infrastructure, and diversified sourcing strategies remains essential. Enhanced collaboration between regulatory agencies and industry organizations can also help move the sector beyond crisis management toward strategic revitalization. Moreover, marketing communication that reinforces positive images of orange juice is shown to maintain consumer engagement and stabilize demand. By viewing resilience as an ongoing process of translation and transformation, this study provides a framework for understanding how agricultural industries facing systemic threats can evolve toward greater sustainability, competitiveness, and long-term vitality.
Acknowledgements
This research was supported by the U.S. Department of Agriculture, Economic Research Service. The findings and conclusions in this publication are those of the authors and should not be construed to represent any official USDA or U.S. Government determination or policy. This work was also supported by the USDA National Institute of Food and Agriculture Hatch Project FLA-FRE-006374. The authors also extend their gratitude to the Florida Department of Citrus Economic and Market Research Department for their invaluable data support and insights.
References
Al-Rimawi, F., F. Hijaz, Y. Nehela, O. Batuman and N. Killiny. 2019. Uptake, translocation, and stability of oxytetracycline and streptomycin in citrus plants. Antibiotics 8(4): 196. https://doi.org/10.3390/antibiotics8040196
Archer, L., S. Kunwar, F. Alferez, O. Batuman and U. Albrecht. 2023. Trunk injection of oxytetracycline for huanglongbing management in mature grapefruit and sweet orange trees. Phytopathology 113(6): 1010–1021. https://doi.org/10.1094/PHYTO-09-22-0330-R
Azevedo, P.F.D. and F.R. Chaddad. 2006. Redesigning the food chain: trade, investment and strategic alliances in the orange juice industry. International Food and Agribusiness Management Review 9(1): 18–32. https://doi.org/10.22004/AG.ECON.8212
Barratt, M., T.Y. Choi and M. Li. 2011. Qualitative case studies in operations management: Trends, research outcomes, and future research implications. Journal of Operations Management 29(4): 329–342. https://doi.org/10.1016/j.jom.2010.06.002
Bickel, M.H. 2022. From Michael to Charley: Nine notable hurricanes to hit Florida this century. The News-Press. Available online at https://www.news-press.com/story/weather/hurricane/2022/09/24/hurricanes-florida-nine-noteworthy-storms-since-2000-michael-irma-charley-ivan-jeanne-dennis-wilma/8104386001/
Binkley, J., P. Canning, R. Dooley and J. Eales. 2002. Consolidated Markets, Brand Competition, and Orange juice prices. U.S. Department of Agriculture Economic Research Service, AIB-747-06. Available online at https://www.ers.usda.gov/webdocs/publications/42194/15279_aib74706_1_.pdf?v=0
Bloomberg. 2019. The fall of juice and the rise of fresh fruit. Bloomberg.com. Available online at https://www.bloomberg.com/view/articles/2019-09-27/american-shoppers-spurn-orange-juice-for-for-fresh-fruit
Bohman, D. 2023. Orange juice brands no longer making juice from 100% Florida-grown oranges. WPTV News Channel 5 West Palm. Available online at https://www.wptv.com/news/region-indian-river-county/vero-beach/orange-juice-brands-no-longer-making-juice-from-100-florida-grown-oranges
Britannica. 2023. Orange. Available online at https://www.britannica.com/plant/orange-fruit
Callon, M. 1984. Some elements of a sociology of translation: domestication of the scallops and the fishermen of St Brieuc Bay. The Sociological Review 32(S1): 196–233. https://doi.org/10.1111/j.1467-954X.1984.tb00113.x
Calvin, L., P. Martin and S. Simnitt. 2022. Adjusting to Higher Labor Costs in Selected U.S. Fresh Fruit and Vegetable Industries. U.S. Department of Agriculture, Economic Research Service, EIB-235. Available at: https://www.ers.usda.gov/webdocs/publications/104218/eib-235.pdf?v=2814.2
Castro-Garcia, S., F. Aragon-Rodriguez, R. Sola-Guirado, A. Serrano, E. Soria-Olivas and J. Gil-Ribes. 2019. Vibration monitoring of the mechanical harvesting of citrus to improve fruit detachment efficiency. Sensors 19(8): 1760. https://doi.org/10.3390/s19081760
Chen, L.A., S. Yoon and L. House. 2025. Bringing lapsed consumers back to the market might not be as simple as reversing why they left: the case of generic food. Journal of Marketing Analytics: in press. https://doi.org/10.1057/s41270-025-00397-4
Christopher, M. and H. Peck. 2004. Building the resilient supply chain. The International Journal of Logistics Management 15(2): 1–14. https://doi.org/10.1108/09574090410700275
Citrus Industry Magazine. 2021. Suspension of OJ Brix Level Sought. Available online at https://citrusindustry.net/2021/06/21/suspension-of-oj-brix-level-sought/
Citrus Industry Magazine. 2023. Juice Prices Climb; Volume Sales Drop. Available online at https://citrusindustry.net/2023/03/21/juice-prices-climb-volume-sales-drop/
Condé, L. and C. Münch. 2025. Resilient by Design: Exploring the social abilities and actor‐network roles of artificial intelligence in supply chain management. Journal of Business Logistics 46(4): e70032. https://doi.org/10.1111/jbl.70032
Court, C., X. Qiao, B. Saha, F. He and K. McDaid. 2023. Estimated Agricultural losses resulting from Hurricane Ian. Food and Resource Economics Department, University of Florida, Gainesville, FL. Available online at https://fred.ifas.ufl.edu/media/fredifasufledu/economic-impact-analysis/reports/FRE-Final-Hurricane-Ian-Report.pdf
Dala-Paula, B.M., A. Plotto, J. Bai, J.A. Manthey, E.A. Baldwin, R.S. Ferrarezi and M.B. Gloria. 2019. Effect of huanglongbing or Greening Disease on orange juice quality, a review. Frontiers in Plant Science 9: 1976. https://doi.org/10.3389/fpls.2018.01976
Davis, E. 2017. Where your Florida orange juice comes from. Modern Cities. Available online at https://www.moderncities.com/article/2017-dec-where-your-florida-orange-juice-comes-from
Farnsworth, D., K.A. Grogan, A.H. Bruggen and C.B. Moss. 2014. The potential economic cost and response to Greening in Florida citrus. Choices 29(3): 6. https://doi.org/10.22004/AG.ECON.188996
Farris, T. 2010. Solutions to strategic supply chain mapping issues. International Journal of Physical Distribution and Logistics Management, 40(3): 164–180. https://doi.org/10.1108/09600031011035074
Florida Department of Citrus (FDOC). 2019. Hurricane Irma FAQs – Florida citrus growers. Available online at https://www.floridacitrus.org/grower/fdoc-news-item/hurricane-irma-faqs/
Florida Department of Citrus (FDOC). 2021. Economic reports: citrus reference book. Available online at https://www.floridacitrus.org/grower/florida-department-of-citrus/economic-market-resources/economic-reports/
Florida Department of Citrus (FDOC). 2023. Retail sales trends. Available online at https://fdocgrower.app.box.com/embed/s/4tgtus3ssiovtgaligncho643b3hlfy1/
Florida Department of Citrus (FDOC). 2024. Household purchase dynamics in the beverage category. Available online at https://fdocgrower.app.box.com/s/i81411zspf0wsof41wd85amkf0eb6kdi/file/1525561811677
Florida Department of Citrus (FDOC). 2024b. Imports and exports of U.S. orange juice. Available online at https://fdocgrower.app.box.com/s/dlnob852ijqxax1p4o8hpoj92hj3dxh8/folder/76156438
Ferdman, R.A. 2014. How America fell out of love with orange juice. Quartz. Available online at https://qz.com/176096/how-america-fell-out-of-love-with-orange-juice
Fernandes, W. 2003. Analyses of the world processed orange industry. PhD thesis, University of Florida, Gainesville, FL. Available online at https://ufdc.ufl.edu/fr/AA00050226/00001/images/0
Ferrarezi, R.S., K. Rodriguez and D. Sharp. 2020. How historical trends in Florida all‐citrus production correlate with devastating hurricane and freeze events. Weather 75(3): 77–83. https://doi.org/10.1002/wea.3512
Florida Agricultural Market Research Center. 2024. Research. Available online at https://fred.ifas.ufl.edu/research/florida-agricultural-market-research-center/
Florida Department of State. 2022. 20-3.005: General provisions—Florida administrative rules, law, code, register—FAC, FAR, eRulemaking. Florida Department of State. https://www.flrules.org/gateway/ruleNo.asp?id=20-3.005
Florida Farm Bureau. 2022. Florida Citrus Growers Rooted in Resilience. Florida Farm Bureau. Available online at https://floridafarmbureau.org/florida-citrus-growers-rooted-in-resilience/
Food Safety Magazine. 2023. FDA requests input on petition to amend standard of identity for orange juice by lowering brix level. Food Safety Magazine. Available online at https://www.food-safety.com/articles/8812-fda-requests-input-on-petition-to-amend-standard-of-identity-for-orange-juice-by-lowering-brix-level
Fundecitrus. 2024. Tree inventory and orange crop forecast. Available online at https://www.fundecitrus.com.br/pdf/pes_relatorios/2024_05_10_Tree_Inventory_and_Orange_Crop_Forecast_2024-2025.pdf
Gardner, J.T. and M.C. Cooper. 2003. Strategic supply chain mapping approaches. Journal of Business Logistics 24(2): 37–64. https://doi.org/10.1002/j.2158-1592.2003.tb00045.x
Gereffi, G., J. Humphrey and T. Sturgeon. 2005. The governance of global value chains. Review of International Political Economy 12(1): 78–104. https://doi.org/10.1080/09692290500049805
Grosser, J., M. Breneli, L. Liu, Y. Wang and F. Gmitter. 2023. Citrus breeding efforts to solve the brix crisis. Citrus Industry Magazine. Available online at https://citrusindustry.net/2023/07/10/citrus-breeding-efforts-to-solve-the-brix-crisis/
Hald, K.S. and M. Spring. 2023. Actor–network theory: a novel approach to supply chain management theory development. Journal of Supply Chain Management 59(2): 87–105. https://doi.org/10.1111/jscm.12296
Heng, Y., R.W. Ward, L.A. House and M. Zansler. 2019. Assessing key factors influencing orange juice demand in the current US market. Agribusiness 35(4): 501–515. https://doi.org/10.1002/agr.21596
Heng, Y., L. House and S. Yoon. 2021. Consumers’ perceptions and preferences toward Florida orange juice: FE1110, 12/2021. EDIS 2021(6). https://doi.org/10.32473/edis-fe1110-2021
Jones, M. S., L.A. House and Z. Gao. 2015. Respondent screening and revealed preference axioms: testing quarantining methods for enhanced data quality in web panel surveys. Public Opinion Quarterly 79(3): 687–709. https://doi.org/10.1093/poq/nfv015
Kaplinsky, R. and M. Morris. 2012. A handbook for value chain research. CGSpace, Repository of Agricultural Research Outputs. Available online at https://hdl.handle.net/10568/24923
Kiefl, J., B. Kohlenberg, A. Hartmann, K. Obst, S. Paetz, G. Krammer and S. Trautzsch (2018). Investigation on key molecules of huanglongbing (HLB)-induced orange juice off-flavor. Journal of Agricultural and Food Chemistry 66(10): 2370–2377. https://doi.org/10.1021/acs.jafc.7b00892
Langemeier, M. 2022. Trends in general inflation and farm input prices. Farmdoc Daily 12(56). Department of Agricultural and Consumer Economics, University of Illinois at Urbana-Champaign, Urbana-Champaign, IL. Available online at https://farmdocdaily.illinois.edu/2022/04/trends-in-general-inflation-and-farm-input-prices.html
Latour, B. 2005. Reassembling the social: an introduction to actor-network-theory. Oxford University Press, Oxford.
Law, J. 1992. Notes on the theory of the actor-network: ordering, strategy, and heterogeneity. Systems Practice 5(4): 379–393. https://doi.org/10.1007/BF01059830
Lin, F., M. Zhu and F. Chen. 2022. Conservation and development: reassessing the Florida 2070 planning project with spatial conservation prioritization. Land 11(12): 2182. https://doi.org/10.3390/land11122182
Luckstead, J. and S. Devadoss. 2021. Trends and issues facing the U.S. citrus industry. Choices. Available online at https://www.choicesmagazine.org/choices-magazine/theme-articles/trends-and-challenges-in-fruit-and-tree-nut-sectors/trends-and-issues-facing-the-us-citrus-industry
Mims, W., Wysocki, A. and R. Weldon. 2000. Understanding NFC and RECON orange juice demand. IFAS, University of Florida, Gainesville, FL. Available online at http://ufdcimages.uflib.ufl.edu/IR/00/00/18/92/00001/FE17500.pdf
Morgan, K.T., R.E. Rouse and R.C. Ebel. 2016. Foliar Applications of essential nutrients on growth and yield of ‘Valencia’ sweet orange infected with huanglongbing. HortScience 51(12): 1482–1493. https://doi.org/10.21273/HORTSCI11026-16
Morris, R.A. 2010. Structure overview of the Florida citrus industry in 2009: FE832/FE832, 3/2010. EDIS 2010(2). https://doi.org/10.32473/edis-fe832-2010
Morton Enterprises. 2018. Peeling back the orange juice supply chain! Supply Chain Game Changer. Available online at https://supplychaingamechanger.com/inside-the-orange-juice-supply-chain-video/
Moseley, K. R., L. House and F.M. Roka. 2012. Adoption of mechanical harvesting for sweet orange trees in florida: addressing grower concerns on long-term impacts. International Food and Agribusiness Management Review 15(2): 83–98. https://doi.org/10.22004/AG.ECON.127108
Muraro, R.P. 2012. Cost of Production for Processed Oranges in Southwest Florida in 2011/12. University of Florida, IFAS, Citrus Research Education Center. Available online at https://crec.ifas.ufl.edu/media/crecifasufledu/new-site/documents/research/201112---Southwest-Florida.pdf
NASA. 2005. Warm weather experiments. NASA Earth Observatory, Greenbelt, MD. Available online at https://earthobservatory.nasa.gov/features/DeepFreeze/deep_freeze4.php
Neves, M.F., V.G. Trombin, F.F. Lopez, R. Kalaki and P. Milan. 2011. The orange juice business: a Brazillian perspective. Wageningen Academic Publishers, Wageningen.
Neves, M.F., V.G. Trombin, V.N. Marques and L.F. Martinez. 2020. Global orange juice market: a 16-year summary and opportunities for creating value. Tropical Plant Pathology 45(3): 166–174. https://doi.org/10.1007/s40858-020-00378-1
NOAA. 2019. 4 hurricanes in 6 weeks? It happened to one state in 2004. Available online at https://www.noaa.gov/stories/4-hurricanes-in-6-weeks-it-happened-to-one-state-in-2004
Peterson, H. 2016. A staple of the American breakfast is disappearing. Business Insider. Available online at https://www.businessinsider.com/a-staple-of-the-american-breakfast-is-disappearing-2016-8
Ponomarov, S.Y. and M.C. Holcomb. 2009. Understanding the concept of supply chain resilience. The International Journal of Logistics Management 20(1): 124–143. https://doi.org/10.1108/09574090910954873
Pupin, A.M., M.J. Dennis and M.C. Toledo. 1999. HPLC analysis of carotenoids in orange juice. Food Chemistry 64(2): 269–275. https://doi.org/10.1016/S0308-8146(98)00095-8
Rouse, R.E., M. Ozores-Hampton, F.M. Roka and P. Roberts. 2017. Rehabilitation of huanglongbing-affected citrus trees using severe pruning and enhanced foliar nutritional treatments. HortScience 52(7): 972–978. https://doi.org/10.21273/HORTSCI11105-16
Satterthwaite, D., G. McGranahan and C. Tacoli. 2010. Urbanization and its implications for food and farming. Philosophical Transactions of the Royal Society London Series B: Biological Sciences 365(1554): 2809–2820. https://doi.org/10.1098/rstb.2010.0136
Sheffi, Y., and J.B. Rice Jr. 2005. A supply chain view of the resilient enterprise. MIT Sloan Management Review. https://sloanreview.mit.edu/article/a-supply-chain-view-of-the-resilient-enterprise/
Singerman, A. 2019. The real cost of HLB in Florida. IFAS, Citrus Research and Education Center, University of Florida, Gainesville, FL. Available online at https://crec.ifas.ufl.edu/media/crecifasufledu/new-site/documents/research/The-Real-Cost-of-HLB-in-Florida.pdf
Singerman, A. 2023. Cost of production for processed oranges in southwest Florida in 2021/22. IFAS, Citrus Research and Education Center, University of Florida, Gainesville, FL. Available online at https://crec.ifas.ufl.edu/media/crecifasufledu/economics/2021_22-SW-Costs-20220620.pdf
Singerman, A. and R. Fritz. 2021. Tree assistance program for Florida citrus greening: FE966/FE966, 4/2015. EDIS 2015(3). https://doi.org/10.32473/edis-fe966-2015.
Singerman, A. and M.E. Rogers. 2020. The economic challenges of dealing with citrus greening: the case of Florida. Journal of Integrated Pest Management 11(1): 3. https://doi.org/10.1093/jipm/pmz037
Stone, J., and S. Rahimifard. 2018. Resilience in agri-food supply chains: A critical analysis of the literature and synthesis of a novel framework. Supply Chain Management: An International Journal, 23(3): 207–238. https://doi.org/10.1108/SCM-06-2017-0201
Tetrapak. 2017. The orange fruit and its products. Orange Book. Available online at https://orangebook.tetrapak.com/chapter/orange-fruit-and-its-products
Tetrapak. 2017. Processing at the juice packer. Orange Book. Available online at https://orangebook.tetrapak.com/chapter/processing-juice-packer
Topuz, A., M. Topakci, M. Canakci, I. Akinci and F. Ozdemir. 2005. Physical and nutritional properties of four orange varieties. Journal of Food Engineering 66(4): 519–523. https://doi.org/10.1016/j.jfoodeng.2004.04.024
Trejo-Pech, C.J.O., T.H. Spreen and M.L. Zansler. 2017. Is growing oranges in Florida a good investment? American Journal of Economics 100(2): 625–639. https://doi.org/10.22004/AG.ECON.261229
Trejo-Pech, C., T.H. Spreen and L.A. House. 2018. Florida’s natural and the supply of Florida oranges: case study. International Food and Agribusiness Management Review 21(3): 437–454. https://doi.org/10.22004/AG.ECON.269671
Tucker, D., S. Futch, G. Gmitter and M. Kesinger. 1998. Florida Citrus Varieties. IFAS, University of Florida, Gainecville, FL. Available online at https://citrusagents.ifas.ufl.edu/media/crecifasufledu/citrus-agents/docs/citrus-publications/Fla-Citrus-Varieties.pdf
Tukamuhabwa, B.R., M. Stevenson, J. Busby and M. Zorzini. 2015. Supply chain resilience: Definition, review and theoretical foundations for further study. International Journal of Production Research 53(18): 5592–5623. https://doi.org/10.1080/00207543.2015.1037934
U.S. Census Bureau. 2023. New Florida estimates show nation’s third-largest state reaching historic milestone. Census.gov. Available online at https://www.census.gov/library/stories/2022/12/florida-fastest-growing-state.html
U.S. Food and Drug Administration. 2023. CFR - Code of Federal Regulations Title 21. Available online at https://www.accessdata.fda.gov/scripts/cdrh/cfdocs/cfcfr/cfrsearch.cfm?fr=146.140
USDA. 2017. USDA invests $13.6 million in citrus greening research. USDA, Washington, DC. Available online at https://www.usda.gov/media/press-releases/2017/01/19/usda-invests-136-million-citrus-greening-research
USDA-AMS. 1983. United States standards for grades of orange juice. USDA-AMS, Washington, DC. Available online at https://www.ams.usda.gov/sites/default/files/media/Canned_Orange_Juice_Standard%5B1%5D.pdf
USDA-AMS. 2023. Frozen orange juice grades and standards. USDA-AMS, Washington, DC. Available online at https://www.ams.usda.gov/grades-standards/frozen-orange-juice-grades-and-standards
USDA-ERS. 2023. Food availability (per capita) data system. USDA-ERS, Washington, DC. Available online at https://www.ers.usda.gov/data-products/food-availability-per-capita-data-system/
USDA-ERS. 2020. Retail orange juice sales rise during pandemic to highest levels in 5 years. USDA-ERS, Washington, DC. Available online at http://www.ers.usda.gov/data-products/chart-gallery/gallery/chart-detail/?chartId=98591
USDA-ERS. 2023. Price spreads from farm to consumer, orange juice not from concentrate and frozen concentrate. USDA-ERS, Washington, DC. Available online at https://www.ers.usda.gov/data-products/price-spreads-from-farm-to-consumer/
USDA-FAS. 2023. Citrus: world markets and trade. USDA-FAS, Washington, DC. Available online at https://apps.fas.usda.gov/psdonline/circulars/citrus.pdf
US-FDA. 2023. FDA seeks input on citizen petition regarding pasteurized orange juice. FDA, Washington, DC. Available online at https://www.fda.gov/food/cfsan-constituent-updates/fda-seeks-input-citizen-petition-regarding-pasteurized-orange-juice
USDA-NASS. 2021. Florida citrus statistics (2019-2020). USDA-ERS, Washington, DC. Available online at https://www.nass.usda.gov/Statistics_by_State/Florida/Publications/Citrus/Citrus_Statistics/2019-20/fcs1920b.pdf
USDA-NASS. 2002–2022. Census of agriculture. USDA-ERS, Washington, DC. Available online at https://www.nass.usda.gov/AgCensus/index.php
USDA-NASS. 2023. Florida citrus summary statistics 2021-2022. USDA-ERS, Washington, DC. Available online at https://www.nass.usda.gov/Statistics_by_State/Florida/Publications/Citrus/Citrus_Statistics/2021-22/FCS2022.pdf
USDA-NASS. 2025. Florida citrus summary statistics 2023-2024. USDA-ERS, Washington, DC. Available online at https://www.nass.usda.gov/Statistics_by_State/Florida/Publications/Citrus/Citrus_Statistics/2023-24/FCS2024.pdf
Vincent, C.I., F. Hijaz, M. Pierre and N. Killiny. 2022. Systemic uptake of oxytetracycline and streptomycin in huanglongbing-affected citrus groves after foliar application and trunk injection. Antibiotics 11(8): 1092. https://doi.org/10.3390/antibiotics11081092
Wang, H., Q. Xiang and T. Reardon. 2006. Market power and supply shocks: evidence from the orange juice market. Department of Agricultural Economics Staff Paper, Michigan State University, East Lansing, MI. Available online at https://doi.org/10.22004/AG.ECON.11508
Wieland, A. and C.F. Durach. 2021. Two perspectives on supply chain resilience. Journal of Business Logistics 42(3): 315–322. https://doi.org/10.1111/jbl.12271
Yao, S. and K. Liu. 2022. Actor-network theory: insights into the study of social-ecological resilience. International Journal of Environmental Research and Public Health 19(24): 16704. https://doi.org/10.3390/ijerph192416704
Yoon, S., M. Zansler and L. House. 2024. Inflation in orange juice prices and consumer responses: FE1142, 2/2024. EDIS 2024(1). https://doi.org/10.32473/edis-fe1142-2024
Zansler, M. and T.H. Spreen. 2021. The future of Florida’s commercial citrus tree inventory – florida citrus growers. Available online at https://www.floridacitrus.org/grower/webinar/the-future-of-floridas-commercial-citrus-tree-inventory/
Corresponding author


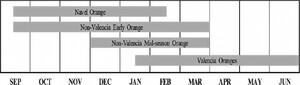
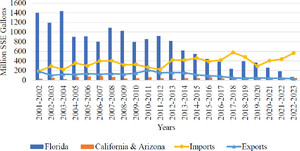


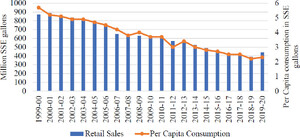


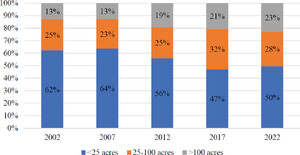

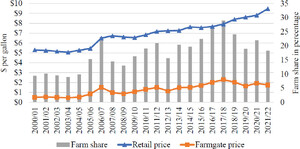


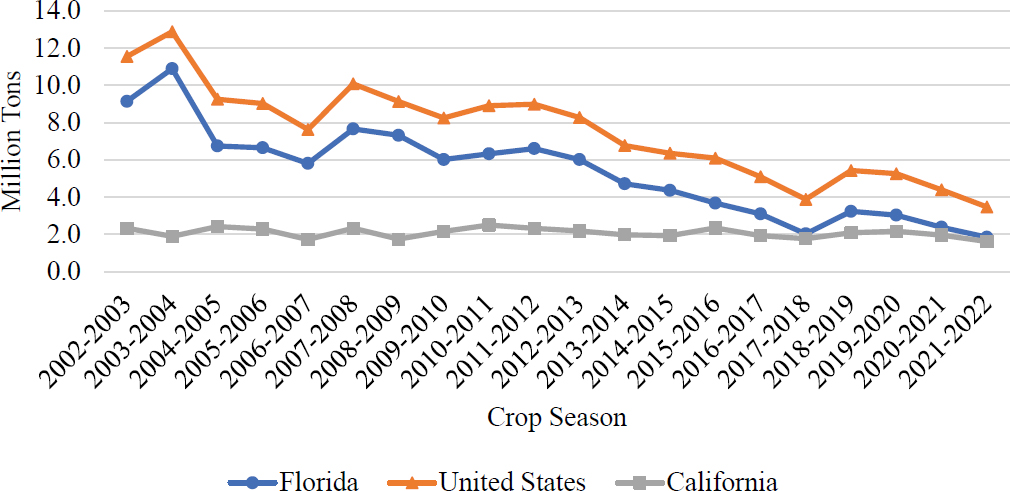
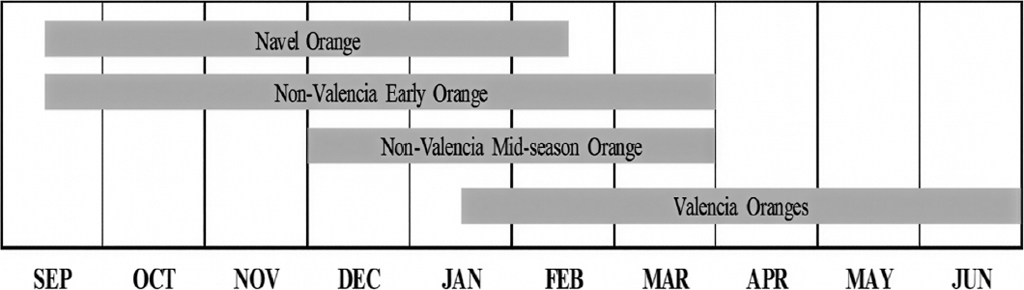
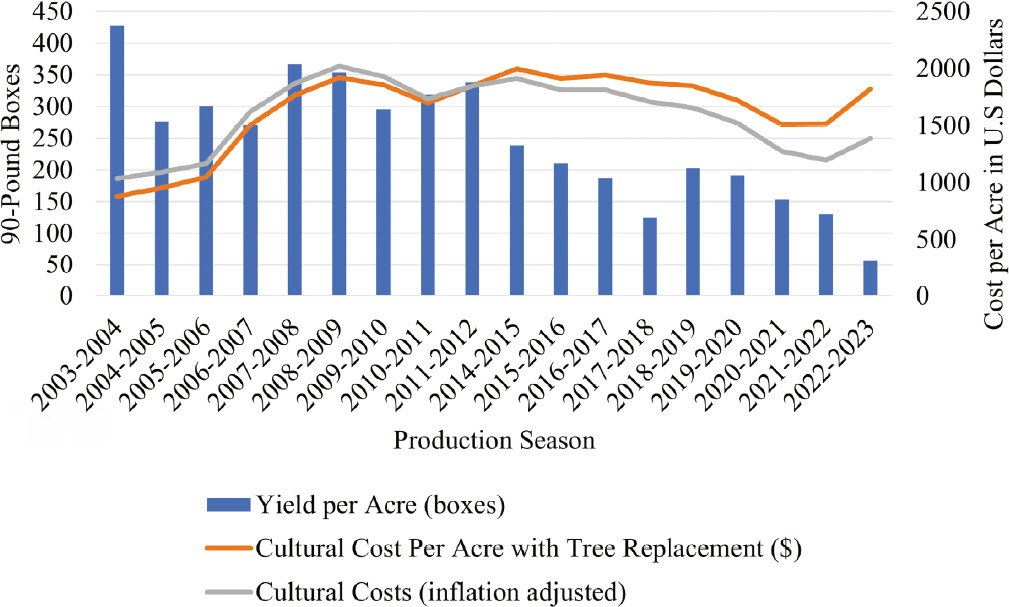
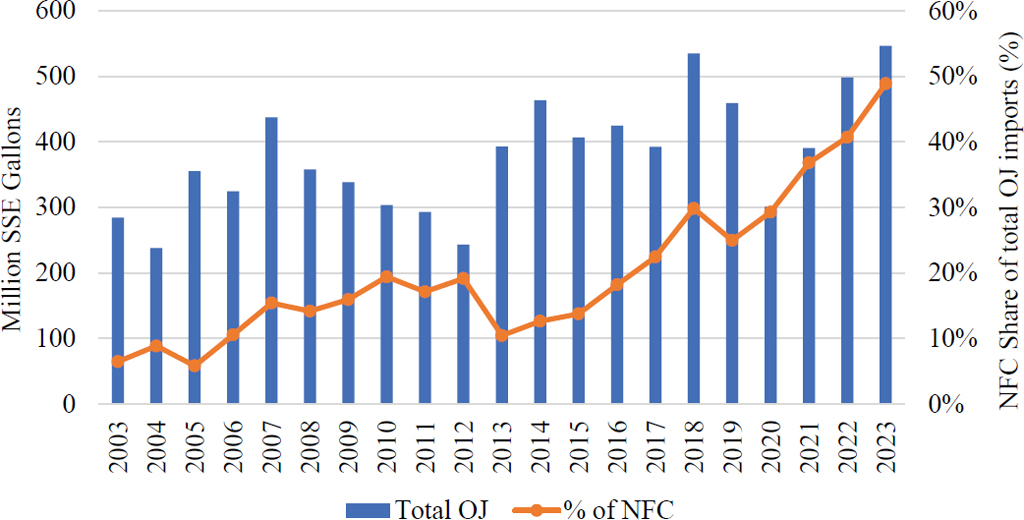
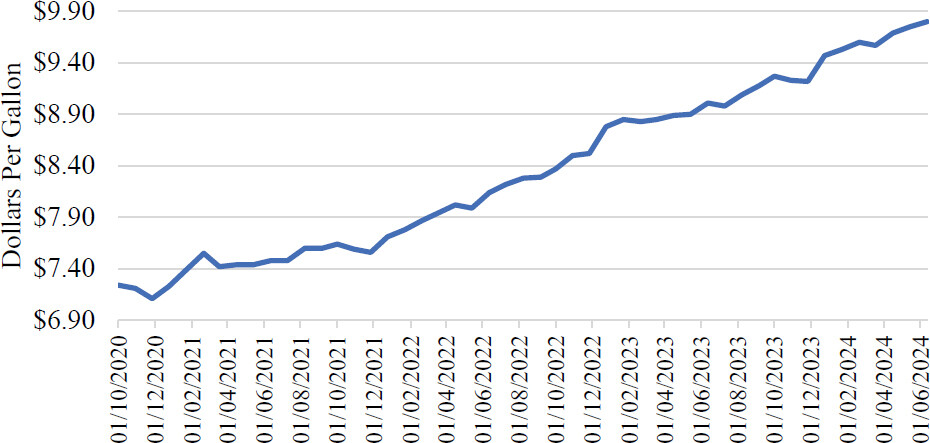
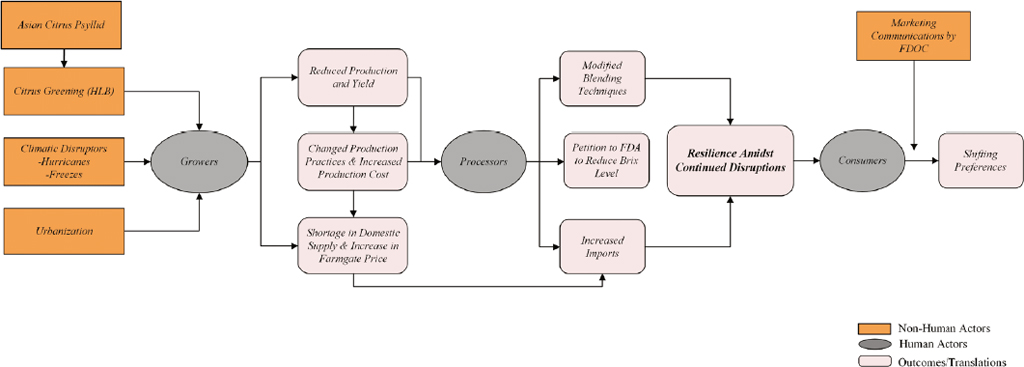