

Abstract
Growth in pet obesity levels and demand for health and wellness focused pet food creates opportunities for pet food companies to capitalize on the rising profit potential through product differentiation. Lessons from the human food industry indicate that the weight management segment of the market tends to grow fast and is characterized by high product differentiation and premiumization. Despite the recent rise in pet health and obesity studies, literature translating findings to actionable management and marketing insights in the pet food context is significantly underdeveloped. This paper bridges the agribusiness management and pet food economics literature by generating insights for informing product innovation, design, and marketing strategies of pet food companies aimed at promoting healthy weight in pets. Econometric analysis of cross-sectional data from a survey of 1173 dog owners suggests that opportunities exist for potential pet food differentiation through physical changes, perceptual changes, and associated service changes in the pet food market related to handling pet obesity. Findings highlight the potential of low-calorie and breed-specific product formulation, pre-package product design, and consumer education through conventional and digital media. The management implications and actionable insights are discussed to inform product development and marketing strategies in the context of the fast-growing pet food market.
1. Introduction
The pet food industry is a rapidly growing global industry valued at $136 billion in 2022, with expected future growth driven by rising pet ownership, increasing disposable income, and the humanization trend (pet owners view and treat pets as family) (Statista Consumer Market Insights, 2023). With over 70% of US households owning a pet, there is a growing concern about pet obesity, as overweight and obese dogs constitute over 50% of the US pet dog population (American Pet Products Association, 2021). The rise in pet obesity provides potential opportunities for pet food product differentiation aimed at weight management in pets. Similar trends in human obesity over the last several decades gave rise to product innovation aimed at weight management (e.g., low calorie, low fat, smaller portion size, etc.), which contributed to mitigating the obesity problem, creating new markets, and increasing the profit potential for human food companies. Mirroring this trend, the pet weight management market was valued at $626.99 million in 2018 and is expected to continue its growth, driven by the humanization trend and the effect of emulating human food trends in pet food (Grand View Research, 2019). Consequently, opportunities exist for pet food companies to capitalize on the growing demand for healthy weight-conducive pet food offerings.
Tapping into the full potential of the pet obesity management trend requires innovation in pet food product development and marketing strategies. The lessons from the human food industry indicate that the weight management segment of the market tends to grow fast and is characterized by high product differentiation and premiumization. For example, the U.S. human diet food and weight loss market went from an estimated $61 billion in 2010 to $135.7 billion by 2022 (Anon, 2010; Customer Market Insights, 2023; Yen and Ewald, 2012). Human food industry decision makers utilized a wide range of product differentiation strategies involving physical changes such as low-calorie and pre-portioned product emphasizing calorie count, perceptual changes e.g., addition of “healthy” and “natural” labeling, associated service changes such as consumer education and subscription services, and supply chain changes such as the incorporation of locally sourced ingredients and traceability attributes. These lessons and strategies are largely transferable to the pet food industry context and can inform pet food industry decisions on product differentiation and marketing strategies aimed at the pet weight management market segment.
An important pre-condition for designing effective pet food products and marketing strategies aimed at pet weight-management segment is the availability of research-based insights on factors that drive pet obesity. In the case of the human obesity epidemic, a significant body of literature is devoted to translating the findings from obesity research to actionable management and marketing insights; yet such literature in the pet food context is significantly underdeveloped. While there is a considerable amount of pet food production research focused on reducing calories and increasing nutritional value in product development (Hobbs Jr., 2023), these studies do not provide insights on how to effectively market and differentiate the newly developed products (Hobbs Jr. et al., 2024). Specifically, the available literature in pet health and wellness offers research-based insights on (a) promoting better management habits among pet owners, (b) developing healthier pet food product formulations, and (c) understanding the factors that influence purchasing decisions and information flow among pet owners regarding health and wellness (Avsar et al., 2017; Bartges et al., 2017; Schleicher et al., 2019). Although the latter two points provide valuable information for decision-makers in the pet food industry, they offer limited guidance on how to strategically enhance competitiveness within the pet food market. Therefore, the question remains: how can pet food industry decision makers adjust their product innovation and marketing strategies to fully capitalize on the rising profit potential in the market for pet healthy weight products?
The purpose of this study is to generate insights for informing product innovation, design, and marketing strategies of pet food companies aimed at promoting healthy weight in pets. Specific objectives include: (i) examining the feeding management factors (e.g., food type, frequency, and amount) associated with higher levels of obesity in pets, (ii) identifying the associated high-impact means and points of differentiation, and (iii) present implications for pet food innovation, development, design, and marketing of healthy weight-conducive pet food products. To achieve these objectives the study utilizes primary data obtained from a survey of 1173 dog owners in the U.S. and Canada. The theoretical framework is based on product differentiation concepts, focusing on identifying and applying means and sources of differentiation. Data is analyzed using Ordered Probit and linear regression models. The estimation results are then synthesized into actionable insights to guide the development and marketing of innovative pet food products that promote healthy weight management in companion animals and capitalize on the rising profit potential in the pet food market.
This study contributes to filling the existing gap in literature in two main ways. First, it provides actionable insight to inform decision makers in the pet food industry of ways to adjust their product innovation and marketing strategies to increase their ability to effectively differentiate. Suggested differentiation strategies are based on the rising health and wellness trend observed in the pet food market. Second, this study bridges the agribusiness management and pet food economics literature and highlights the directions for future research at the intersection of management, marketing, pet health and nutrition. Furthermore, the findings can help to increase the awareness of pet management and feeding practices to promote healthy weight in pets.
2. Product differentiation
Product differentiation states that consumers choose a product over its competitors based on factors other than price (Besanko et al., 2009). In a competitive market, product differentiation can be achieved through two methods: vertical differentiation and horizontal differentiation. Vertical differentiation refers to situations where one product is distinctly better or worse than other similar products (Lusk et al., 2011). In the pet food context, this can include a preference for premium products compared to non-premium options and/or private label versus national brand products (Hobbs Jr., 2019; Li et al., 2022). The horizontal differentiation occurs when consumers have different preferences among different product offerings, such as calorie content, competition among recognized brands, and specific attribute claims (Lusk et al., 2011). This study focuses primarily on horizontal differentiation opportunities within the health and wellness product sector of the pet food industry; a premium market sector in which heterogeneity of customer preferences exist.
Horizontal differentiation can be achieved through the means and sources of differentiation. The “means of differentiation” refers to the aspects of a product that a company can modify to enhance its perceived benefits (Hobbs Jr., 2019). These means include making physical changes to the product or packaging, perceptual change of the product offerings, improving associated services, and alterations to the supply chain (Hobbs Jr. et al., 2023). For example, a perceptual change can be accomplished through addition of a “healthy weight” label to the product packaging, creating a perceived change in the product quality and/or functionality. Sources of differentiation will also be suggested based on the potential perceived benefits that customers associate with the product as a result of changes derived from the means of differentiation (Hobbs Jr., 2019). These sources include quality, functionality, form, place, time, and ease of possession (Hobbs Jr. et al., 2023).
This study investigates the opportunities for pet food industry decision makers to horizontally differentiate their pet food product offerings through the various means of differentiation targeting the pet weight management market segment. To that end, the analysis will include two main steps: Step 1 will focus on identifying feeding management factors that are associated with higher levels of obesity in pets, and Step 2 will utilize the findings from Step 1 to generate actionable insights that can be used to guide product differentiation strategies focused on the health and wellness pet food segment. Step 2 will be based on the framework presented in Table 1 to illustrate the means and sources of product differentiation. The rows list the sources of differentiation, and the columns list the means of achieving differentiation.

Means and sources of product differentiation
Citation: International Food and Agribusiness Management Review 29, 2 (2026) ; 10.22434/ifamr1184
Based on this framework, many points-of-differentiation can be achieved by utilizing multiple combinations of means and sources of differentiation. For instance, if the results from Step 1 indicate that higher levels of pet obesity are correlated to higher calorie pet food intake, the Step 2 analysis would suggest that decision makers can potentially achieve differentiation through a physical change of their offering by introducing low-calorie products (column 1 in Table 1). In this case the sources of differentiation will include the perceived quality (row 3 in Table 1) and functionality (row 2 in Table 1). Similarly, if the results from Step 1 indicate that higher levels of pet obesity are correlated with higher feeding frequency, the Step 2 analysis will suggest an increased differentiation potential through an associated service change (column 4 in Table 1) by offering customer education on feeding guidelines, thus achieving differentiation based on ease of use. Alternatively, if the results from Step 1 analysis point at strong correlation between pet obesity and feeding portions, then Step 2 analysis would suggest a potential for increased product differentiation by offering pre-portioned packaging possibly achieving differentiation based on functionality and ease of use (row 5 in Table 1). Therefore, the question remains, “which sources and means of differentiation should be prioritized by pet food manufacturers and will likely be more effective in supporting healthy weight management in companion animals?” The answer to this question can be gained by examining factors contributing to pet obesity in the empirical analysis and results presented in Sections 4 and 5 (Step 1), which is followed by the discussion of management implications in Section 6 (Step 2).
3. Methods
3.1 Data collection
Primary data on dog body condition and feeding management behavior of dog owners that subscribed to Whole Dog Journal (a leading dog care, feeding, and training journal) are analyzed. This audience is used because it uniquely offers access to “health-conscious” pet owners who would be the likely targeted audience of health/weight management differentiated products. A health-conscious pet owner is defined as an owner who places a particular emphasis on the pet’s health/nutrition, weight, or digestion (Payne, 2021). Additionally, the Whole Dog journal audience is selected due to ease of access to a large population of 19 399 dog owners who subscribe to the journal.
A structured Qualtrics survey was administered to capture primary cross-sectional data. The questionnaire includes 31 multiple choices, open-ended, and Likert scale questions classified into five categories (dog body condition, caloric intake, caloric output, dog genetic pre-disposition, and human management factors). To provide accuracy among responses, pet owners with multiple dogs are asked to select one dog as a reference for survey responses. For uniformity among the dog selection process, pet owners are asked to refer to the dog with the name closest to the beginning of the alphabet (e.g., if the dogs’ names are Aaron and Donald, the survey should be completed in reference to Aaron). Perceived body condition scores are provided as a score based on the pictures shown below in Figure 1 in which owners are asked to indicate the picture that best reflects the current body condition of their dog. The body condition examples below are provided based on Hill’s Body Fat Index Risk Chart for Dogs (Hill’s Pet Nutrition, 2016), and Royal Canin’s Body Condition Score Chart for large dogs (Royal Canin, 2013). For the purpose of this study, the body condition classes are identified based on approaches used in previous studies where BCS=1 is considered an underweight body condition, BCS=2 and 3 is a considered normal weight, BCS=4 four and 5 is considered overweight, and BCS=6 is considered obese.
Dog body condition score.
Citation: International Food and Agribusiness Management Review 29, 2 (2026) ; 10.22434/ifamr1184
3.2 Data characteristics
There are 1173 total usable responses in the sample, representing 6% of total Whole Dog Journal subscribers. A “usable response” is defined as a survey respondent who feeds their dog a commercial dog food diet (wet or dry) and can answer all questions related to caloric intake, caloric output, and genetic pre-disposition. Examining pet owners who feed their dogs a commercial dog food diet enables examination of the dietary nutritional information, including product calories, suggested serving size, and macronutrients. Accurate dietary nutritional information of home-cooked/prepared diets was not obtained in this survey resulting in the exclusion of these pet owners from the data sample.
The respondents reported comparable sex preconditions of their dogs. Half of the sample consisted of male dogs, while the other half are female dogs. A majority of the respondents (85%) owned a fixed dog (neutered or spayed), with males accounting for 43% and female dogs accounting for 45% of the dogs that are fixed. The perceived dog body condition scores showed low response variability. Slightly more than half of the dogs (51%) had a BCS of (1), 40% had a BCS of (2), and 8% had a BCS of (3). Only 1% of the respondents reported a BCS of (4), and less than 1% reported a BCS of (5). None of the dog owners in the usable sample reported a BCS of (6). Although the variability of body condition scores is low, this is not surprising given that the population of inference includes vested/health-conscious dog owners who subscribe to a health, care, and training journal (Whole Dog Journal). These owners likely prioritize the health and well-being of the dog, resulting in more attentiveness to the dogs’ weight and body condition.
The characteristics of the pet owners consist of 89% female dog owners, 10.5% are male dog owners, with 0.5% preferring not to specify their gender. This trend is consistent with previous studies that also reported more female than male dog owners (Murray et al., 2010; White et al., 2016). Additionally, previous studies found that dog owners are generally less than 55 years old. In this study, more than 82% of respondents are above the age of 56 years old. While this age distribution is reflective of the Whole Dog Journal population, it only partially represents the pet owner population. Specifically, this study only includes 2.56% of millennial respondents (between the ages of 25–40), yet millennials are the largest share of pet owners in the United States (37%), followed by baby-boomers (27%) (Statista Consumer Market Insights, 2021; Wall, 2022). Therefore, this study provides information on baby boomer dog owners but does not fully reflect the millennial dog owner population.
3.3 Analytical model
Following a similar approach found in previous literature, dog body condition is modelled as a function of caloric intake, caloric output, and genetic pre-disposition factors. The proposed framework helps to examine dog obesity to identify the effects of factors associated with varying obesity levels in dogs with other human management (non-caloric input-based) factors being included as control variables. Special emphasis is placed on the factors related to caloric input (e.g., feeding amount, feed type, and feeding frequency), as they are more relevant and potentially influenced for pet food industry decision makers. Therefore, dog body condition is modeled as:
Citation: International Food and Agribusiness Management Review 29, 2 (2026) ; 10.22434/ifamr1184
The reported perceived body condition scores by respondents can be classified into three weight categories: underweight (BCS=1), normal weight (BCS=2) and overweight/obese (BCS=3, 4, 5). For this study, the overweight (BCS=3,4) and obese (BCS=5) categories are combined due to low variability and frequency of these categories in the data sample. High skewness is observed in the reported perceived body condition data though (Figure 2), with a majority of the scores reported in the underweight category. Research has shown that pet owners tend to underestimate their dog’s body condition score by one category compared to a veterinarian’s recommendation (Eastland-Jones et al., 2014). To address this underreporting, a weight-based body condition classification system is developed. Specifically, the reported weight of the dog and the normal weight range for each dog breed size, as provided by the American Kennel Club is utilized to identify the dog’s body condition (American Kennel Club, 2022). Based on this system, a dog is classified as underweight if its reported weight falls below the recommended weight range, normal weight if the reported weight falls within the range, and overweight if the reported weight exceeds the recommended range. Table 2 presents an example of normal weight ranges for different breed sizes, along with the corresponding classifications based on actual weights. Additionally, Figure 2 illustrates the distribution of body condition scores (BCS) using both owner-perception-based BCS and pet weight-based BCS. The pet weight-based BCS follows a normal distribution, while the owner-perception-based BCS is skewed towards underweight rankings. This suggests the presence of underreporting of dog body condition by pet owners.
Owner perception-based body condition vs. pet weight-based body condition.
Citation: International Food and Agribusiness Management Review 29, 2 (2026) ; 10.22434/ifamr1184
Body condition category classification by breed size
Citation: International Food and Agribusiness Management Review 29, 2 (2026) ; 10.22434/ifamr1184
An Ordered Probit regression model is used for empirical estimation due to the ordered categorical nature of the dependent pet weight based BCS variable, which all for proper estimation, while preserving the categorical ordering of the dependent variable (Daykin and Moffatt, 2002; Greene, 2012).
While the categorical BCS provides useful insights into a dog’s body condition, it has limitations in terms of variability and explanatory power due to the restrictive nature of the dependent variable (e.g., it can only have a value of 1, 2, or 3). To address this limitation, a weight deviation variable with a continuous range is introduced. For each dog breed size category, the average weight is calculated by computing the mean of the normal weight range. Subsequently, the mean weight is subtracted from the actual weight of the dog, resulting in a continuous weight deviation variable. The signs of the weight deviation values indicate whether the dog is overweight (positive), underweight (negative), and normal weight (weight deviation equals zero). While this method provides valuable insight regarding the difference in pounds between a dog’s actual weight and the mean weight for its breed size category, there is potential heterogeneity in the magnitude of the weight deviation for each breed size. For instance, a toy breed dog that is five pounds overweight is more concerning than a giant dog that is five pounds overweight. To address this, the weight deviation is normalized by dividing it by the mean of the breed category. This normalization accounts for the magnitude difference and provides a more accurate estimation of a dog’s weight deviation.
Two models are estimated to examine the feeding management factors correlated with perceived pet weight-based body condition (BC) and the continuous weight deviation body condition (BC). Both qualitative and quantitative explanatory variables are examined as independent variables to identify individual marginal effects on BCS levels within the dogs. Therefore, body condition is estimated as:
Citation: International Food and Agribusiness Management Review 29, 2 (2026) ; 10.22434/ifamr1184
where for observation i,
Description of Empirical Model Variables of Interest
Citation: International Food and Agribusiness Management Review 29, 2 (2026) ; 10.22434/ifamr1184
In addition to assessing the effect of total calories on body condition, the relationship between specific feeding management practices and the pet’s body condition score is also examined. Feeding frequency and treat frequency variables are included to distinguish between the effects of how often the pet is fed from what is fed (e.g., total calories). This provides further insight to assess if higher body condition is correlated with higher feeding frequency or treat frequency. The breakdown of total calories provided from feed versus that of treats is also of interest. Therefore, a treat calorie percentage variable is generated to signify the portion of calories derived from treats. To calculate this variable, the amount of treat calories provided to the dog is divided by the combined total calories. This variable is assessed as a percentage to normalize the effect of treat calories, while preventing possible multicollinearity with total calories.
Interaction terms are incorporated to control for potential correlation between explanatory variables on total calories. More specifically, an interaction of total calories per week and the binary feed based on weight variable is introduced. Because the dependent variable is the weight of the animal, it is possible that pet owners who feed based on weight alter the number of total calories based on the weight of the animal. Therefore, this combined effect is isolated to owners who feed based on weight and the number of calories they feed. Likewise, an interaction effect for pet owners who feed based on the recommendation of veterinarian (a binary variable) and total weekly calories is incorporated as the veterinarian likely provides feeding recommendations based on the current body condition of the animal. Lastly, an interaction effect is incorporated for the breed size and total calories to control the difference in feeding calories based on the size of the animal. It is likely that larger dogs are provided with more calories than smaller dogs, etc.
Both an ordered Probit model and linear regression model is estimated using the Probit and ordinary least-square (OLS) regression packages in the Stata statistical software. Following equation (2), the ordered Probit model is estimated using the pet weight-based BC dependent variable and a linear regression model is estimated using the weight deviation BC variable as the dependent variable. All results are presented and reported in the results section to follow. Marginal effects for the weight-based BC model (ordered Probit model) were estimated following Greene (2012) with standard errors estimated using the delta method. An additional robustness check for the continuous weight deviation model was estimation of a model for each breed size individually. The results of the individual breed size models (reported in Appendix B) closely resemble the findings of the pooled overall continuous weight deviation model.
4. Results
The reported parameter estimates and standard errors from the Weight-based BC (ordered Probit) and Weight-deviation BC (OLS) models are presented in Table 4. The marginal effects for the Weight-based BC regression model are reported in Table 5. The primary estimates of interest include all feeding management variables related to caloric intake (e.g., total calories, feed type, feed frequency, treat frequency, treat calorie percentage, feed based on weight, and feed based on vet recommendations). The interaction terms for total calories are also examined and compared among the two models. It is worth noting that marginal effects of the total calorie variable alone, and the interaction parameters, were significantly smaller than the other estimates. This is due to the marginal effects indicating the impact of a one-calorie change in one calorie on the outcome variable. For practical purposes, the reported parameter estimates (Table 4) for the total calorie variable and calories interaction terms have been scaled to reflect a 100-calorie change, instead of a one-calorie change.
Weight-based BC and Weight deviation BC parameter estimates
Citation: International Food and Agribusiness Management Review 29, 2 (2026) ; 10.22434/ifamr1184
4.1 Total calories and body condition
The parameter estimates for the total calorie per week variable is statistically significant and positive in the weight-based categorical model and the weight deviation model. As shown in Table 4, the parameter estimates of the Weight deviation model (OLS estimation) suggest that a 100 calorie increase in the dog’s daily diet results in a 0.7% increase in the dog’s weight deviation. Similarly, the marginal effects in the weight-based BC (ordered Probit) model, shown in line one of Table 5, suggest that an increase in total calories is associated with an increase in the probability of the dog being perceived to be in the overweight category (BCS=3) by 0.04 percentage points. The parameter estimates of the total calories and feeding based on weight (fbw) interaction term is statistically significant in the Weight deviation (OLS) model (line 8 of Table 4). Interpreting the parameter estimates of the Weight deviation (OLS) model suggests that a 100 calorie increase in the total calories provided to dogs who are fed based on weight reduces the weight deviation by 0.5%. The total calories and small breed interaction parameter estimate (line 11 of Table 4) suggest that a 100 calorie increase in the total calories provided to small breed dogs per day increases the weight deviation of the dog by 2.1%.
Weight-based BC (Ordered Probit) Marginal Effects
Citation: International Food and Agribusiness Management Review 29, 2 (2026) ; 10.22434/ifamr1184
4.2 Food type and body condition
Food type is found to be negatively correlated with body condition score in the Weight-based BC (Ordered Probit) model. The Weight-based BC model marginal effect for food type suggests that pet owners who feed wet dog food are more likely to perceive they have an underweight dog. Specifically, the Ordered Probit marginal effects for the food type variable (line three of Table 5) indicate that feeding wet food as the primary dog food type is associated with a higher probability of the dog being perceived to be in the underweight category by 16.8 percentage points and reduced likelihood of the dog being perceived to be in the normal weight or overweight categories by 8.1 percentage points and 8.7 percentage points, respectively. The findings here may arise due to the breakdown of pet owners in our sample, between those who feed wet food (6%) versus dry food (94%).
4.3 Impact of feeding based on owner perception and veterinarian recommendation
How a pet owner determines the feeding amount is correlated with the body condition of the dog. Feed amount being based on pet weight is positively correlated with a higher body condition. Specifically, the feed based on weight parameter estimate in the OLS weight deviation model (line 6 of Table 4) signals that the dog’s weight deviation increases by 7.3% when the owner determines the feeding amount based on the weight of the dog. Similarly, the marginal effects from the Ordered Probit weight-based categorical model (line seven of Table 5) indicate that owners who feed based on the recommendation of the veterinarian have reduced probability of perceiving that their dog being classified as underweight (BCS=1) and increased likelihood of perceiving their dog being in the normal (BCS=2) and overweight (BCS=3) categories. The marginal effects in the weight-based Ordered Probit model indicate owners who feed based on vet recommendation are associated with a higher likelihood of perceiving that their dog is overweight (3.5 percentage points) rather than normal weight (2.4 percentage points).
4.4 Genetic pre-disposition and body condition
Regarding the genetic pre-disposition related factors, parameter estimates for the toy and medium dog breeds variables are statistically significant and positive. The OLS weight deviation model (lines 17–23 of Table 4) results suggest that toy and medium dog breeds are associated with higher weight deviations than larger dog breeds, as expected. In the Ordered Probit weight-based categorical model (line 4 of Table 5), toy breed dogs are associated with reduced probability of being perceived to be underweight by 43.7 percentage points, whereas the associated likelihood of being overweight increases by 37.7 percentage points. The dog sex and dog intact variables had positive coefficients and marginal effects, although previous literature suggests a negative expected coefficient for both variables. Regarding dog sex, the OLS weight deviation parameter estimate (line 22 of Table 4) indicates that female dogs are associated with a 11.9% lower weight deviation than that of male dogs. Likewise, the marginal effects of the dog sex variable in the Ordered Probit weight-based categorical model (line 16 of Table 5) indicates that female dogs are associated with an 11.6 percentage point increased probability of being perceived to be underweight, and reduced probability of being perceived to be normal weight or overweight by 5.6 percentage points and 6 percentage points, respectively. These findings contradict previous literature that suggests female dogs tend to be more overweight (Usui et al., 2016). However, this study did not normalize the weight-based body condition classification by dog sex (i.e., the same weight ranges were used for female dogs as male dogs). Therefore, future research should utilize normal weight ranges of the dog breeds that are classified by dog sex to enhance the estimation findings.
5. Discussion
Integrating the empirical findings into the sources and means of product differentiation from Table 1 gives rise to several implications for potential product differentiation strategies in pet food aimed at healthy pet weight management. Specifically, the implications discussed below can provide potential direction for differentiation strategies through the various means of product differentiation to target the caloric intake factors correlated with higher dog body conditions and weight deviation percentages. It is important to note that the findings of this study are based on the results obtained from subscribers of Whole Dog Journal. While the study sample may potentially represent customers in the “health-conscious” niche market, it may not accurately reflect the overall population of pet owners in the United States. Nevertheless, pet food companies can potentially use these findings to guide future product design, innovation, and marketing strategies targeted towards “conscious” pet owners in the US.
5.1 Opportunities for differentiation through physical change
There are multiple findings in the results indicating potential opportunities for pet food decision makers to differentiate their product offerings through a physical change. First, higher food calorie diets are found to be correlated with increased likelihood of a dog being classified as overweight and obese. This suggests potential opportunities for physical change to the functionality (column 1, row 2 in Table 1) of the product through low-calorie product designs. However, given the growth in the health and wellness product offerings, pet food companies should identify ways to establish uniqueness within their low-calorie product innovations. The study also found that an increase in total calories is associated with a greater relative weight impact on small dog breeds, providing possible evidence that smaller dog breeds are more likely to be overweight or obese compared to larger dog breeds, as an additional pound of weight has a greater impact on them. Hence, potential opportunities exist for pet food companies to focus more on caloric intake for smaller dogs through smaller portion sizes or developing low-calorie products specifically designed for small breeds.
There also exists a potential opportunity for pet food companies to increase their competitiveness through product offerings and designs for specific body conditions. Specifically, the findings indicate that pet owners who feed based on weight and offer higher calories are more prevalent in dogs that are underweight. This may suggest that dog owners looking to increase their dog weight/body condition feed products with higher calorie levels, and those looking to reduce their dog weight likely provides lower calorie product options. Thus, there is potential opportunity for pet food companies to tailor product calories and portion sizes for different dog body conditions (e.g., offer food for underweight, normal weight, or overweight) to assist pet owners in determining the optimal calorie amounts to help their pet receive the desired weight/body condition level. The expected source of differentiation from this type of physical product change is the functionality (column 1, row 2 in Table 1) by offering products designed to directly impact the weight of specific dog body conditions. Likewise, it is reasonable to expect a possible change in the perceived form (column 2, row 1 in Table 1) of the product if pet food decision makers decide to alter the product sizes based on the needs of specific body conditions.
Differentiation opportunities through physical product change also potentially exist in the form of pre-packaged products. Specifically, the findings in this study suggest that dogs who are fed more frequently have lower body conditions and deviations from the suggested average weight of the dog. There is research in human food/weight-management suggesting that eating smaller meals more frequently can potentially aid in weight loss (Ma et al., 2003; Smeets and Westerterp-Plantenga, 2008). Combining the correlating effects of feeding frequency (negatively correlated with higher body conditions) and total calories (positively correlated with higher body conditions), suggests opportunities may exist for pet food companies to differentiate by offering pre-packaged low calorie product offerings, allowing pet owners to feed lower calorie meals more frequently. In doing so, this requires a physical change to the product formulation/quality and the product packaging. Therefore, the expected source of differentiation is improved changes to the product form (column 1, row 1 in Table 1), functionality (column 1, row 2 in Table 1), and quality (column 1, row 3 in Table 1).
5.2 Opportunities for differentiation through associated service change
Opportunities may also exist for pet food decision makers to potentially increase their points of differentiation through changes to the associated services offered to accompany their product (column 4 in Table 1). The results indicate that feeding frequency and wet dog food product offerings are associated with lower perceived body condition levels in dogs owned by Whole Dog Journal subscribers. Although further research is needed to confirm the robustness of the wet dog food finding, as this contradicts previous literature findings, the feeding frequency finding has been confirmed in other human food literature and pet food literature (Ma et al., 2003; Smeets and Westerterp-Plantenga, 2008). In addition, it should be recognized that the findings here are based on self-assessed perceived BCS and were not significant in the continuous weight deviation linear regression model. Similarly, the findings indicate that smaller dog breeds are more likely to have higher body conditions and/or obesity levels. Thus, pet food companies can potentially increase their associated services by offering more educational information to customers through their product packaging, attached pamphlets, and/or through their social media platforms. The increased education may not only help pet owners understand the characteristics of their feeding management and dog genetic pre-disposition to be cautious of but may also potentially signal the companies compassion for the health and safety of the pets. As a result, the expected source of differentiation from the associated service change would likely occur from a perceived change in the form (column 4, row 1 in Table 1), functionality (column 4, row 2 in Table 1), quality (column 4, row 3 in Table 1), place (column 4, row 4 in Table 1), and ease of use (column 4, row 5 in Table 1).
5.3 Opportunities for differentiation through perceptual change
Lastly, differentiation through perceptual change may also provide potential benefit to pet food decision makers. Specifically, the presence of dog owners who underreport their dog’s body condition is prevalent in this study. In the data sample, 38% of pet owners underreported their dog’s body condition compared to the weight-based body condition. Of the percentage of owners who underreported their dog’s body condition, 64% determine their feeding amount based on the weight of the dog. This signals a potential problem as it is likely that pet owners may provide inadequate amounts of food due to their misperceptions of the dog’s body condition. Although the results of the total calories and feeding based on weight potentially signals that pet owners who feed based on weight are associated with providing lower product calories to higher weight deviation (overweight/obese) dogs, and higher calorie amounts to lower weight deviation (underweight) dogs, this finding is likely specific to the “health-conscious” dog owners represented in the observed sample. Moreover, the result may be less common among the general pet owner population. Thus, there is an opportunity for pet food companies to potentially provide a perceptual change (column 2 in Table 1) in the eyes of customers of how to accurately predict their dog’s body condition. This may be potentially achieved through adjustments to the marketing of the product package to provide suggested weight ranges for the various body conditions and/or including the body condition score pictures on the packaging. Additional technological offerings can potentially assist by asking pet owners to enter their dog characteristics into an app that could then provide accurate assessment and depiction of the dog’s body condition. Such apps can also provide product recommendations to help their owner and dog achieve the desired and/or recommended body condition. Through this perceptual change, pet food decision makers can possibly achieve a source of differentiation through functionality (column 2, row 2 in Table 1) and quality change (column 2, row 3 in Table 1).
6. Conclusion
As the pet food industry continues to grow, with increasing sales and a rise in pet ownership, concerns over obesity are also on the rise. This presents a unique opportunity for pet food companies to capitalize on the growing market for health and weight management products. To do so effectively, pet food companies need to have a clear understanding of the feeding management factors that pet owners consider important and how their products can address these issues through product development, design, and marketing strategies. Therefore, the purpose of this paper is to identify the most common feeding management factors (feed type, feed frequency, feed-to-treat ratio, and total calorie intake) among underweight, normal weight, and overweight dogs, to determine which factors contribute most to dogs being overweight. By identifying these factors, implications are presented to potentially guide product development and marketing strategies of pet food companies to allow for effective differentiation in the healthy weight market of pet products.
The results of this study suggest that pet food decision makers may have opportunities to increase their unique product offerings and competitive advantage through various means of differentiation. First, the findings show a positive correlation between the calorie amount provided to dogs and their body condition, indicating potential opportunities to differentiate through low-calorie product offerings. Additionally, the results suggest that smaller dog breeds are associated with higher body conditions, possibly indicating potential opportunities to differentiate through breed-specific product offerings. The feeding frequency and dog breed parameter estimates indicates that differentiation can also be potentially achieved through associated services such as increased consumer education on proper feeding management regimens to promote healthier weights in dogs. Lastly, the findings suggest the potential for differentiation through perceptual changes, which can possibly be achieved through altered product marketing and technological advancements to assist pet owners in accurately predicting their dog’s body condition.
There are several points that should be noted when considering the generalizability of the results. First, the population of inference for this study includes dog owners who are on average more conscious of their pet’s health and well-being compared to the entire pet owner population. The underlying reasoning is that the more health-conscious pet owners will be more likely to follow health-and-wellness focused trends in the pet food market and thus will constitute an attractive target segment by pet food manufacturers pursuing differentiation based on healthy weight-conducive attributes. Second, the inherent limitation arising from the characteristics of the target population is that the variation in body condition score is relatively limited in the sample with the relatively higher proportion of normal and underweight dogs compared to the total population. These two factors can affect the extent to which the results of this study can be generalized to the entire population of pet owners. Nevertheless, the pet food industry decision makers can draw insights from the results to inform their product and marketing strategies aimed at differentiating based on healthy-weight attributes. Further studies focused on the general population of dog owners can follow the conceptual and empirical approach presented in this paper in order to extend the findings to be reflective of the entire population.
Future research should examine the differentiation strategies associated with the pathways identified in this study. Specifically, there is a need to explore if there is demand for the product differentiation strategies uncovered by this study to assess the potential profitability of the proposed approaches. Hence, further studies should examine customers’ perception, acceptance, willingness to pay, price elasticities, and potential price premiums generated by the proposed opportunities for differentiation (Hobbs Jr. et al., 2024). Combination of a willingness-to-pay study and conjoint analysis can also enhance the understanding of why customers purchase and feed certain products, and the appropriate price points for pet food companies to increase their profit potential. Additionally, there are several opportunities for future research to address the limitations of the current study and expand the modeling approach. Examination of the overall pet owner population is also suspected to address the issue of low variation in the body conditions, as reported in this study. Discrepancy between perceived body condition of the dog by the owners and the actual body condition/weight deviation of the dog are prevalent in this study. Future research should prioritize the identification and implementation of methods to improve the accuracy of assessing pet body condition.
References
American Kennel Club. 2022. Dog breeds—types of dogs. American Kennel Club, New yoerk, NY, available online at https://www.akc.org/dog-breeds/
American Pet Products Association. 2021. Pet industry market size, trends and ownership statistics. American Pet Products Association, Stamford, CT, available online at. https://www.americanpetproducts.org/
Anon. (2010). The U.S. weight loss and diet control market, 11th edn. Marketdata Enterprises, Tampa, FL, available online at http://www.marketresearch.com/Marketdata-Enterprises-Inc-v416/Weight-Loss-Diet-Control-11th-6314539/
Avsar, G., R. Ham and W.K. Tannous. 2017. Factors influencing the incidence of obesity in australia: a generalized ordered Probit model. International Journal of Environmental Research and Public Health 14(2): 177. https://doi.org/10.3390/ijerph14020177
Bartges, J., R. F. Kushner, K.E. Michel, R. Sallis and J.M. Day. 2017. One health solutions to obesity in people and their pets. Journal of Comparative Pathology 156(4): 326–333. https://doi.org/10.1016/j.jcpa.2017.03.008
Besanko, D., D. Dranove, M. Shanley and S. Schaefer. 2009. Economics of strategy. Wiley, Hoboken, NJ.
Bland, J., Mehranian, A., M.A. Belzunce, S. Ellis, C. da Costa-Luis, C.J. McGinnity, A. Hammers and A.J. Reader. 2019. Intercomparison of MR-informed pet image reconstruction methods. Medical Physics 46(11): 5055–5074. https://doi.org/10.1002/mp.13812
Bublitz, M. G. and L.A. Peracchio 2015. Applying industry practices to promote healthy foods: An exploration of positive marketing outcomes. Journal of Business Research 68(12): 2484–2493. https://doi.org/10.1016/j.jbusres.2015.06.035
Coates, A. E., C.A. Hardman, J.C.G. Halford, P. Christiansen and J.E. Boyland. 2019. Social media influencer marketing and children’s food intake: A randomized trial. Pediatrics 143(4): e20182554. https://doi.org/10.1542/peds.2018-2554
Customer Market Insights. 2023. U.S. weight loss market 2023–2032 Report CMI23228. Customer Market Insights, Austin, TX, available online at https://www.custommarketinsights.com/report/us-weight-loss-market/
Daykin, A.R. and P.G. Moffatt. 2002. Analyzing ordered responses: A review of the ordered Probit model. Understanding Statistics 1(3): 157–166. https://doi.org/10.1207/S15328031US0103_02
Eastland-Jones, R.C., A.J. German, S.L. Holden, V. Biourge and L.C. Pickavance. 2014. Owner misperception of canine body condition persists despite use of a body condition score chart. Journal of Nutritional Science 3: e45. https://doi.org/10.1017/jns.2014.25
Grand View Research. 2019. Pet obesity management market size | industry report, 2019–2026 Market Analysis Report GVR-2-68038-888-886. Grand View Research, San Francisco, CA, available online at https://www.grandviewresearch.com/industry-analysis/pet-obesity-management-market
Greene, W.H. 2012. Econometric analysis, 7th edn. Pearson Prentice Hall, Upper Saddle River, NJ.
Hill’s Pet Nutrition. 2016. Hill’s BFI Risk Chart. Available online at https://images.app.goo.gl/Y8TjBfLohSPfMJ479
Hobbs Jr., L. 2019. Analysis of customer perception of product attributes in pet food: Implications for marketing and product strategy. Master’s thesis, Kansas State University, Manhattan, KS.
Hobbs Jr., L. 2023. Essays on the economics and management of pet food. PhD thesis, Kansas State University, Manhattan, KS.
Hobbs Jr., L., A. Shanoyan, Z.Z. Wiley and G. Aldrich. 2023. Analysis of pet-food customer postpurchase experience using online customer reviews: Implications for product and marketing strategies. Agribusiness 40(4): 885–907. https://doi.org/10.1002/agr.21866
Hobbs Jr., L., A. Shanoyan and G. Aldrich. 2024. Assessing research needs for informing pet food industry decisions. International Food and Agribusiness Management Review 27: in press. https://doi.org/10.22434/ifamr2023.0004
Li, X., X. Cai and J. Chen. 2022. Quality and private label encroachment strategy. Production and Operations Management 31(1): 374–390. https://doi.org/10.1111/poms.13549
Lusk, J.L., J. Roosen and J. Shogren. 2011. The Oxford handbook of the economics of food consumption and policy. Oxford University Press, Oxford.
Ma, Y., E.R. Bertone, E.J. Stanek III, G.W. Reed, J.R. Hebert, N.L. Cohen, P.A. Merriam and I.S. Ockene. 2003. Association between eating patterns and obesity in a free-living US adult population. American Journal of Epidemiology 158(1): 85–92. https://doi.org/10.1093/aje/kwg117
Payne, J. 2021. The rise of the conscious dog owner. EarthHero, available online at https://earthhero.com/blogs/blog/rise-of-conscious-dog-owner
Rana, J. and J. Paul. 2017. Consumer behavior and purchase intention for organic food: a review and research agenda. Journal of Retailing and Consumer Services 38: 157–165. https://doi.org/10.1016/j.jretconser.2017.06.004
Royal Canin. 2013. Body Condition Score Large Dog. Available online at https://www.royalcanin.co.uk/wp-content/uploads/2017/02/BCS-chart-03.12.13.pdf
Schleicher, M., S.B. Cash and L.M. Freeman. 2019. Determinants of pet food purchasing decisions. The Canadian Veterinary Journal 60(6): 644–650.
Smeets, A.J. and M.S. Westerterp-Plantenga. 2008. Acute effects on metabolism and appetite profile of one meal difference in the lower range of meal frequency. British Journal of Nutrition 99(6): 1316–1321. https://doi.org/10.1017/S0007114507877646
Statista Consumer Market Insights. 2021. Pet ownership in the U.S. Statista, available online at https://www.statista.com/study/12971/pets-in-the-us-statista-dossier/
Statista Consumer Market Insights. 2023. Pet food report 2023. Statista, available online at https://www-statista-com.er.lib.k-state.edu/study/48838/pet-food-report/
Usui, S., H. Yasuda and Y. Koketsu. 2016. Characteristics of obese or overweight dogs visiting private Japanese veterinary clinics. Asian Pacific Journal of Tropical Biomedicine 6(4): 338–343. https://doi.org/10.1016/j.apjtb.2016.01.011
Wall, T. 2022. Millennial pet ownership generation gap grew 2018–2020. PetfoodIndustry.com, available online at https://www.petfoodindustry.com/articles/11203-millennial-pet-ownership-generation-gap-grew-2018-2020
Yen, M. and M.B. Ewald. 2012. Toxicity of weight loss agents. Journal of Medical Toxicology 8(2): 145–152. https://doi.org/10.1007/s13181-012-0213-7
Appendix
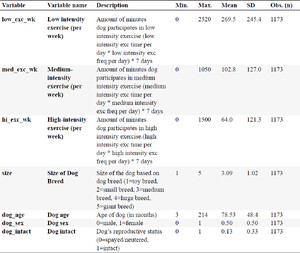
Empirical Model Control Variable Description
Citation: International Food and Agribusiness Management Review 29, 2 (2026) ; 10.22434/ifamr1184
OLS Weight Deviation Estimation Results by Breed Size
Citation: International Food and Agribusiness Management Review 29, 2 (2026) ; 10.22434/ifamr1184
Corresponding author: lhobbs@ksu.edu