Abstract
The Russian invasion of Ukraine increased a threat to food security in countries that are not self-sufficient in grain production and largely dependent on Ukrainian grain imports. The level of grain production, the stable and efficient functioning of the grain market, and the interrupted supply chain are priority levers that determine the severity of this problem. This paper explores the impacts of the war on grain production and exports in Ukraine, in particular corn and wheat as major staples. The damage done to agricultural and transportation infrastructure, accompanied by interrupted export logistics, brings new challenges for participants in the grain supply chain in Ukraine. On a daily basis, they must adjust to the new landscape and market conditions that have caused changes in crop production within the country and grain exports geography. Redirecting export routes requires rapid decision-making to identify optimal ways to increase the efficiency of the grain industry. The application of the Knowledge Graph is a solution that helps lay out the optimal path from loading point (e.g., elevators) to destination point (e.g., port) bypassing damaged or dangerous areas and entering hubs for completing or disassembling grain trains to minimize risks, time and logistics costs.
1. Introduction
Ukraine’s agricultural sector plays an important role both in the domestic economy as well as world food markets. The agricultural sector contributes on average 10% of Ukraine’s GDP. Before Russia’s invasion of Ukraine, agricultural exports accounted for 41% of budget revenue from overall exports. This increased to 53% in 2022 and 61% in 2023 due to a significant reduction in the contribution of other sectors to the national economy. Over 20% was the export of grains and legumes (State Statistics Service of Ukraine, 2024b).
In the pre-war period, Ukraine supplied almost 400 million people per year around the globe through exported agricultural products (Bioko and Bioko, 2022). During the last decade, Ukraine was an important producer and exporter of grain, oilseeds and by-products. Despite the war, Ukraine provided 42% of the world’s sunflower oil exports. Ukraine ranked fourth in corn exports and fifth in barley exports with a 15% and 8% share on international markets, respectively. Ukraine provided over 8% of world wheat exports and ranked sixth internationally (USDA, 2024). Due to significant agricultural production and export capacity, Ukraine is recognized as a guarantor of global food security.
Russian military action has limited Ukrainian agriculture through war-related damages and losses to the agricultural sector of over $80 billion (Neyter et al., 2024). Occupation of Ukrainian sovereign territories (as of March 2024), was approximately 20% or 6.9 million hectares of arable land (Nikoliuk et al., 2023). The war has damaged production facilities and infrastructure, destroyed farmland, and diverted logistics, resulting in reduced agricultural production and interruptions in domestic distribution and exports, all exacerbating food security for the Ukrainian population and import-dependent countries.
The aim of the paper is to analyze changes taking place in Ukrainian grain production and trade, as well as the challenges in grain logistics that arose due to the war and impede sufficient and uninterrupted supplies of Ukrainian grain to domestic and foreign markets, and to propose an automated method for determining the optimal grain delivery route considering existing roads, railway stations, elevators, grain volumes, loading/unloading points, destination and other parameters. Given Ukraine’s critical role in ensuring global food security, we investigated strategies to optimize the transportation of Ukrainian grain to support food supplies worldwide. This research presents a potential solution leveraging a systematic, standardized, machine-operable, and computation-ready dataset. By integrating several datasets using Knowledge Graphs in combination with optimization algorithms, a framework capable of employing heuristics to address challenges during conflict and adapting to rapidly evolving conditions was developed.
2. Methodology
Analysis of production areas, logistics within the country, and storage availability is needed to optimize grain movement within Ukraine. Production data on an oblast level were obtained from the State Statistics Service of Ukraine and Ministry of Agrarian Policy and Food of Ukraine (2024). Geospatial storage locations and capacity of elevators were obtained from sources in Ukraine (editor note, we cannot disclose the source due to the ongoing conflict). Geospatial locations of roads and railways were also obtained from sources in Ukraine (editor note, we cannot disclose the source due to the ongoing conflict).
A solution that can optimize the timing and cost of grain transportation is a sustainable path-finding application that uses the KNowledge Acquisition and Representation Methodology (KNARM) to generate Knowledge Graphs and the modified A* Algorithm to utilize heuristics in path finding (Ju et al., 2020; Zhang et al., 2023). The objective of our application is to identify alternative routes for grain transportation through hazardous and adversarial environments dynamically and on demand. Typically, grain is transported via a convoy of trucks or train, which allows us to model the routes as a series of discrete locations, such as train stations or villages. Additionally, the grain is stored in various grain elevators and collected by the convoy along the way, adding further stops. These locations can be modeled as nodes in a graph, with edges between nodes representing distances. Supporting data were processed using Python for cleaning, restructuring, and reformatting. Due to the sensitive nature of the data, all processing steps were performed using input files from domain experts.
The KNARM followed several structured steps to ensure knowledge acquisition and modeling for grain transportation in Ukraine. Initially, sub-language analysis was conducted to identify key information units and their interrelations within existing knowledge. This involved analyzing documents and reports to detect recurring patterns and concepts, with verification and refinement facilitated through consultations with domain experts. To complement this, a semi-formal, unstructured interview was held with a domain expert to capture tacit knowledge and firsthand experience. Open-ended questions were used to explore expectations for the application and to gather real-world scenarios and challenges related to grain transportation. Given the sensitivity of the data, no recordings or transcriptions were made. The process incorporated sub-language recycling, where existing standards and ontologies were leveraged to enhance knowledge representation. Relevant resources were sourced from the Semantic Web and repositories such as KnowWhereGraph (Janowicz et al., 2022), which provided valuable geospatial data including location names, coordinates, distances, classifications, and relationships.
Next, metadata creation and knowledge modeling were undertaken using formal logic, specifically Description Logic. This involved defining key elements such as classes, properties, individuals, axioms, rules, and constraints to encapsulate the essential aspects of grain transportation in Ukraine. Throughout the process, structured interviews and knowledge acquisition validation were conducted with domain and GIS experts to ensure the accuracy, consistency, and completeness of the approach. Due to the nature of the data, no database was created during this research. However, the conceptual knowledge model was transformed into an OWL (Web Ontology Language) representation using Protégé (Musen and the Protégé Team, 2015), a widely used tool for ontology development. The conversion process structured the ontology with classes, properties, individuals, axioms, rules, and constraints. A modular approach was employed, organizing the ontology by geographic regions, with a location ontology serving as a core module to define fundamental location-related concepts and relationships.
Ontology validation was performed through multiple methods, including logical reasoning, competency questions, scenario testing, peer reviews, and feedback sessions. The ontology underwent iterative refinement based on validation results, ensuring robustness and accuracy in representing knowledge for grain transportation in Ukraine.
The A* algorithm is a widely used path-finding algorithm that can find the optimal path between two locations in a graph, where each node has a cost associated with it. The algorithm works by maintaining an open set of candidate nodes, which are nodes that have not been explored yet, and a closed set of visited nodes, which are nodes that have been explored. The algorithm starts with the source node in the open set, and at each step, it selects the node with the lowest cost from the open set, moves it to the closed set, and expands its neighbors. The algorithm terminates when either the destination node is moved to the closed set, or when the open set becomes empty. If the destination node is found, then the optimal path can be traced back by following the parent pointers of each node. We used Python as implementation language (Zhang, 2023).
3. Background
3.1 The impact of the Russian war on grain production in Ukraine
Ukraine has long been known for its favorable landscape and climatic conditions for cultivating grain crops, including around a third of the world’s most fertile black soil (European Parliamentary Research Service, 2024). Therefore, one of the priority directions for the successful development of agriculture after the withdrawal from the Soviet Union was the formation of a highly efficient, competitive grain production sub-complex (Decree of the President of Ukraine, 2000; Kobuta, 2012; Program “Grain of Ukraine”, 1998, 2001, 2004, 2007). During the last several decades Ukraine maintained a significant level of grain production in volumes sufficient to meet domestic needs and build a strong export capacity. Ukraine ranks third by the arable fraction of land area, coming in at 56.8% in 2021 (World Bank Group, 2021), with 56.0% of its sown area devoted to grain crops and 31.1% to oilseed crops (State Statistics Service of Ukraine, 2022).
Prior to the outbreak of the war in 2022, despite the Russian occupation of the Donbas region and the annexation of Crimea in 2014, which led to an immediate loss of 1.4 million hectares of grain crops, Ukraine was increasing grain production due to better crop management resulting in higher yields. The 2021 grain harvest in Ukraine reached a record amount of 86 million tonnes, including 32.2 million tonnes of wheat and 42.1 million tonnes of corn. In addition, Ukraine harvested a record 22.9 million tonnes of oil seeds. In 2021, acreage under grain and leguminous crops in Ukraine was 15.9 million hectares with 9 million hectares under oil crops. In 2021, Ukraine planted 7.6 million hectares of winter cereal crops and 1.4 million hectares of winter oilseed crops for the 2022 harvest (State Statistics Service of Ukraine, 2023a,b).
As a result of territorial loss, annual crop acreage in Ukraine declined by more than 30% (Nikoliuk et al., 2023). In 2022, acreage under grain crops decreased by 3.8 million hectares due to the Russian occupation and active hostilities on farm fields. Average yields decreased by 0.81 tonnes per hectare of harvested area as a result of lower fertilizer application and seed quality, along with non-compliance with the vegetation calendar and agricultural technologies due to a shortage of agricultural machinery, fuel, and agricultural labor along with other negative factors. In 2022, total grain and legume production were 32 million tonnes below the prewar level of 2021 and 26 million tonnes below the prewar trendline projection (Figure 1).

Grain and legumes production dynamics in Ukraine 1990–2024. Source: Created by the authors based on data from the State Statistics Service of Ukraine and Ministry of Agrarian Policy and Food of Ukraine.
Citation: International Food and Agribusiness Management Review 29, 1 (2026) ; 10.22434/ifamr.1209
Crop production improved in 2023 due to favorable weather conditions that allowed farmers to obtain higher yields per hectare for all crops despite the obstacles, so that even with further reduction of fertilizer application rates (NASA Harvest, 2023a; USDA FAS, 2023; Welsh et al., 2023) and a decrease of sown areas by another 1.2 million hectares, farmers harvested 5.9 million tonnes more grain than in 2022 (State Statistics Service of Ukraine, 2024a). The average productivity of grain and legumes in 2023 was 5.5 metric tonnes per hectare, compared to 4.6 in 2022 and 5.4 in 2021 (State Statistics Service of Ukraine, 2024a).
Although Ukraine liberated some territories, not all unoccupied arable land was immediately suitable for agricultural production. Demining and remediation of soil is a complicated, expensive and time-consuming process. By October 2023, certified mine action operators in Ukraine had surveyed more than 225 000 hectares of agricultural land, identified in the Action Plan for Demining Agricultural Land as potentially contaminated with explosive objects, and had returned 170 000 hectares to economic use (Welsh at al., 2023). In 2024, Ukrainian farmers were able to plant 11.1 million hectares of grain crops, 0.3 million hectares more than in 2023. However, as of November 29, 2024, after harvesting 98% of the planted area, the average yields due to a lack of rainfall in addition to other factors were 4.97 tonnes per hectare, resulting in reduced total grain production compared to 2023 (Ministry of Agrarian Policy and Food of Ukraine, 2024b). The rapid changes in landscape and conditions suggests that being able to access and process metadata and data in computer-operable format about the different conditions surrounding grain production, transportation, and other aspects of decision-making related to farming is essential, not only for Ukraine, but also for all cases of unexpected events as well as events that may need disaster-relief response.
The major grain crops for Ukraine are wheat and corn. During the period from 2000 to 2021 Ukraine showed significant improvement in their production — wheat crops increased from 5.2 to 7.1 million hectares, while wheat harvest tripled from 10.2 to 32.2 million tonnes; corn area increased from 1.3 to 5.5 million hectares with more than a 10-fold increase in production from 3.8 to 42.1 million tonnes (Plant Growing in Ukraine, 2023). With average domestic consumption of wheat around 8 million tonnes and 6 million of corn, Ukraine was able to create substantial export supplies.
The largest wheat crops, mainly winter wheat, were grown heavily in the southeastern areas of Ukraine, which are currently either occupied or under/after active military actions or close to the frontline. During the first two years of the war, wheat area in Ukraine decreased from 7.09 in 2021 to 4.66 million hectares in 2023. In 2023, despite the lower rate of fertilizer application (State Statistics Service of Ukraine, 2024c), Ukraine had a historical record average yield of 4.64 tonnes per hectare due to favorable weather conditions (USDA FAS, 2023) that allowed growers to harvest 0.9 million tonnes of wheat more than in 2022. Lower production in 2022 compare to 2021 occurred almost in all regions of Ukraine, especially in the south and southeast (Figure 2). In 2024, wheat yields were lower than in the previous year, but were significantly higher than in 2022 (4.53 vs. 3.93 tonnes per hectare) and very close to 2021 (4.53 t/ha) (State Statistics Service of Ukraine, 2022, 2023a,b, 2024a). In 2021, the Kharkiv oblast was the leader producing over 2.8 million tonnes of wheat, followed by Zaporizhzhia (2.7 MT), Odesa (2.6 MT), Dnipropetrovsk (2.5 MT), Kherson (2.1 MT), and Mykolaiv (2.0 MT). Wartime production in these oblasts is much lower due to occupation and current or past active military hostilities. If we sum up the southeastern wheat belt of Ukraine, its production in 2021 was 17.4 million tonnes, but only 7.9 in 2024. Ukraine lost almost 10 million tonnes of production potential, which is partially now used by Russia. According to the NASA Harvest satellite analysis, Russia harvested at least 4.1 to 4.4 million tonnes of wheat from occupied Ukrainian territories in 2023 (NASA Harvest, 2023b). Although regions of Ukraine that are located closer to the western borders are trying to increase wheat production, it is difficult for those regions to compensate lost potential unless they double their yields. The Odessa oblast has become the leader in wheat production. From the point of view of logistics, this is one of the most convenient regions for growing agricultural crops due to its proximity to Black Sea ports.
Recent annual wheat production by oblast in Ukraine (million tonnes). Source: Created by the authors based on data from the State Statistics Service of Ukraine and Ministry of Agrarian Policy and Food of Ukraine using mapchart.net. Includes data from territories under Ukrainian control as of the reporting year.
Citation: International Food and Agribusiness Management Review 29, 1 (2026) ; 10.22434/ifamr.1209
Corn represents the largest production among other crops in Ukraine. However, a reduction in corn acreage has been observed in most regions of Ukraine since the beginning of the war. In 2021, Ukraine had almost 5.5 million hectares of corn, while in 2024 planted area was only 4.05 million hectares. Besides loss of the territory, another reason for this reduction is high financial losses from corn production. Prior to the war, the average profitability of corn production in Ukraine was approximately 67 USD/ton, while in 2022 farmers had losses of 18 USD/ton and 24 USD/ton in 2023 (Ministry of Agrarian Policy and Food of Ukraine, 2024c). Many Ukrainian farmers were unable to harvest corn on time in 2022 and 2023 due to shortages of equipment, fuel, electricity, labor, and money, and were forced to wait until the spring to finish harvesting with some farmers unable to finish harvest. During the subsequent seasons some farmers moved towards switching from corn to more profitable oilseed crops due to lower input costs, especially soybeans and rapeseed (Glauber, 2024). In 2022, losses from soybean production were the smallest among all other commodities, on average at 14 USD/ton, while losses from rapeseed production amounted to 22 USD/ton. In 2023, soybeans became the most profitable crop in Ukraine (69 USD/ton) followed by rapeseed (5 USD/ton) (Ministry of Agrarian Policy and Food of Ukraine, 2024c), which led to a doubling of soybean acreage from 1.32 million hectares in 2021 to 2.66 million hectares in 2024, and to rapeseed acreage increase from one million hectares to 1.27.
As a result, corn production decreased over 10 million tonnes in 2023 compared to 2021. The reduction in corn production was all over Ukraine, even in the leading Chernihiv and Poltava oblasts (Figure 3). In 2024, Ukraine was estimated to harvest around 26.2 million tonnes of corn (USDA-WASDE Report, November 2024). So far, there was a significant drop in corn yield from 7.81 tonnes per hectare in 2023 to 6.43 tonnes per hectare in 2024 (as of November 29) due to limited rainfall after June and other agrotechnological factors. With such a trend, only farmers with high crop productivity will continue to remain in the industry, and farmers who have low productivity will likely reduce their corn production, switching to other crops with higher economic returns.
Recent annual corn production by oblast in Ukraine (million tonnes). Source: Created by the authors based on data from the State Statistics Service of Ukraine and Ministry of Agrarian Policy and Food of Ukraine using mapchart.net. Includes data from territories under Ukrainian control as of the reporting year; *2024 data as of 29 November 2024.
Citation: International Food and Agribusiness Management Review 29, 1 (2026) ; 10.22434/ifamr.1209
To maintain economic viability, many Ukrainian farmers are forced to minimize their cost. Since they cannot cut expenses on rent or amortization, they cut operational expenses by reducing the application of fertilizers and plant protection, buying cheaper seed or using saved seed, and skipping some of the cultivation procedures. This ultimately will lead to a gradual loss of soil fertility, and consequently to a decrease in yields and total grain production (World Food Programme, 2024). According to the Kyiv School of Economics, with the ongoing war, further declines in grain production are expected, accompanied by losses of the financial and other technical resources for recovery (KSE, 2023). Although post-war grain production in Ukraine is projected to increase to 76.4 million tonnes (mainly attributed to corn production growth) due to agrotechnology improvement and application of advanced agricultural practices, the availability of higher-quality seed and increased affordability of fertilizers as well as the return of agricultural land to cultivation, Ukraine’s grain production recovery to pre-war (2021) levels is not expected (Bogonos et al., 2023).
Ukrainian farmers demonstrate resilience producing crops under such complicated circumstances, and Ukraine is still self-sufficient in food production. These issues are compounded by the daily danger of missile attacks leading to the destruction of physical assets, infrastructure, and human life (labor); unprofitability of crop production leading to decreased planted area and crop productivity; interruptions in logistics that complicates input supply, food delivery, and moving commodities to export; and decline in real purchasing power making food less affordable.
Since the beginning of the war, the Consumer Price Index in Ukraine increased by 44.2% as of October 2024. Food in general became 49.8% more expensive including a 47.6% rise in the cost of bread (State Statistics Service of Ukraine, 2024). More than 20% of Ukrainians are forced to save on food. The most critical situation occurs in regions close to the front line and in occupied territories where people are facing severe food insecurity. As a result, the Global Food Security Index for Ukraine declined from rank 58 to 71 (The Economist Group, 2022), below countries to which Ukraine would traditionally export food, such as Algeria, Indonesia and Tunisia.
3.2 Impact of the Russian war on grain exports from Ukraine
The grain industry is the leader of the domestic agricultural market and the entire economy of Ukraine. Ukraine’s grain production supplies domestic consumption but also supplies many countries around the world. Ukraine has become one of the main players in the international grain trade market, with increasing trends in annual production and export volumes during the last 10–15 years (Figures 1, 4 and 5).
The agricultural sector of Ukraine, and grain production in particular, is export oriented. Since Russia occupied Donbas, the most industrial region of Ukraine, and annexed Crimea in 2014, the share of agricultural exports increased from below 25% to more than 40% of total Ukrainian exports. In 2021, Ukrainian agricultural exports amounted to 27.7 billion USD. Grain exports reached 12.3 billion USD (State Statistics Service of Ukraine, 2024b), making 18.1% of total exports and 44.5% of agricultural exports (Figure 4). Although agricultural exports have decreased in monetary terms since the full-scale invasion, this decline is not as steep as in other industries. As a result, the share of agricultural exports as a percent of total exports increased in 2023 to 61%, and as of the end of 2024 it was 60%. Grain exports remain the main source of revenues for the state budget. In 2023, its share in total exports increased by 5% and is currently approaching 23%. Therefore, ensuring the development of grain production and exports, and the stable and efficient functioning of the grain markets are priority levers to determine the food security and economic stability of Ukraine in modern conditions.
The importance of grain exports in the economy of Ukraine. Source: Created by the authors based on data from the State Statistics Service of Ukraine and Ministry of Agrarian Policy and Food of Ukraine. *2024 January–December, preliminary results.
Citation: International Food and Agribusiness Management Review 29, 1 (2026) ; 10.22434/ifamr.1209
The increasing prewar trend in grain production and exports was fairly stable. A record grain export was observed in 2019, when Ukraine exported almost 57 million tonnes of grain, including 32.3 million tonnes of corn and over 20 million tonnes of wheat (Figure 5). Due to significant growth of wheat and corn production, exports increased dramatically, expanding their share of total grain exports. In 2021, these two commodities accounted for 88% of grain exports from Ukraine, and in 2022–2023 their share increased to 95% as production and exports of other commodities shrank.
Dynamics of grain exports from Ukraine, 2000–2024 (million tonnes). Source: Created by the authors based on data from the State Statistics Service of Ukraine and Ministry of Agrarian Policy and Food of Ukraine. Total grain includes wheat, corn, barley, rye, oats, rice, buckwheat, millet, and cereal groats, meal and pellets. *2024 January–December, preliminary results.
Citation: International Food and Agribusiness Management Review 29, 1 (2026) ; 10.22434/ifamr.1209
Although 2021 was an extremely successful year for Ukrainian farmers, Ukraine was unable to execute its full export potential in the 2021/22 marketing year (MY) due to the blockade of the Black Sea ports and the deterioration of logistics from the outbreak of the war. In 2021, Ukraine exported 50.8 million tonnes of grain while in 2022 it was 38.5 million tonnes of grain (24% less), including 11.2 million tonnes of wheat (44% less than in 2021). As the result, Ukraine accumulated significant ending stocks (Tables 1 and 2) that caused a shortage of domestic grain storage capacity for the 2022 harvest, as well as a shortage of grain supply on the world market that led to an immediate price spike. Wheat prices increased by 28% during the early phase of the war (Devadoss and Ridley, 2024), while corn futures prices were up by 16% (Carter and Steinbach, 2024), inducing food inflation and threatening consumer welfare particularly for vulnerable populations.
Supply and demand balance of wheat in Ukraine (× 1000 tonnes).
Citation: International Food and Agribusiness Management Review 29, 1 (2026) ; 10.22434/ifamr.1209
Supply and demand balance of corn in Ukraine (× 1000 tonnes).
Citation: International Food and Agribusiness Management Review 29, 1 (2026) ; 10.22434/ifamr.1209
USDA WASDE (2025) reports have minor discrepancies with statistical data from the Ukrainian government, but they reflect the general trends in the supply and demand balances of grain in Ukraine. Due to limited export capabilities and disrupted domestic logistics, Ukraine accumulated four times larger ending stocks of wheat and nine times larger ending stocks of corn in 2021/22MY compared to 2020/21 MY. Although Ukraine demonstrated higher exports in 2021/22MY, it is important to note that around 90% was carried out before the outbreak of war. In 2021/22MY, Ukraine had been expecting to export 65.5 million tonnes of grain, including 25.3 million tonnes of wheat and 33.8 million tonnes of corn (Ministry of Agrarian Policy and Food of Ukraine, 2022). As a result of the war, Ukrainian grain export in 2021/22MY decreased compared to its potential by 6.5 million tonnes for wheat and by 6.8 million tonnes for corn.
Since Ukraine regained control over some southern territories as well as started redirecting export flows, Ukrainian grain exports have increased to 44.8 million tonnes in 2023, including 16.2 million tonnes of wheat and 23.4 million tonnes of corn (State Statistics Service of Ukraine, 2024b). Grain exports in 2024 exceeded 2023 by 9 million tonnes. (Ministry of Agrarian Policy and Food of Ukraine, 2024a).
Logistics issues and diversification of transportation affected the geographical structure of Ukrainian grain exports. Before the war China, Egypt and Indonesia were the main importers of Ukrainian grain (11.7, 4.7 and 2.6 million tonnes, respectively, in 2020/21 MY). With the beginning of the war, these countries significantly decreased buying grain from Ukraine (5.9, 3.0 and 0.5 million tonnes, respectively, in 2022/23 MY) (State Statistics Service of Ukraine, 2024b). Due to blocked ports, many countries in Africa and Asia were unable to receive grain from Ukraine, causing food security concerns (Hassen, 2024). Instead, many European countries such as Romania, Poland, Italy, Hungary, Germany, Portugal, and Slovakia, appeared on the list of top importers from Ukraine. Traditionally, Europe was Ukraine’s competitor in the global grain market, but under war circumstances they eliminated tariffs and opened borders for free trade with Ukraine. The European market became oversaturated with cheap Ukrainian grain rapidly, and five countries (Poland, Bulgaria, Hungary, Romania and Slovakia) imposed a ban on the import of agricultural products from Ukraine (European Commission, 2023), which affected the volumes, structure and routes of Ukrainian exports.
Türkiye, being a negotiator of UN Grain Initiative, received priority and discount for grain purchase and tripled their import from Ukraine (from 1.9 million tonnes in 2020/21 MY to 5.8 in 2022/23 MY). Romania became the leader among Ukrainian grain importers in 2022/23 MY due to the increase in transshipment through the Danube River ports, buying 8.2 million tonnes of grain compared to 19 000 tonnes in 2020/21 MY, followed by Spain with 6.2 million tonnes compared to 2.3 million tonnes in 2020/21 MY (State Statistics Service of Ukraine, 2024b). For the most part, this grain was re-exported, creating additional pressure on world grain prices.
In 2023/24 MY, Spain became the main buyer of grain products from Ukraine (12.4 million tonnes), which was double compared to the previous MY and five times more than before the war, and it continues its leading position in 2024/25 MY (4.1 million tonnes during July–December 2024). Egypt and Indonesia are returning to the Ukrainian market after switching to the Russian market. With the resumption of operations at the “Big Odessa ports”, more grains are being shipped through the Black Sea to other countries in Africa and Asia (State Statistics Service of Ukraine, 2024b). However, export logistics are very fragile since there is no guarantee that the infrastructure of Ukrainian Black Sea ports or ships transporting grain will not be subject to other missile strikes (USDA-FAS, 2024). Therefore, grain cargo insurance remains quite high. The cost of cargo insurance in the Black Sea ports of Ukraine in the pre-war period was on average 0.75–1% of the cost of the cargo. At the beginning of the operation of the grain corridor this increased to 3–4% and later declined to an average 2% (Forbes, 2023), and is expected fall back to 0.75–1.25% with the introduction of the new mechanism “Unity Facility” for insuring cargo ships against war risks (The Cabinet of Ministers of Ukraine, 2023).
4. Results and discussion
4.1 Grain storage capacities and logistics
At the beginning of the war, one of the biggest concerns for stabilizing grain markets in Ukraine was loss of the storage capacity needed for the 2022 harvest. Prior to the war, Ukraine had around 57 million tonnes of grain storage capacity comprised of 1,355 grain storage facilities, and by May 2022 only 44 million tonnes were available (Elevatorist, 2022). In the latest war damages report, it was estimated that 3.3 million tonnes of grain storage capacity were partially damaged as of the end of 2023. Approximately 11.3 million tonnes of storage capacity were fully destroyed due to the invasion, resulting in a 19.5% reduction in Ukraine’s grain storage capacity, without considering storage facilities that remain structurally intact but are inaccessible due to occupation (Neyter et al., 2024). At least 165 elevators with an approximate storage capacity of 5.2 million tonnes are located in the occupied territories, and their condition is unknown. The biggest losses of grain storage capacities are in liberated Mykolaiv oblast (848 000 tonnes) and Kharkiv oblasts (500 000 tonnes). However, grain storage facilities sustain damages even at relatively far distances from the front line as they can be targets for missile strikes. Therefore, most foreign donors refrain from investing in new elevators and prefer to use plastic grain bags, which is a temporary solution (Ministry of Agrarian Policy and Food of Ukraine, 2024d; United Nations Ukraine, 2022; Vashchenko, 2025).
Ukrainian grain market players are adjusting to the current circumstances. Some elevators damaged by shelling resumed their work while others lost their efficiency due to location features, given their proximity to the front line, as well as changes in the volume and structure of agricultural production in different regions and redirecting logistics routes. At the same time, new storage facilities were built in the relatively safe regions, where grain production has been increasing, and in the regions closer to the Western border. During the first two years of the war (February 24, 2022 to March 2024), Ukraine’s elevator capacity increased by 2 million tonnes. Some elevators were built from scratch while some capacity was added at already operating enterprises including approximately 65 new or upgraded facilities (Elevatorist, 2024a). Also, several additional transshipment terminals were built on the border with EU countries, such as the Vadul-Syret terminal in Chernivtsi oblast, intended to provide convenient railway logistics to the Romanian port of Constanta (Elevatorist, 2024b); the Chornotisiv Terminal in Transcarpathian oblast, which due to its proximity to the border and unique location has the opportunity to supply commodities by rail to three neighboring countries — Romania, Hungary and Slovakia (Transport Corridors, 2024.); and Mostyska dry port in Lviv oblast on the border with Poland, which has the ability to receive grain from trucks, grain wagons, semi-wagons, and containers and to transload it to European standard wagons (Container Terminal Mostyska, 2024). Currently, grain storage facilities with capacity of 49.3 million tonnes are in operation in the country in all regions. Temporarily lost, non-working or damaged capacity is estimated at 8 million tonnes. The current net loss of grain elevators is about 115 units (Elevatorist, 2024a).
Ukraine has an advantageous geographical position: access to the Black and Azov seas as well as to three large rivers — the Danube, the Southern Bug and the Dnipro. Additionally, Ukraine has an extensive railway system connected to linear transfer elevators capable of transshipping 715 000–730 000 tonnes of grain per day and to port terminal elevators with a capacity of unloading from the railway at a rate of 200 000 tonnes per day (Sedikov, 2018). Together with significant grain production that several times exceeds domestic consumption, this has created a large export capacity for grain transportation using various logistics schemes.
Prior to the war, around 90% of Ukrainian grain was exported via seaports, about 6 million tonnes per month on average (United Nations, 2024). Total export capacity of Ukrainian sea ports had been close to 8 million tonnes of grain per month. The railway assured transshipment of only 200–300 000 tonnes of grain monthly. The limited capacity of land border crossings operating in the west is conditioned by different track gauge (1435 mm in Europe and 1520 mm in Ukraine). There are only two options for transshipping grain by rail to Europe: reloading from Ukrainian railcars into European ones or swapping rail carriage by removing Ukrainian wheel sets and installing European ones. Both options have limitations due to the limited number of European railcars and wheel sets as well as the limited capacity of transshipment terminals at the borders. The average daily transmission of grain cargoes at the western border crossings (Figure 6) is another heuristic that the KNARM can reuse to reach the optimal paths. Even with replaced rail carriage, Ukrainian railcars can move in Europe only along certain routes, as they are wider and difficult to maneuver. In addition, even before the war, Ukrainian railways had a number of infrastructure issues, such as insufficient locomotive traction resulting in lowered turnover of grain cargos, shortage of grain cargos (deficit of 2000–3000 units), significant level of infrastructure deterioration, and low efficiency in organizing the transportation process, in particular due to an insufficient level of routing (Sedikov, 2018).
Average daily transmission of grain cargoes at the western border crossings (Hungary, Slovakia, Romania, Poland), grain railcars per day. Source: Compiled by the authors based on data of Ukrainian Railways.
Citation: International Food and Agribusiness Management Review 29, 1 (2026) ; 10.22434/ifamr.1209
After the full-scale Russian invasion of Ukraine on 24 February 2022, agricultural exports were interrupted due to the Russian blockade of the transportation of agricultural products through the Black and Azov seas as well as damage to roads, railways and hubs, bridges, and other transport infrastructure. Complications with seaport logistics forced Ukraine to develop alternatives for grain export. Railway systems and the Danube River became the main means of grain transportation (Countryman, 2024). By September 2022, Ukraine was able to export monthly more than 1000 tonnes of agricultural products via rail through its western borders (Ministry of Agrarian Policy of Ukraine, 2024a)
Since August 2022, three Ukrainian ports (“Big Odesa ports”: Odesa, Pivdenny and Chornomorsk) have resumed operations within the framework of the Black Sea Grain Initiative in partnership with the UN and Türkiye. Due to the unblocking of these ports, it became possible to achieve relatively good export results in 2021/22 MY, even though they were not used at full capacity. The highest level of agricultural exports from Ukraine was reached in March 2023, including 5.8 million tonnes via ports with a third of this total delivered through the Danube River ports (Figure 7).
Transportation breakdown of Ukraine agricultural commodity export shipments, 1 March 2022– 31 December 2024 (million tonnes). Source: Compiled by the authors based on data of Ministry of Agrarian Policy and Food of Ukraine and Ministry of Infrastructure of Ukraine.
Citation: International Food and Agribusiness Management Review 29, 1 (2026) ; 10.22434/ifamr.1209
The increase in grain export from the Danube region contributed to the transformation of the region from depressed to attractive for domestic and foreign investment such as the World Bank (U.S. Embassy in Ukraine, 2023) and the European Bank for Reconstruction and Development (Ministry for Communities and Territories Development of Ukraine, 2023). Port road and rail transport capacity has been significantly increased, and new private terminals and logistics centers have been opened. Nibulon, the leader among grain exporters from Ukraine, constructed the “Bessarabian Branch” transshipment complex in Izmail, which includes storage capacities supplemented with equipment for reloading grain from railcars, containers and trucks to barges (Nibulon, 2024). They also managed to transfer part of their fleet from the blocked Mykolaiv Black Sea port to the Danube River (Centre for Transport Strategies, 2024). However, logistics to the Danube River ports are still quite complicated considering only one direct road and one railroad via one bridge exists over the Dniester estuary (Salin, 2024). An additional solution is transit through the Palanca border crossing point in Moldova (UkrAgroConsalt, 2022).
Such complex logistics and low throughput keep freight prices from Danube River ports higher than from Black Sea ports (Fernandes et al., 2023), especially during periods when the operation of the “Big Odesa ports” was interrupted and demand from the grain shippers for using Danube River ports elevated (Figure 8). The Black Sea Grain Initiative, which was in effect until mid-July 2023, increased Ukrainian exports, easing storage constraints, but the logistical costs remained high, putting pressure on farm gate output prices. Freight rates began to decrease only after the Ukrainian humanitarian grain corridor stabilized its operations (Salin, 2024).
Freight rates for grain transportation by coaster vessels to the Sea of Marmara (operational market rate range) (USD/t). Source: Compiled by the authors based on data of APK-Inform and Atria Brokers.
Citation: International Food and Agribusiness Management Review 29, 1 (2026) ; 10.22434/ifamr.1209
Another significant component of transport logistics and the cost of grain for export is the cost of transportation either to ports or to/across the land border crossings. The total cost of grain transportation via Ukrainian Railways considers all types of payments and includes: transportation tariff (infrastructural component) — 75–78% of total cost; the cost of using grain railcar during transportation (varies depending on the number of days of use) — 18–20%; compensation for empty grain railcar mileage; the cost of two days’ use of grain railcars during loading/unloading; additional station fees and payments at the departure and destination stations, etc. The cost of transportation is calculated for each individual shipment depending on the type of commodity, its weight/volume, destination, and distance between the loading and unloading points. In 2021, the cost of transporting 1 ton of grain using Ukrainian Railways railcars was in a range from 10 to 25 USD despite the destination (Figure 9). With the outbreak of war, due to the heightened demand for rail transport and its limited capacity, the cost of transporting grain increased. It is noteworthy that during the operation of the Black Sea Grain Initiative, the cost of grain transportation towards land borders was much more expensive. The cost of transporting corn and wheat follows the trend, but transshipment of wheat is slightly cheaper. With the opening of the Ukrainian humanitarian grain corridor, the cost of rail transportation has decreased and stabilized. According to the Ukrainian Railways (Tkachov, 2024), in 2024, average costs of railway logistics for grain export were 15 to 17 USD per ton. Unfortunately, due to the war, public access to official railway statistics is limited, which limits the ability to use the cost data.
Dynamics of the average cost of transporting 1 ton of grain for export by Ukrainian Railways railcars in 2021–2023 (USD/t). Source: Compiled by the authors based on the data of Ukrainian Railways.
Citation: International Food and Agribusiness Management Review 29, 1 (2026) ; 10.22434/ifamr.1209
According to the Black Sea Grain Initiative Joint Coordinator Centre, a total of 32.8 million tonnes of grain were delivered from Ukraine within the Initiative, including 16.9 million tonnes of corn (51.4%), 8.9 million tonnes of wheat (27.1%), 1.9 million tonnes of sunflower meal (5.6%), 1.6 million tonnes of sunflower oil (5%), 1.3 million tonnes of barley (3.9%), and 1.1 million tonnes of rapeseed (3.4%). About 725 000 tonnes of grain were delivered within the World Food Programme to countries suffering from famine, among them 36% were directed to Ethiopia, 21% to Yemen, and 18% to Afghanistan. The geography of the Black Sea Grain Initiative was very diverse. Almost 8 million tonnes, or a quarter of all grain shipped via the grain corridor, was delivered to China. This figure is mostly corn, but this is about two times less than Ukrainian prewar grain exports to China. Six million tonnes of grain were supplied to Spain, 3.2 million tonnes to Türkiye, 2.1 million tonnes to Italy, and 1.6 million tonnes to Egypt. In total, 46% of grain went to Asia-Pacific region, 41% to Europe and 12% to Africa.
The redirection of export routes has helped to reduce the risk of food crisis for import-dependent countries. However, this has posed a new challenge for the Ukrainian transport system – making internal logistics more important for new grain flows and nimble for rapid changes in case of disruptions to routes to ensure uninterrupted and efficient grain delivery from the fields and elevators to final consumers. The blockades of the Black Sea ports and restrictions on the grain imports from Ukraine to EU immediately reflected in the routes of railway transportation of grain for export. As seen in Figure 10, port and railway usage are changing every month and decision making is required based on new data, regulations, and obstacles. Furthermore, obstructions to the existing paths are another condition to be considered for decision making and alternative path finding, which shows the need for the framework built as part of this study.
Dynamics of grain cargo transportation for export via Ukrainian Railways to different directions (million tonnes). Source: Compiled by the authors based on the data of Ukrainian Railways and Tkachov (2024).
Citation: International Food and Agribusiness Management Review 29, 1 (2026) ; 10.22434/ifamr.1209
Currently, the “Ukrainian humanitarian corridor” for grain export has been operating stably for almost a year, and monthly volumes of grain transportation in 2024 significantly exceeded earlier wartime levels. Roughly 39.7 million tonnes of grain were transported by Ukrainian railway in 2024, which is 29.8% more than the previous year, including 34.1 million tonnes (+ 50.2% compared to 2023) transported for export (29.2 million tonnes in the direction of ports, 4.9 million tonnes through land border crossings). This is a record volume of grain transportation for export by rail (Tkachov, 2024). Over 10 months of 2024, the Ukrainian Railway more than doubled grain transshipment to ports compared to the same period of the previous year, but transshipment to land-border crossing decreased, although it significantly exceeds the pre-war level (Table 3).
Volumes of grain cargo transportation via Ukrainian Railways in all modes of transportation (× 1000 tonnes).
Citation: International Food and Agribusiness Management Review 29, 1 (2026) ; 10.22434/ifamr.1209
Although Ukrainian Railways managed to transship 1.7 million tonnes more grain in 2023 than in 2022, and exceed in 2024 the 2021 level, it did not reach the monthly volumes of August–December 2021 (Figure 11) due to the loss of railway capacity in the occupied territories, significant damage to infrastructure and the constant danger of operation in the frontline regions.
Dynamics of total grain cargo transportation volumes via Ukrainian Railways in 2021–2024 (million tonnes). Source: Compiled by the authors based on the data of Ukrainian Railways and Tkachov (2024).
Citation: International Food and Agribusiness Management Review 29, 1 (2026) ; 10.22434/ifamr.1209
Given the constant threat of destruction of grain elevators or damage to railway tracks, hubs and bridges, it is important to generate machine-operable dataset of all available connections between grain storage facilities and the Ukrainian Railways systems to ensure finding of optimal path not only under regular conditions, but also finding the best alternative path when the optimal path is interrupted.
4.2 Knowledge Graphs for improving grain supply
To address the need for systematically standard transportation metadata and data in the rapidly changing environment in Ukraine, a sustainable path-finding application grounded in Knowledge Graphs (KGs) was developed. By leveraging KGs that integrate diverse data sources with semantic rigor and align with W3C (World Wide Web Consortium) standards, the application ensures explainability, interpretability, and provenance tracking (Zhang et al., 2023). The application optimizes the timing and cost of grain transportation by employing established KNowledge Acquisition and Representation Methodology (KNARM) to generate Knowledge Graphs and incorporating a modified A* algorithm to navigate hazardous and adversarial environments.
As described above, grain transportation, typically occurs domestically via convoy or train, is modeled as a Knowledge Graph, with nodes representing discrete locations such as train stations and grain elevators, and edges representing paths between them. The scattered nature of grain storage introduces dynamic stops as convoys collect grain along their routes. This brings the need to use an approach that allows optimizing these routes based on various factors (i.e. heuristics) rather than a simple distance-based approach. Therefore, given the hostile and variable conditions, the Modified A* algorithm, rather than the traditional Dijkstra algorithm (Dijkstra, 1959), was chosen (see Appendices for the detailed descriptions of Dijkstra’s algorithm as well as the Modified A* algorithm). A* is a graph traversal and pathfinding algorithm that is used in many fields of computer science due to its completeness, optimality, and computational efficiency. The Modified A* algorithm incorporates dynamic heuristics that adjust edge weights in real time based on external factors, enabling the system to adapt to rapidly changing environments while ensuring efficiency and safety in transportation planning.
When using rapidly changing data in computational approaches and applications, another challenge becomes ensuring that the format of data is consistent and readily usable. To ensure that the Modified A* algorithm can be estimated, a KG-based approach is used to encode data in a machine operable and standardized way. This approach was chosen because KGs enable integration across diverse data sources with semantic rigor, adhering to established W3C standards (W3C, 2023). This structure not only bridges human understanding and machine interpretation, but also leverages a robust standard for provenance tracking (Lebo et al., 2013), making derived results inherently explainable and interpretable. These benefits are further enhanced by systematic knowledge acquisition approaches, such as the KNARM (McGinty, 2018) that can mitigate bottlenecks in knowledge capture and domain expert knowledge integration. This capability is valuable in times of crisis, when disparate sources provide intelligence through various means – from geospatial observations to social media, or even word of mouth, all of which aim to provide real-time intelligence.
To further elaborate the approach, it is a combination of using a KG with an optimization algorithm which allows pathfinding based on heuristics (i.e. factors that can be considered restrictions) that the domain expert or the incoming data can provide dynamically. While the algorithm itself can provide answers, the KG backend allows a formal, computer-operable format to aid the system for rapid response when faced with changes, which offers a dynamic approach because of the standardized representation of the data in the back end.
A number of approaches already exist for modeling these diverse data types (Hogan et al., 2021), in addition to the established Knowledge Graphs for environmental and situational awareness. We used KNARM as our methodology to implement and integrate the KG because it uses a domain-agnostic approach that helps build KGs to be used in applications better. This systematic approach would allow to change crop types or heuristics for the algorithm faster because of the formal annotation the knowledge using the KG.
To integrate these incoming data streams and leverage the existing knowledge bases, we apply the KNARM framework. This methodology has the following steps (Figure 12) applied in an agile way: Sub-language Analysis, In-House Unstructured Interviews, Sub-language Recycling, Metadata Creation and Knowledge Modeling, Structured Interviews, Knowledge Acquisition Validation, Database Formation, Semi-Automated Ontology Building, and Ontology Validation. The methodology and details of the steps followed are further explained in the appendices. The methodology guides the domain experts and knowledge engineers in constructing consistent and concordant ontologies and Knowledge Graphs that formalize domain-specific data in a systematic, modular, and systematically detailed manner. KNARM helps to acquire and represent knowledge in a semi-automated way, keeping the domain experts in the loop in an agile fashion with the interview and knowledge validation steps while allowing for updates to rapidly changing data and efficient ontology updates through its semi-automated ontology building process. This also helps update the KGs in situations where data and the restricting factors (heuristics) change rapidly, such as the Ukraine’s grain transportation scenario. Using KNARM, we can also draw from disparate databases and ontologies, integrating them in a way that is both human- and machine-comprehensible by merging human expertise with machine capabilities.
The steps of KNARM used to generate the KG for this research. Source: McGinty (2018).
Citation: International Food and Agribusiness Management Review 29, 1 (2026) ; 10.22434/ifamr.1209
For this research, there is a need to integrate heuristics. Heuristics in this study include factors such as grain storage capacity, road conditions, preferred transportation hubs, and costs that may be associated with them. Data collection, which involved the assistance of domain experts, required careful handling in multiple files. Using Python, data were cleaned, restructured, and reformatted to maintain their sensitivity, performing these operations in real time on expert-provided files. We then implemented a Modified A* algorithm to these reformatted data to improve optimal pathfinding, utilizing the heuristics to optimize outcomes. Given a weighted graph, a source node and a goal node, the algorithm finds the optimal path from source to goal.
The computational tool stack was used because leveraging KGs generated through the KNARM, combined with the A* algorithm offers a novel method for establishing a reliable source of truth within KGs while allowing rapid changes to the dataset and the structure of the data using the flexibility of Knowledge Graphs. This also enables the swift integration and querying of new variables that must be considered when determining optimal paths, particularly in conflict-affected areas.
The dataset represented using knowledge graphs allowed the data to be machine readable that allowed us to reuse this data for other applications, such as Geographic Information Systems (GIS) applications (Figure 13). The nodes in the knowledge graph represented the railway stops, ports, and grain elevators were mapped to the GIS application that was used to layer more information, such as crop cover and tree cover. The prewar railway system (DIVA-GIS, 2021) and grain storage facilities locations in Ukraine were taken as a basis. They are shown along with prewar generalized land cover (Zanaga et al., 2021) to provide further opportunity to optimize grain transportation paths according to the shifting grain production in a particular region. Many of the depicted infrastructures have been impacted by the war, especially toward the eastern front. While most of Ukraine is used for cropland, this too has been impacted toward the east, which is home to some of Ukraine’s densest cultivated areas. The remaining operational ports, which themselves operate intermittently as war conditions allow, were added to the dataset as the prevailing final destination for grain transshipment for export.
Ukrainian crop cover, adverse land holdings, grain storages and railway transportation pathways. Source: Created by authors.
Citation: International Food and Agribusiness Management Review 29, 1 (2026) ; 10.22434/ifamr.1209
Railway station and elevator locations were incorporated into the KGs to identify all possible connections between the nodes within the country. Based on these connections, KNARM combined with the A* algorithm, machine computes an optimum path between any desired endpoints while considering “must pass” locations if needed. Figure 14 shows a graphic visualization of selected locations representing a partial region of Ukraine. This example is intended solely for demonstration purposes of the algorithm, with locations and distances being modified to suit the simulation without revealing real data for security reasons. Each node represents a location, and the edges between them represent connections with hypothetical distances. Figure 14a depicts the scheme of connections selected from the map and highlights the path identified by the algorithm. The red node indicates the starting location for grain transshipping, while the blue node marks the destination. Dark green nodes are part of the computed path, and lime-colored nodes represent mandatory “must-pass” locations (e.g. linear elevator connected to the railway where additional grain can be loaded or unloaded). In some scenarios, elevator and train capacity can be incorporated to the algorithm to optimize the necessity of “must pass” locations. Figure 14b demonstrates the algorithm’s adaptiveness when encountering damaged paths. Similar to Figure 14a, it highlights the computed path, starting at the red node, passing through lime “must-pass” node, and reaching the blue destination node. Additionally, red edges indicate paths that have been damaged and avoided by the algorithm.
A grain transportation network rerouting example following path and facility disablement, created using the A* algorithm. (a) The initial connectivity network and computed optimal path from Dniprorudne to Mariupol Port. Graph elements have been altered for security purposes. (b) The recalculated optimal path following damage to multiple network components. Source: Created by authors.
Citation: International Food and Agribusiness Management Review 29, 1 (2026) ; 10.22434/ifamr.1209
Figure 14 represents only a small segment of the Ukrainian grain transportation network presented in Figure 13. In reality, the distances between destinations are usually much longer, the routes are more complex, and often cross the entire country. Using proposed methodology, we can reroute grain transshipment from/to any nodes on the map in any time by adding new heuristics (e.g. damaged railway tracks, bridges, stations, available grain for loading/unloading, etc.) to the algorithm due to its flexibility and adaptivity.
5. Conclusions and future research
The wheat and corn supply chains have been disrupted in Ukraine during the war initiated by Russia. The supply chain disruptions have resulted in a need for adjustment of internal and external logistics, changing crop production patterns due to the economic situation within Ukraine, weather conditions, and the loss of land due to military activities. Corn production has decreased by 44% and wheat production decreased by 30% from 2021 to 2024. Not only has aggregate production changed but also production patterns within Ukraine have changed. This has resulted in logistics and storage infrastructure needing to adapt to changing export markets, domestic markets, storage patterns, and production locations.
The ability for transport logistics to adapt to military action and economic conditions has resulted in uncertainty regarding Ukraine’s supplying the world markets with wheat and corn. As such, a sustainable path-finding application grounded in Knowledge Graphs (KGs) was developed to optimize the timing and cost of grain transportation by employing the KNowledge Acquisition and Representation Methodology (KNARM) to generate KGs and incorporating a modified A* algorithm to navigate hazardous and adversarial environments.
Due to the modular and systematic nature of the methodology and tool stacks used, similar encoding of data is possible for transportation of sunflower seed/oil or other crops of interest. Given the flexibility of KGs and their ability to connect different datasets in a standardized way, the datasets about other crops can be generated and reused with the corn and wheat data already encoded using this approach.
Similarly, our modified A* algorithm can be reused given new heuristics and datasets for other pathfinding related tasks as the landscape and conditions change. Though the current research uses limited heuristics, incorporating more complex ones can occur in future applications. For example, heuristics might include land conditions such as flood risks and toxic exposures, weather patterns, and alternative transportation options, enhancing the general applicability of this research.
The data processing and data annotation was a time-consuming activity, performed by domain experts and re-evaluated by the computer science team and the GIS-team in an agile manner with consistent feedback and evaluation loops as outlined in the KNARM framework.
This research has mapped storage locations, railroads, and roads so that the cost of grain transportation can adapt quickly to changes in the situations within Ukraine. The resulting dataset is not only valuable for Ukraine and this application but is also reusable and repurpose-friendly for agricultural, economic, and supply chain related applications.
The approach is designed with sustainability at its core, leveraging a modular and computer-operable format through Knowledge Graphs. By using formal logic to encode data, this method allows machines to efficiently process, encode, and reuse information, reducing redundancy and promoting resource efficiency. This adaptability extends across different crop types, such as sunflower seeds, oil, or other agricultural products, fostering a scalable and sustainable framework. Knowledge graphs facilitate seamless integration of diverse datasets, enabling data from crops like corn and wheat to be repurposed for other agricultural applications with minimal human intervention.
Similarly, the Modified A* algorithm promotes sustainability by dynamically adapting to new pathfinding challenges. By modifying input data and heuristics using the Knowledge Graph backend, transportation routes can be optimized while minimizing environmental impact.
The collaborative, interdisciplinary approach – bringing together domain experts, computer scientists, and GIS specialists – demonstrates the value of sustainable data practices. We employ an agile development methodology, continuously refining data through feedback loops within the KNARM framework. This process could help optimize grain transportation networks in Ukraine, mapping storage sites, railroads, and roads to ensure cost-efficient and adaptable supply chains in response to changing conditions.
By formalizing the system with Knowledge Graphs and the Modified A* algorithm for decision-making, the approach extends beyond Ukraine. It holds potential for global agricultural, economic, and supply chain applications, promoting efficiency, resilience, and long-term sustainability worldwide.
References
Bioko, V. and L. Bioko. 2022. Food security and risks for agricultural production during the war in Ukraine. Economy and Society: 41. https://doi.org/10.32782/2524-0072/2022-41-27 (in Ukrainian).
Bogonos, M., A. Chmil, R. Nazarkina, O. Nykolyuk, P. Pyvovar and H. Stolnikovych. 2023. Agricultural outlook Ukraine 2024–2033 report-summary. Kyiv Scholl of Economics, Kyiv. Available online at https://kse.ua/wp-content/uploads/2024/04/UA-Outlook-2024-2033-Report-1.pdf
Carter, C.A. and S. Steinbach. 2024. Did grain futures prices overreact to the Russia–Ukraine war due to herding? Journal of Commodity Markets 35: 100422. https://doi.org/10.1016/j.jcomm.2024.100422
Centre for Transport Strategies. 2024. Dnipro on pause: What happens to river transportation during war. Available online at https://cfts.org.ua/articles/dnipro_na_pauzi_scho_vidbuvaetsya_z_richkovimi_perevezennyami_pid_chas_viyni_2023/140424 (in Ukrainian).
Container Terminal Mostyska. 2024. Mostyska Container Terminal is a dry port project located on the border of Ukraine and Poland. Available online at https://ctm.in.ua/
Countryman, A.M., Litvinov V., Kolodiazhnyi I., Bogonos M. and O. Nivievskyi. 2024. Global economic effects of war-induced agricultural export declines from Ukraine. Applied Economic Perspective and Policy. 2024: 1–42. https://doi.org/10.1002/aepp.13468
Decree of the President of Ukraine. 2000. On urgent measures to stimulate production and development of the grain market. Kyiv, 29 June 2000. Decree No. 832/200. Available online at https://ips.ligazakon.net/document/view/U832_00?an=9 (in Ukrainian).
Devadoss, S. and W. Ridley. 2024. Impacts of the Russian invasion of Ukraine on the global wheat market. World Development 173: 106396. https://doi.org/10.1016/j.worlddev.2023.106396
Dijkstra, E.W. 1959. A note on two problems in connexion with graphs. Numerische Mathematik 1: 269–271. https://doi.org/10.1007/BF01386390
DIVA-GIS. 2021. Ukrainian railway map. Available online at https://diva-gis.org/data.html
Elevatorist.com. 2022. Ukraine lost about 13 million tons of elevator capacity. Available online at https://elevatorist.com/novosti/14740-ukrayina-vtratila-blizko-13-mln-t-elevatornih-potujnostey (in Ukrainian).
Elevatorist.com. 2024а. Grain storage capacities in Ukraine by region – infographics. Available online at https://elevatorist.com/blog/read/885-potujnosti-zberigannya-zerna-v-ukrayini-po-oblastyah--infografika (in Ukrainian).
Elevatorist.com. 2024b. Vadul-Siret Terminal: Dry port on the border with Romania. Available online at https://elevatorist.com/blog/read/888-vadul-siretskiy-terminal-suhiy-port-na-kordoni-z-rumuniyeyu (in Ukrainian).
European Commission. 2023. Commission adopts exceptional and temporary preventive measures on limited imports from Ukraine. Available online at https://ec.europa.eu/commission/presscorner/detail/en /ip_23_2562
European Parliamentary Research Service. 2024. Ukrainian agriculture: from Russian invasion to EU integration. Available online at https://www.europarl.europa.eu/RegData/etudes/BRIE/2024/760432/EPRS_BRI(2024)760432_EN.pdf
Fernandes, G., P. Teixeira and T.A. Santos. 2023. The impact of the Ukraine conflict in internal and external grain transport costs. Transportation Research Interdisciplinary Perspectives 19: 100803. https://doi.org/10.1016/j.trip.2023.100803
Forbes Ukraine magazine. 2023. “Ukrainian Corridor”. The shelling of a vessel entering the Odesa port did not stop sea exports. And what about the prices? Available online at https://forbes.ua/war-in-ukraine/obstrilyano-pershe-sudno-yake-vivozilo-produktsiyu-z-ukrainskikh-portiv-novim-morskim-koridorom-chomu-tse-ne-zupinilo-torgivlyu-v-mori-09112023-17155 (in Ukrainian).
Glauber, J. 2024. Ukraine and global agricultural markets two years later. International Food Policy Research Institute, Washington, DC. Available online at https://www.ifpri.org/blog/ukraine-and-global-agricultural-markets-two-years-later/
Hassen, T.B. and H.El. Bilali 2024. Conflict in Ukraine and the unsettling ripples: implications on food systems and development in North Africa. Agriculture & Food Security 13: 16. https://doi.org/10.1186/s40066-024-00467-3
Hogan, A., E. Blomqvist, M. Cochez, C. d’Amato, G.D. Melo, C. Gutierrez, S. Kirrane, J.E.L. Gayo, R. Navigli, S. Neumaier and A.C.N. Ngomo. 2021. Knowledge Graphs. ACM Computing Surveys 54: 1–37. https://doi.org/10.1145/3447772
Janowicz, K., P. Hitzler, W. Li, D. Rehberger, M. Schildhauer, R. Zhu, C. Shimizu, C. Fisher, L. Cai, G. Mai, J. Zalewski, L. Zhou, S. Stephen, S. Gonzalez, B. Mecum, A. Carr, A. Schroeder, D. Smith, D. Wright, S. Wang, Y. Tian, Z. Liu, M. Shi, A. D’Onofrio, Z. Gu and K. Currier. 2022. Know, Know Where, KnowWhereGraph: a densely connected, cross-domain knowledge graph and geo-enrichment service stack for applications in environmental intelligence. AI Magazine 43(1): 30–39. https://doi.org/10.1002/aaai.12043
Ju, C., Q. Luo and X. Yan. 2020. Path planning using an improved A-star algorithm. Presented at the 11th International Conference on Prognostics and System Health Management (PHM-2020 Jinan) Jinan, China, 23–25 October, 2020. https://doi.org/10.1109/PHM-Jinan48558.2020.00012
Kobuta, I., O. Sikachyna and V. Zhygadlo. 2012. Wheat Export Economy in Ukraine. Policy Studies on Rural Transition No. 2012–4. FAO Regional Office for Europe and Central Asia, Budapest. Available online at https://openknowledge.fao.org/server/api/core/bitstreams/7d4fd031-009a-48fb-98ab-fec9b914dba4/content
Kyiv School of Economics. 2023. Agricultural Outlook Ukraine. 2030 Financial aid to crop producers. KSE Agrocenter working paper, June 2023. KSE, Kyiv. Available online at https://kse.ua/wp-content/uploads/2023/06/2050-projections-for-crops.pdf
Lebo, T., S. Sahoo, D. McGuinness, K. Belhajjame, J. Cheney, D. Corsar, D. Garijo, S. Soiland-Reyes, S. Zednik and J. Zhao. 2013. PROV-O: The PROV ontology. (W3C recommendation). World Wide Web Consortium. 30 April 2013. The University of Manchester, Manchester. Available online at http://www.w3.org/TR/2013/REC-prov-o-20130430/
McGinty, H.K. 2018. KNowledge Acquisition and Representation Methodology (KNARM) and its applications. PhD-thesis, University of Miami, Coral Gables, FL. Available online at https://scholarship.miami.edu/esploro/outputs/doctoral/KNowledge-Acquisition-and-Representation-Methodology-KNARM/991031447865202976#metrics
Ministry of Agrarian Policy and Food of Ukraine. Grain crop market as of 02.02.2022. Available online at https://www.facebook.com/mapfu2021/videos/361705378761833/ (in Ukrainian).
Ministry for Communities and Territories Development of Ukraine. 2023. Minister Oleksandr Kubrakov met with EBRD President Odile Renaud-Basso on joint implementation of Danube Ports development projects. Available online at https://mtu.gov.ua/news/34220.html
Ministry of Agrarian Policy and Food of Ukraine. 2024a. Foreign trade in agricultural product. Available online at https://minagro.gov.ua/en
Ministry of Agrarian Policy and Food of Ukraine. 2024b. Harvest is nearing completion: 73.6 million tons of grains and oilseeds have been harvested. Available online at https://minagro.gov.ua/news/zhnyva-dobihaiut-do-zavershennia-zibrano-763-mln-tonn-zernovykh-i-oliinykh (in Ukrainian).
Ministry of Agrarian Policy and Food of Ukraine. 2024c. Ukraine: Impact of the war on agriculture profitability. Issue # 4. Available online at https://minagro.gov.ua/storage/app/sites/1/uploaded-files/Impact%20of%20the%20War%20on%20Agriculture%20Profitability_Issue%204.pdf
Ministry of Agrarian Policy and Food of Ukraine. 2024d. Where will the grain sleeves go. Available online at https://minagro.gov.ua/en/news/where-will-the-grain-sleeves-go
Musen, M.A. and the Protégé Team. 2015. The Protégé project: a look back and a look forward. AI matters 1(4): 4–12. https://doi.org/10.1145/2757001.2757003
NASA Harvest. 2023a. Farming amidst a war: satellite data reveals productive yet challenging season for Ukraine. https://www.nasaharvest.org/news/farming-amidst-war-satellite-data-reveals-productive-yet-challenging-season-ukraine
NASA Harvest. 2023b. Satellite-based Ukraine wheat production estimates. Available online at https://www.nasaharvest.org/news/farming-warzone-nasa-harvest-releases-satellite-based-ukraine-wheat-production-estimates
Neyter, R., S. Zorya and O. Muliar. 2024. Agricultural war damages, losses, and needs review (English). World Bank Group, Washington, DC. Available online at http://documents.worldbank.org/curated/en/099062524074642129/P1801981405a6a026197241151419507961
Nibulon. 2024. Nibulon’s pride: the Bessarabska branch team. Available online at https://www.nibulon.com/en/nibulon-s-pride-the-bessarabska-branch-team/
Nikoliuk, O., P. Pyvovar, R. Nazarkina, G. Stolnikovych and M. Bogonos. 2023. Dynamics of the land fund: how the land resources of Ukraine changed after February 24, 2022. Center for Food and Land Use Research, Kyiv School of Economics, Kyiv. Available online at https://kse.ua/wp-content/uploads/2024/03/Agroviglyad_2_ukr.pdf
Program “Grain of Ukraine”. 1998. Program “Grain of Ukraine”. Approved by Order of the Ministry of Agriculture, Ukrainian Academy of Agricultural Sciences, State Joint Stock Company “Khlib Ukrainy” dated 20 April 1998, No. 121/49/39. Available online at https://zakon.rada.gov.ua/rada/show/en/v0121244-98?lang=uk#Text (in Ukrainian).
Program “Grain of Ukraine”. 2001. Program “Grain of Ukraine 2001–2004”. Approved by the Resolution of the Cabinet of Ministers of Ukraine dated 27 November 2000 No. 1739. Available online at https://zakon.rada.gov.ua/rada/show/v0004555-01#Text (in Ukrainian).
Program “Grain of Ukraine”. 2004. Program “Grain of Ukraine 2005–2010”. Approved by Order of the Ministry of Agrarian Policy of Ukraine and Ukrainian Academy of Agrarian Sciences dated 28 July 2004 No. 271. Available online at https://zakon.rada.gov.ua/rada/show/v0271555-04#Text (in Ukrainian).
Program “Grain of Ukraine”. 2007. Program “Grain of Ukraine 2015” (Comprehensive Sectoral Program “Development of grain production in Ukraine until 2015”). Approved by Order of the Ministry of Agrarian Policy of Ukraine and Ukrainian Academy of Agrarian Sciences dated 23 October 2007 No. 757/101. Available online at https://zakon.rada.gov.ua/rada/show/en/v0757555-07?lang=uk#Text (in Ukrainian).
Rail.insider. 2023. Analysis of the cost of transporting grain cargo by rail in 2019–2023. Available online at https://www.railinsider.com.ua/analiz-vartosti-perevezennya-zernovyh-vantazhiv-zaliznychnym-transportom-v-2019-2023-rropen/#
Salin, D. 2024. Ukraine Grain Transportation. June 2024. U.S. Department of Agriculture, Agricultural Marketing Service. http://dx.doi.org/10.9752/TS260.06-2024
Sedikov, D.V. 2018. Logistics of grain: infrastructure component and problems of development. Scientific Bulletin of the Uzhhorod National University. Series: International economic relations and world economy 22 (3). Available online at http://www.visnyk-econom.uzhnu.uz.ua/archive/22_3_2018ua/13.pdf (in Ukrainian).
State Statistics Service of Ukraine. 2022. Agriculture of Ukraine for 2021. Available online at https://www.ukrstat.gov.ua/druk/publicat/kat_u/2022/zb/09/sg_21_pdf.zip
State Statistics Service of Ukraine. 2023a. 2022 Plant Growing in Ukraine. Available online at https://www.ukrstat.gov.ua/druk/publicat/kat_u/2023/zb/09/zb_rosl_2022.pdf
State Statistics Service of Ukraine. 2023b. Agriculture of Ukraine for 2022. Available online at https://www.ukrstat.gov.ua/druk/publicat/kat_u/2023/zb/09/S_gos_22.pdf
State Statistics Service of Ukraine. 2024a. Areas, gross harvest and yields of agricultural crops by their species. Available online at https://www.ukrstat.gov.ua/
State Statistics Service of Ukraine. 2024b. Economic Statistics / International economic activity. Available online at https://www.ukrstat.gov.ua/
State Statistics Service of Ukraine. 2024c. Use of inorganic and organic fertilizers, use of pesticides (1990–2023). Available online at https://www.ukrstat.gov.ua/
The Cabinet of Ministers of Ukraine. Government portal. 2023. New mechanism for insuring ships against war risks restores stability and security to maritime transport: Yuliia Svyrydenko. Available online at https://www.kmu.gov.ua/en/news/novyi-mekhanizm-strakhuvannia-suden-vid-voiennykh-ryzykiv-povertaie-stabilnist-sudnoplavstva-i-bezpeku-morskykh-perevezen-iuliia-cvyrydenko
The Economist Group. 2022. Global Food Security Index 2022. Available online at https://impact.economist.com/sustainability/project/food-security-index/
Tkachov, V. 2024. Logistic possibilities of grain export by rail in 2023–2024. Available online at https://www.railinsider.com.ua/logistychni-mozhlyvosti-eksportu-zerna/ (in Ukrainian).
Transport Corridors. 2024. A new multimodal terminal has opened in Ukraine near the EU border. Available online at https://www.transportcorridors.com/7064
U.S. Department of Agriculture, Foreign Agricultural Service. 2023. Ukraine: Overview of MY 2023/24 wheat harvest. Commodity intelligence report. Available online at https://ipad.fas.usda.gov/highlights/2023/10/Ukraine/index.pdf
U.S. Department of Agriculture, Foreign Agricultural Service. 2024. Ukraine: grain and feed quarterly. Report UP2024–0022. October 28, 2024. Available online at https://apps.fas.usda.gov/newgainapi/api/Report/DownloadReportByFileName?fileName=Grain%20and%20Feed%20Quarterly_Kyiv_Ukraine_UP2024-0022.pdf
U.S. Embassy in Ukraine. 2023. Ambassador Brink visits Danube ports in Reni and Izmail to highlight U.S. Government support for grain exports amid Russia’s full-scale war. Press Release. Available online at https://ua.usembassy.gov/ambassador-brink-visits-danube-ports-in-reni-and-izmail-to-highlight-u-s-government-support-for-grain-exports-amid-russias-full-scale-war/
UkrAgroConsalt. 2022. UGA asking government to organize grain corridor through Moldova. Available online at https://ukragroconsult.com/en/news/uga-asking-government-to-organize-grain-corridor-through-moldova/
United Nations. 2024. Vessel Movements. Black Sea Grain Initiative Joint Coordination Centre. Available online at: https://www.un.org/en/black-sea-grain-initiative/vessel-movements
United Nations Ukraine. 2022. Call for applications for receiving sleeves for grain storage starts through the State Agrarian Registry. Available online at https://ukraine.un.org/en/200844-call-applications-receiving-sleeves-grain-storage-starts-through-state-agrarian-registry
Vashchenko, K. 2025. Today, agricultural holdings are investing minimally in elevators because there are grain sleeves. In wartime, this is not only cheap storage, but also safe. Available online at https://latifundist.com/interview/813-agroholdingi-sogodni-minimalno-investuyut-v-elevatori-bo-ye-zernovi-rukavi-v-umovah-vijni-tse-ne-tilki-desheve-zberigannya-a-j-bezpechne--kostyantin-vashchenko
Vasylkovska, K. and V. Malakhovska. 2019. Analysis of the export potential of grain in Ukraine. Central Ukrainian Scientific Bulletin: Economic Sciences. Issue 3(36). https://doi.org/10.32515/2663-1636.2019.3(36).313-320 (in Ukrainian).
W3C. 2023. Understanding WCAG 2.0. A guide to understanding and implementing Web Content Accessibility Guidelines 2.0. 2023. W3C World Wide Web Consortium Recommendation, 21 September 2023. Available online at https://www.w3.org/TR/UNDERSTANDING-WCAG20/Overview.html#contents
Welsh, C., E. Dodd, V. Dankevych, J.W. Glauber and A. Broyaka. 2023. From the ground up: Demining farmland and improving access to fertilizer to restore Ukraine’s agricultural production. Center for Strategic and International Studies, Washington, DC. Available online at https://www.csis.org/analysis/ground-demining-farmland-and-improving-access-fertilizer-restore-ukraines-agricultural
World Bank Group Data. 2021. Arable land (% of land area). Available online at https://data.worldbank.org/indicator/AG.LND.ARBL.ZS?most_recent_value_desc=true
World Food Program and Kyiv School of Economics. 2024. Ukraine wheat flour and sunflower oil value chains. Summary report. April 2024. Available online at https://fscluster.org/ukraine/document/ukraine-wheat-flour-and-sunflower-oil
Zanaga, D., R. Van De Kerchove, D. Daems, W. De Keersmaecker, C. Brockmann, G. Kirches, J. Wevers, O. Cartus, M. Santoro, S. Fritz, M. Lesiv, M. Herold, N.E. Tsendbazar, P. Xu, F. Ramoino and O. Arino. 2022. ESA WorldCover 10 m 2021 v200. https://doi.org/10.5281/zenodo.7254221
Zhang, Y. 2023. Sustainable spatial and semantic-web enhanced pathfinding in dynamic domains (SPEED): a case study of grain transportation in Ukraine. MS thesis, Kansas State University, Manhattan, KS. Available online at https://hdl.handle.net/2097/43555
Zhang, Y., A. Broyaka, J. Kastens, A.M. Featherstone, C. Shimizu, P. Hitzler and H.K. McGinty. 2023. Sustainable grain transportation in Ukraine amidst war utilizing KNARM and KnowWhereGraph. WWW’23 Companion: Companion Proceedings of the ACM Web Conference 2023: 742–745. https://doi.org/10.1145/3543873.3587618
Appendix A
KNARM Steps Followed and Detailed Descriptions
1. Sub-language analysis
The first step of sub-language analysis involved discovering the units of information or knowledge, and the relationships between them within existing knowledge sources related to the domain of grain transportation in Ukraine. A corpus of documents and reports from various sources were used to find the recurring patterns and concepts in the data. We consulted with the domain expert to verify and refine our sub-language analysis.
2. Unstructured interview
The second step of unstructured interview involved conducting a semi-formal interview with the domain expert to elicit his tacit knowledge and experience about the domain. We asked open-ended questions about their expectations from our application. We also asked them to provide examples and scenarios of grain transportation problems and solutions. Due to the sensitive nature of the data, we did not record nor transcribe the interview.
3. Sub-language recycling
The third step of sub-language recycling involved reusing existing standards and ontologies that provide useful information for the domain. We searched for relevant resources on the Semantic Web and other online repositories, such as GeoNames, DBpedia, Open-StreetMap and KnowWhereGraph. These resources provide rich and up-to-date geospatial information, such as location names, coordinates, distances, types, relations.
4. Meta data creation and knowledge modeling
The fourth step of meta data creation and knowledge modeling involved creating a conceptual model of our domain using formal logic (Description Logic). We defined the classes, properties, individuals, axioms, rules, and constraints that represent the essential aspects of grain transportation in Ukraine.
5. Structured interview and knowledge acquisition (KA) validation
The fifth and sixth steps of structured interview and KA validation involved constantly checking the consistency and completeness of our knowledge acquisition process with domain expert and GIS expert to see if what we were doing was correct and accurate.
6. Database formation
Due to the nature of the data, no database was formed during this research.
7. Semi-automated ontology building
Knowledge modelled previously that involved creating a conceptual model of the domain and generation of computer operable representation of knowledge was converted into OWL (Web Ontology Language) using the ROBOT tool and Protégé, which are frequently used tools for knowledge graph generation. We converted the classes, properties, individuals, axioms, rules, and constraints that represent the essential aspects of grain transportation in Ukraine. We used a modular approach to organize the ontology into different regions based on geographic criteria. We also used a location ontology as a core module that defines the basic concepts and relations for any location in our domain.
8. Ontology validation
We used various methods to validate our ontology, such as logical reasoning, competency questions, scenario testing, peer review, and feedback sessions. We also revised and refined our ontology based on the results of the validation.
Appendix B
A* Algorithm
The A* algorithm is a widely used path-finding algorithm that can find the optimal path between two locations in a graph, where each node has a cost associated with it. The algorithm works by maintaining an open set of candidate nodes, which are nodes that have not been explored yet, and a closed set of visited nodes, which are nodes that have been explored already. The algorithm starts with the source node in the open set, and at each step, it selects the node with the lowest cost from the open set, moves it to the closed set, and expands its neighbors. The cost of a node is calculated by adding two values: g(n), which is the actual cost from the source to the node n; and h(n), which is an estimate of the cost from n to the destination. The estimate h(n) is called a heuristic function, and it should be optimistic, meaning that it should never overestimate the actual cost. The algorithm terminates when either the destination node is moved to the closed set, or when the open set becomes empty. If the destination node is found, then the optimal path can be traced back by following the parent pointers of each node.
The A* algorithm is an extension of Dijkstra’s shortest path algorithm, which is a path-finding algorithm that only uses g(n) as the cost function. Dijkstra’s algorithm can find the optimal path in any graph with non-negative edge weights, but it can be slow and inefficient because it explores all possible paths equally. The A* algorithm improves on Dijkstra’s algorithm by using h(n) as a guide to direct the search towards the destination more quickly and effectively.
However, the A* algorithm requires a good heuristic function that can provide accurate and consistent estimates of the cost. If h(n) is zero for all nodes, then A* becomes Dijkstra’s algorithm; if h(n) is very high for all nodes except the destination, then A* becomes a greedy best-first search, which is a path-finding algorithm that only uses h(n) as the cost function. Greedy best-first search can be very fast but not optimal, because it can get stuck in local minima or dead ends.
The A* algorithm has some advantages over other path-finding algorithms for the domain of grain transportation. It can find the optimal path in terms of distance, grain storage, and risk, which are important criteria for our application. It can also adapt to dynamic and uncertain situations, such as changes in weather, traffic, or security conditions, by updating the cost and heuristic functions based on the latest information.
We modified the A* algorithm into a recursive algorithm, where we can add some “must-pass” nodes, either can be high priority elevators because of their grain storage or their location, or hand-picked by domain expert, who says such location is high value and we must have the path that pass through these nodes. We made this modification to accommodate the preferences and constraints of our domain expert, and to ensure that our paths are feasible and realistic. The algorithm works as follows: The algorithm takes as input the start node, the goal node, and a list of must-pass nodes [A,B,C,…], where [A,B,C,…] are the names of the must-pass locations in any order. The algorithm recursively explores all possible paths in the list, based on the heuristics mentioned above. If the list is empty, then it simply applies the standard A* path finding. The figure below demonstrates how the algorithm works.
We integrated the A* algorithm as follows in algorithm 1: We tested our implementation using some sample data from our domain expert, and evaluated our results using some quality metrics, such as performance, scalability, reliability, usability, and maintainability.
Citation: International Food and Agribusiness Management Review 29, 1 (2026) ; 10.22434/ifamr.1209
Appendix C
W3C standards are web standards used across the internet for better exchange of information and knowledge with minimum human interference (https://www.w3.org/standards/).
Dijkstra’s algorithm is an algorithm for finding the shortest paths between nodes in a weighted graph, which may represent, for example, a road network. It was conceived by computer scientist Edsger W. Dijkstra in 1956 and published three years later. (Dijkstra, 1959).
Pseudocode for Dijkstra’s algorithm.
Citation: International Food and Agribusiness Management Review 29, 1 (2026) ; 10.22434/ifamr.1209
Corresponding author

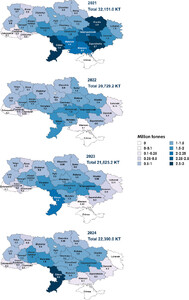
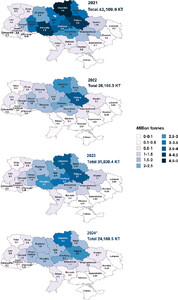
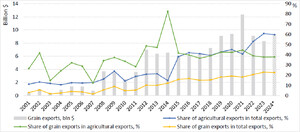
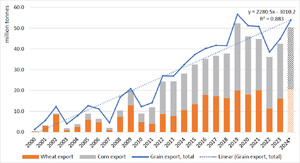

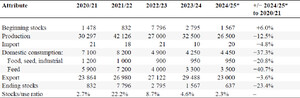
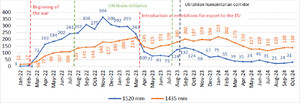
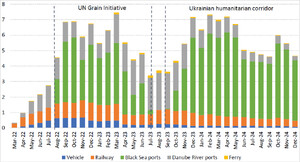
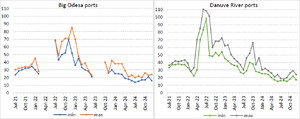
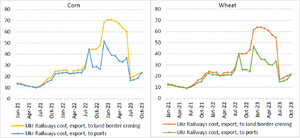

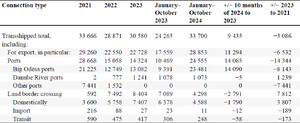
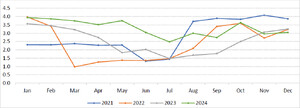

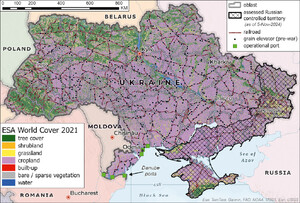
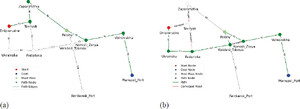

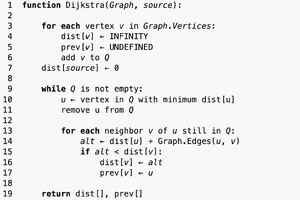

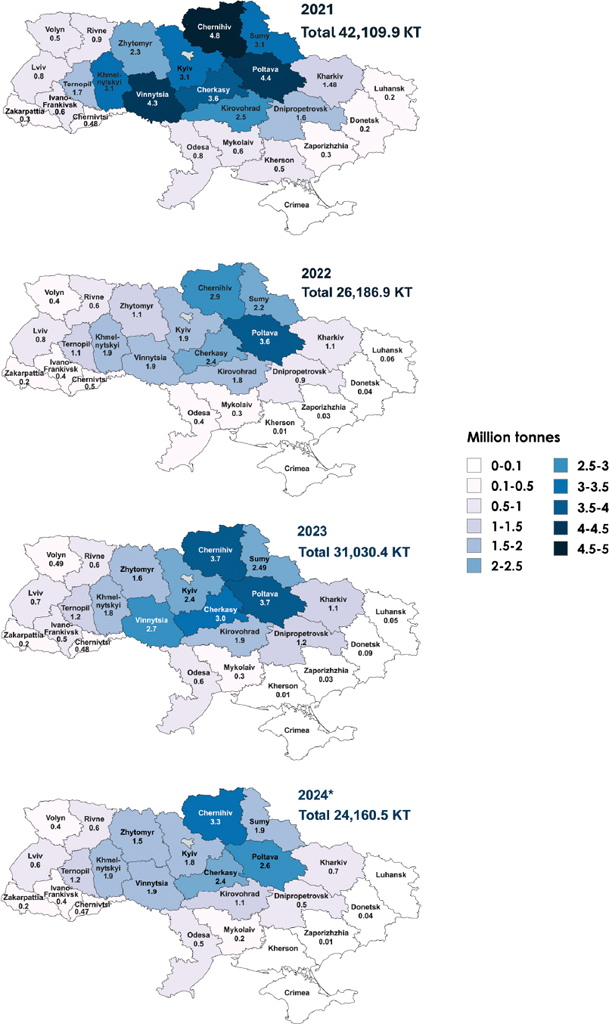
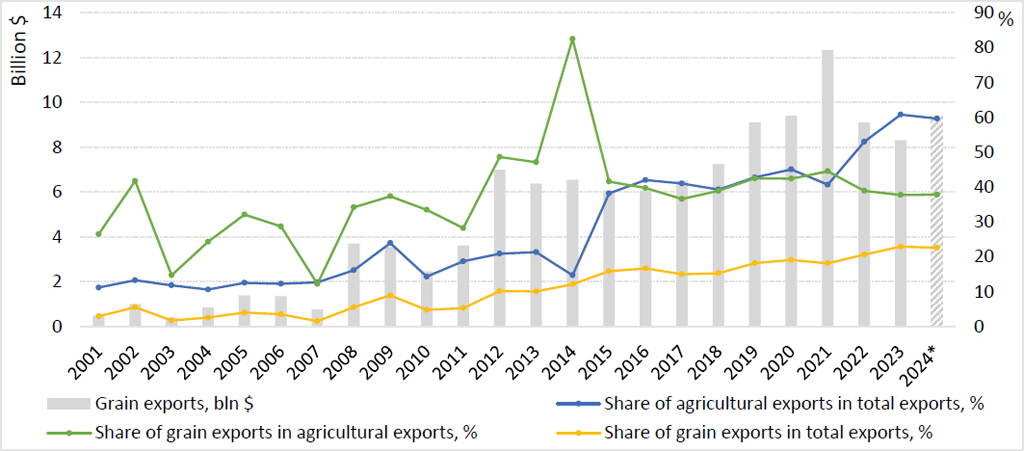
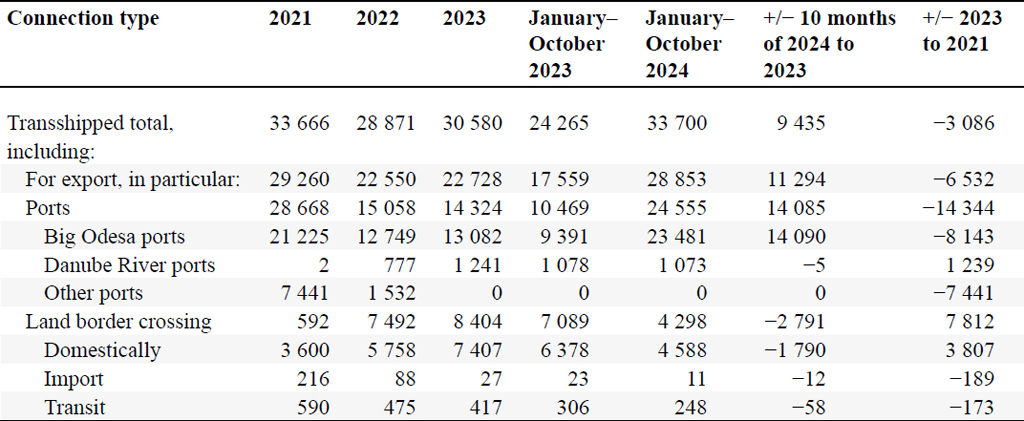
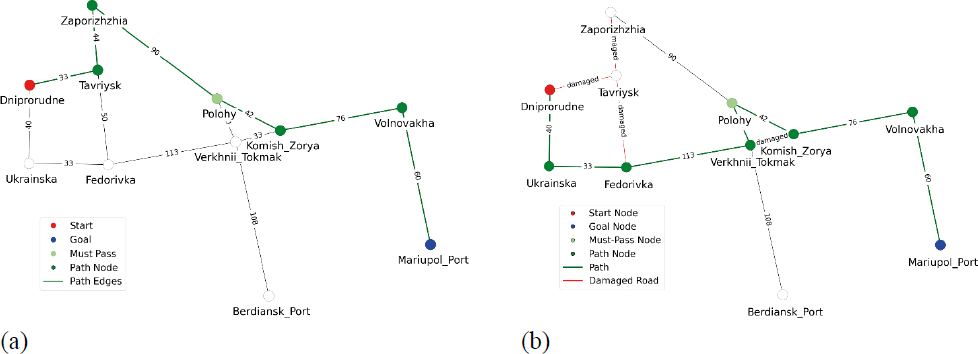
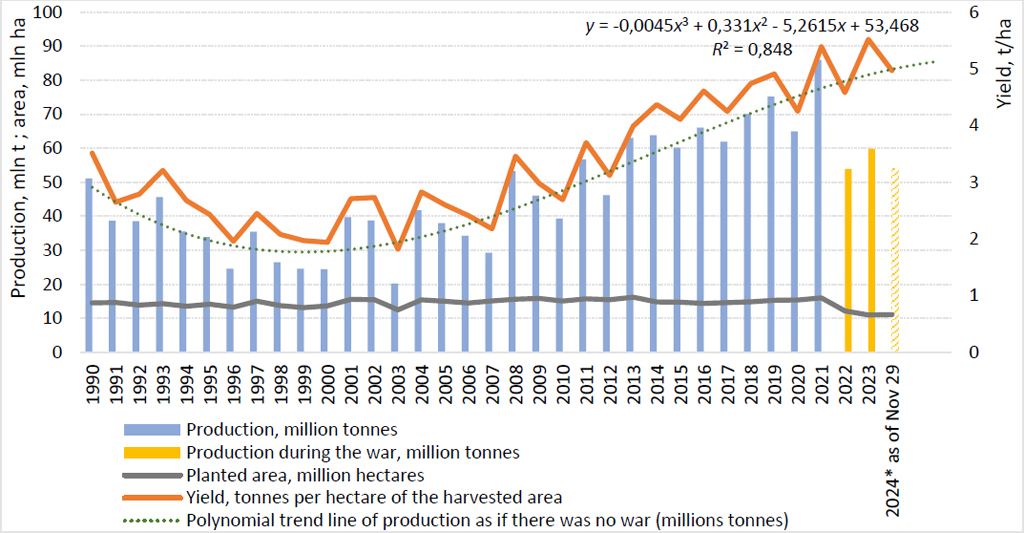
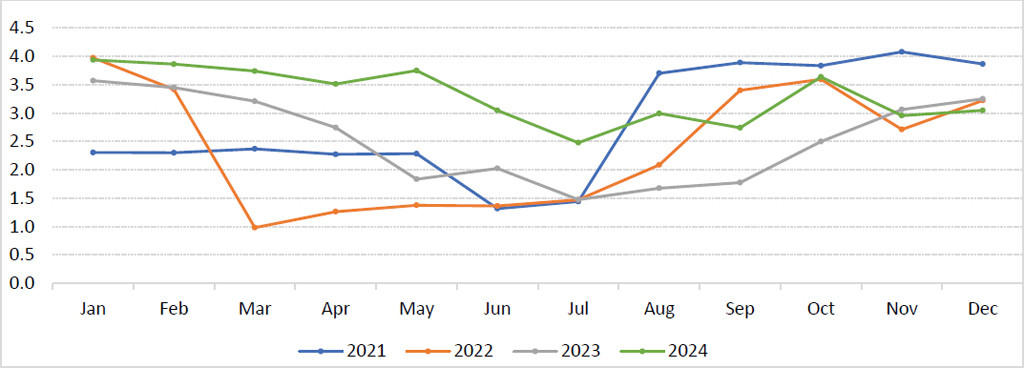
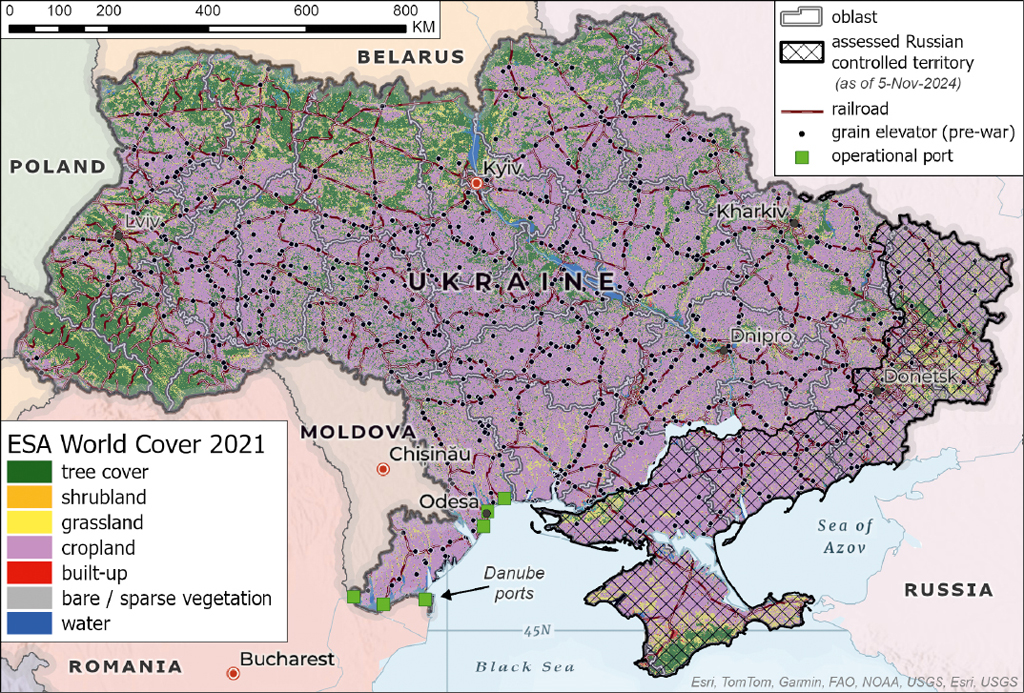
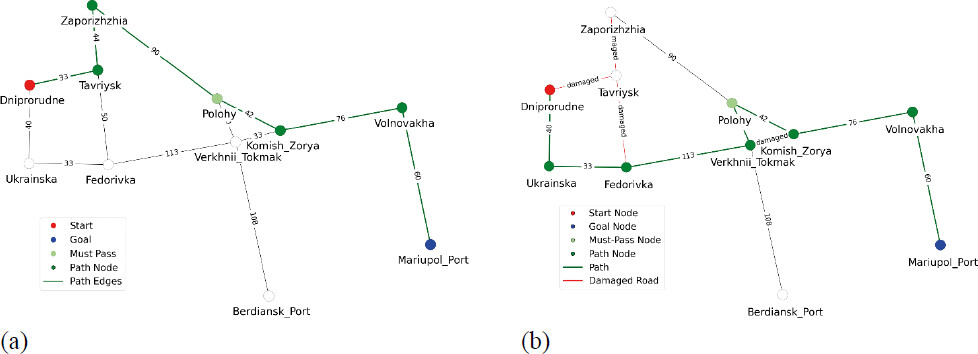