Abstract
Georgia’s dependence on imported wheat, particularly from Russia, poses significant food security risks, exacerbated by recent global disruptions such as the COVID-19 pandemic and the Russia-Ukraine conflict. Despite modest gains in domestic wheat production, much of Georgia’s wheat continues to be perceived as lower quality. This study evaluates the current state of Georgia’s wheat and milling industry, compares the quality of Georgian and Russian wheat and flour through laboratory analysis, and identifies key strategies to enhance domestic wheat quality and market competitiveness. Findings indicate that Georgian wheat has weaker gluten properties and inconsistent performance compared to Russian imports, which more closely resemble U.S. hard red winter wheat. To strengthen Georgia’s wheat sector, the study recommends interventions such as standardized quality testing, infrastructure improvements, technical training for millers and bakers, and targeted agronomic practices. Achieving Georgia’s goal of 50% wheat self-sufficiency will require not just increasing production, but also improving quality — ensuring consistent, high quality flour, reducing import dependence, and strengthening long-term food security.
1. Introduction
Georgia’s reliance on wheat imports makes it vulnerable to global market fluctuations, supply chain disruptions, and geopolitical risks. The recent global pandemic and the ongoing Russia-Ukraine conflict has disrupted food supplies in Georgia, underscoring the urgent need for strategies to increase food security and reduce dependency on wheat imports.
Georgia’s wheat production is vital for the country’s food security due to the significant role that bread and bakery products play in the Georgian diet. Bread is served with every meal and is a main source of calories in the Georgian diet. It accounts for approximately 60% of an individual’s daily caloric intake, double the share of total caloric intake for individuals in the United States (U.S.) and United Kingdom (Gelashvii and Babych, 2016).
Between 2016 and 2019, Georgia’s average wheat yield was 2.4 metric tons per hectare, less than half of the European Union’s average yield of 5.3 tons per hectare during that time (Kereselidze, 2023; USDA FAS, n.d.). Winter wheat represents over 90% of the wheat crop, with Spring wheat representing the rest (Figure 1). Georgia’s low wheat yield limits domestic production quantity and quality and is driven by limited seed technology, fragmented land ownership, outdated farming practices, and limited access to modern harvesting technology (Gelashvii and Seturidze, 2024). Increasing droughts and soil salinization also threaten Georgian productivity (Tanchum, 2023). However, there have been increases in both Winter and Spring wheat production since 2019.

Production of wheat in Georgia, 2019–2024. Source: GEOSTAT (2025a).
Citation: International Food and Agribusiness Management Review 29, 1 (2026) ; 10.22434/ifamr.1208
Despite increases in production, Georgia’s wheat self-sufficiency remains very low (Figure 2) though it is increasing. In 2021, the self-sufficiency ratio was 22%, approximately three times higher than in 2014. Since 2021, the ratio has remained stable (GEOSTAT, 2025a). Georgia’s Agriculture Minister is optimistic that Georgia could achieve 50% wheat self-sufficiency within the next few years (Tanchum, 2023). However, much of the wheat produced in Georgia is not high quality, and is used for livestock feed instead of human consumption.
Georgia’s domestic wheat production, imports, and self-sufficiency ratio, 2014–2024. Source: GEOSTAT (2025b).
Citation: International Food and Agribusiness Management Review 29, 1 (2026) ; 10.22434/ifamr.1208
Georgia relies heavily on wheat imports from Russia to supply most of the remaining 78% of its wheat needs. In 2022, wheat and wheat flour imports from Russia totaled 128 million USD, making wheat and wheat flour the top food product import and second-largest import overall, after petroleum and petroleum oils at 623 million USD (GEOSTAT, 2023a,b). Wheat and wheat flour imports from Russia accounted for 88 and 98% of total wheat and wheat flour imports in the first half 2022, respectively (Khishtovani et al., n.d.). This dependency poses serious food security risks for Georgia.
Russia has a history of implementing export restrictions on wheat. Since the 2007–2008 trade year, Russia has imposed seven export restrictions (Sowell and Swearingen, 2022). In the most recent export restriction, in June 2021, Russia implemented a “floating tariff” on wheat, making it more expensive to import wheat than wheat flour. Consequently, wheat flour imports surged, nearly replacing wheat imports (Figure 3). This shift led to a reduction in the number of active Georgian mills. Fewer active mills created challenges for local wheat producers in selling their domestically grown wheat because of the decreased ability to blend wheat for milling. The increasing reliance on imported wheat flour from Russia increased the risk of entirely displacing domestic flour production (Gelashvili, 2024; Tanchum, 2023).
The mission of the Georgian Grain and Flour Producers Association, representing about 20 large and medium-sized mills across Georgia, is to strengthen local production. The Association advocated for the Georgian government to counterbalance the Russian floating tariffs by implementing an import tax. In June 2023, the Georgian government imposed a temporary import duty on Russian wheat flour, barley, and bran to promote fair competition in the Georgian wheat and wheat flour market. This import tax was to expire on November 1, 2023, but it was extended four times — first to March 1, 2024, then to September 1, 2024 and March 1, 2025, and finally to April 1, 2025. Under a recent government decree, the import tax has been extended for an indefinite period. The initial import duty was set at 200 GEL (75 USD) per ton on wheat flour imported from Russia. In October 2023, the import duty was increased to 250 GEL (92 USD) per ton of wheat flour. The import duty on barley and bran was set at 100 GEL per ton. A stipulation of this policy required Georgian mills to purchase 1 kg of wheat from local producers for 0.7 GEL (0.3 USD). Another stipulation for imposing this import duty was the flour mills and bakeries guarantee that the price of so-called social bread prices in Georgia remained unchanged (Gelashvili, 2024; Sputnik Georgia, 2025; Sukhiashvili, 2023).
Prior to the third quarter of 2021, the quantity of wheat flour imported over the past 12 years was negligible compared to wheat grain imports. From 2019 to the third quarter of 2021, wheat flour import prices were about 29% higher than wheat grain import prices. After Russia imposed a floating tariff on wheat grain in June 2021, wheat flour imports increased significantly, nearly doubling between the second and third quarters of 2021 (Figure 3).
Wheat and wheat flour imports and import prices, 2019–2024. Source: GEOSTAT (2025b). Adapted from Gelashvili (2024)
Citation: International Food and Agribusiness Management Review 29, 1 (2026) ; 10.22434/ifamr.1208
During the fourth quarter of 2021, the import price gap between wheat and wheat flour narrowed to approximately 10.4% (Figure 3). By the first quarter of 2022, wheat flour imports had nearly equaled wheat imports, and the price difference between the two commodities had almost disappeared. The import price for wheat flour was only 2.3% higher than wheat. In the second quarter of 2022, wheat flour imports increased to 2.8 times the volume of wheat imports (46,301 thousand tons of wheat flour compared to 16,596 thousand tons of wheat). From the first quarter of 2022 through the second quarter of 2024, the price difference between wheat and wheat flour fluctuated but remained within a 10% range. In the third quarter of 2022 and from the first to the third quarter of 2023, wheat flour import prices fell below those of wheat.
After Georgia imposed a temporary import duty on Russian wheat flour in June 2023, wheat flour imports dropped by approximately half (Figure 3). In the fourth quarter of 2023, import wheat flour prices were once again higher than wheat. By the third quarter of 2024, the difference in import prices had nearly doubled compared to the previous quarter, suggesting an upward trend in wheat flour import prices. However, this gap remains significantly lower than the 34% average price difference in 2019. Although floating duties on wheat exports have decreased, wheat and wheat flour imports into Georgia have not returned to the levels experienced before Russia imposed the floating duty on wheat in 2021.
Due to Russia’s floating tariff on wheat, the price of wheat bread and wheat flour in Georgia increased in 2021–2022. Georgia’s wheat bread prices increased by 36% year-on-year in June 2022, coinciding with global wheat prices reaching historic highs that year (Gelashvili, 2024; Gelashvili and Seturidze, 2024). After June 2022, the global wheat prices trended downward, easing some of the upward pressure on flour and bread costs. In June 2023, Georgia introduced a temporary duty on the import of wheat flour, with the goal to increase the competitiveness of Georgian wheat and facilitate its sales in the domestic market. As a condition of the policy, the price of social bread in Georgia was to remain stable, and flour mills and bakeries committed to purchasing the remaining domestic wheat crop. Both the Minister of Environmental Protection and Agriculture and the Georgian Bread Manufacturers Union pledged that the price of social bread would not rise (Ministry of Environmental Protection and Agriculture of Georgia, 2023b). Following the implementation of the import duty on Russian wheat flour, the price of social bread in Georgia remained stable and did not increase (Figure 4).
Retail price of wheat bread in Georgia (GEL/kg×100), 2020–2024. Source: GEOSTAT, 2025b
Citation: International Food and Agribusiness Management Review 29, 1 (2026) ; 10.22434/ifamr.1208
Despite efforts to increase competitiveness of domestic wheat flour, Georgian wheat producers continued to face challenges in selling their wheat to local mills. A factor driving this challenge is the preference of many mills for imported Russian wheat, which is often perceived as superior in terms of quality and consistency (Commersant, 2023). This preference has contributed to Georgia’s continued reliance on wheat and wheat flour imports, which has increased its vulnerability to supply chain disruptions, price fluctuations, and geopolitical uncertainties.
To reduce Georgia’s dependence on wheat and wheat flour imports and to strengthen domestic wheat production, strategic interventions are needed to both increase the domestic production and improve the quality of Georgian wheat and wheat flour. Identifying and addressing deficiencies in key quality attributes in wheat and wheat flour, such as protein content, gluten strength, and milling properties, would increase the marketability of Georgian wheat and make it a competitive substitute for imported wheat and wheat flour. Focusing on domestic wheat quality and production improvements would help Georgia mitigate risks associated with global supply chain disruptions, trade restrictions, and geopolitical instability. A stable, high-quality domestic wheat supply that meets human consumption standards is key for improving food security in Georgia and for supporting local producers and strengthening resilience in its wheat supply chain.
This study focuses on wheat flour, acknowledging its intrinsic relationship to wheat production and understanding that interventions to improve wheat flour quality may inherently require improvements in the quality of raw wheat. The research aims to identify strategies for Georgia to enhance the quality of domestically produced wheat and wheat flour, which will strengthen its wheat supply chain, reduce dependence on imports, and improve food security. The specific objectives are as follows:
(1) Assess the current state of the Georgian wheat and milling industry.
(2) Evaluate the quality of Georgian wheat and wheat flour relative to imported Russian wheat and wheat flour using laboratory testing to compare grain quality characteristics, milling performance, and baking properties.
(3) Develop strategies to improve the quality and market competitiveness of Georgia wheat and wheat flour.
2. Data
In January 2023, a research team from Kansas State University visited multiple flour mills, bakeries, and feed mills in Georgia. During these visits, the team interviewed millers, bakers, government officials, members of the Bakers Association and elevator operators at the Poti Port. Discussions covered a range of topics, including the types of products produced on-site, desired specifications for end-products and intermediate goods, quality assurance and quality control measures and food safety programs in place, production challenges encountered during the milling and baking stages, opportunities for the industry to grow, resources needed to increase competitiveness and profitability of millers and bakeries, and broader challenges within the wheat supply chain. In addition to these interviews, the team observed the status of processing, baking and storage facilities and equipment. They also assessed food and employee safety practices.
During 2025, 20 kg wheat samples were collected from various regions in Georgia to conduct a full quality analysis of the wheat and flour through grain grading, flour milling, and flour and dough testing. Russian samples of wheat were also collected at the Georgian mills for comparison. Samples were collected from each commercial mills visited that either had both local and imported samples or only imported samples. These analyses were managed by Kansas State University working with different organizations across multiple wheat quality testing facilities. The purpose of the testing was to establish a scientific baseline comparing the quality of the Georgian and Russian wheat and flour milled from that wheat. The comparison was based on key parameters including milling performance, flour characteristics, and baking properties. For descriptions of accepted test methods, refer to the approved methods of AACC International (AACCI, 2010).
Three wheat samples (20 kg of each) were sourced from Georgian mills. It is important to note that these three wheat samples were from wheat grown in Georgia using Russian sourced seed. The three Georgian samples are labeled as G1, G2 and G3. One of the Georgian samples (G1) was from the Shida Kartli Region, and the other two samples (G2 and G3) were sourced from Dedoplistskar in the Kakheti Region. Three wheat samples (20 kg of each) were sourced from Russia imported by the Georgian entity, originating from the Russian Stavropol area. These Russian samples are labeled as R1, R2, and R3. Wheat samples were collected from a single portion of the grain lot or stream, providing a one point in time sample. The recommended approach is to collect samples at random intervals throughout the lot or stream to obtain a more representative sample; however, sample collection was constrained by limited employee help and equipment. In addition, the number of samples collected for analysis was restricted by the number of large commercial mills in Georgia with local and/or imported wheat, and by financial and logistical constraints in transporting the samples to the United States.
3. Post-harvest wheat supply chain in Georgia
3.1 Wheat milling and grain processing in Georgia
After harvesting, wheat grain is primarily sold directly from field to traders (44.3%), grain processing plant (17.9%), and grain savers (9.2%). Slightly more than a quarter (26.6%) of producers use wheat for personal purposes, including livestock feeding and milling. When interviewed, producers indicated there is a shortage of grain storage facilities available in Georgia, which prevented them from storing wheat and taking advantage of the higher selling prices later in the marketing year. Among the farmers who do store grain, most use flat storage rather than silos.
In 2022, there were 70 flour mills in Georgia, but 67 of them ceased production due to shortage of wheat (Tanchum, 2023). As of 2024, there were 39 active elevators in Georgia, a decrease of four from the previous year (GEOSTAT, 2024, 2025c). The majority of the elevators are located in Kvemo Kartli (10 elevators) and Kakheti (9). Among the 39 elevators active in 2024, 46.2% are equipped with modern technology, 38.5% with partial modern technology and 15.4% lack modern technology entirely. Over half of the products stored in the elevators were wheat (61.3%), followed by soybean grist (19.1%), wheat flour (8.2%), and corn (8.0%). Of the 280.1 thousand tons of products sold by elevators, a third (32.9%) came from local production. Wheat flour accounted for the majority of locally produced goods sold by elevators in terms of volume and value. Nearly 82% of value of local production sold consisted of wheat flour, while bran represented 11.9% (GEOSTAT, 2025c).
Many mills were operating at 30% to 60% capacity, while some were not operating at all. Keeping flour mills in operation is in the government’s best interest, as mill production generates tax revenue. Currently, domestic wheat production in Georgia meets only approximately 15% of the milling industry’s total demand and is primarily supplied to smaller mills rather than larger operations. Most mills in Georgia blend 10–15% of Georgian wheat into their production mix. Medium- to large-scale millers mill approximately 10% of Georgia wheat, while smaller, seasonal millers process approximately 50% of the domestic wheat supply. Mills typically produce three products: Extra Grade, High Grade, and 1st or 2nd Grade. Extra grade flour is of lowest ash content and the brightest white in color. This flour would be of highest quality and is used for pastries, cakes and cookies and has an adjustable price. High grade flour is slightly higher in ash content and bran than extra grade and is a good quality bread flour. 1st grade or 2nd grade flour contains the highest amount of bran and the highest ash content. It is darkest in color and of lower quality, sold as the least expensive bread flour at a fixed price.
Medium and large-scale millers face challenges with Georgian wheat as it often fails to consistently meet the quality and quantity requirement necessary for efficient operations. Some millers describe Georgian wheat as being excessively dirty or of lower quality. The fragmented farmland and small plot sizes is believed by some millers to negatively impact wheat quality and consistency. Farmers produce small quantities of wheat varieties with varying quality. Other millers view Georgian wheat more favorably.
The Georgian wheat industry lacks defined quality standards for incoming wheat, and there are minimal established procedures or monitoring to evaluate its quality. Despite some mills having access to a well-equipped lab for wheat and flour testing, mills do not fully use them for continual quality assessment. Some flour mills have equipment to assess flour color, but each mill uses their own equipment and there is no standardized color testing method in Georgia. As a result, the color assessment results hold limited value outside individual mills since testing parameters vary from one mill to another. In contrast, imported wheat entering the country via rail or ports is required to meet international standards, providing millers with a consistent product and enabling efficient operations. As a result, many larger-scale millers prefer imported wheat compared to domestic wheat. However, some mills and bakeries claim that the specifications listed on imported flour are inaccurate. Although imported wheat may have once been subject to international standards, some millers believe these standards are not being enforced. Since limited quality testing is being performed on incoming wheat or flour- whether domestic or imported- there is no clear understanding of its actual quality.
The increasing volume of wheat flour imports from Russia has led to a decline in domestic wheat flour production. This has impacted not only wheat producers, who have fewer opportunities to blend wheat for milling, but also the feed industry. With lower domestic flour production, there is a reduced supply of bran — a by-product of the milling process and a component of livestock feed — resulting in higher demand of feed wheat for livestock feed being imported into Georgia from Russia as cracked wheat. The Georgian feed mills tended to favor Russian feed wheat over local wheat due to it being cleaner and having less non-wheat contamination.
3.2 Georgian bakeries
During visits to Georgian bakeries, some bakers indicated preference for Georgian flour, citing its better color, higher loaf volume, improved elasticity, and improved fermentation properties. Flour milled from Georgian wheat was thought to have greater stability and better gluten quality. According to some bakers, Russian flour is known to have higher ash content, a darker color, coarser granulation, and lower water absorption. The quality of Russian flour varies depending on the region of origin. Russian flour is thought to enter the Georgian market with misleading labels or false marketing, as its baking indicators frequently fail to match the product specifications listed on the packaging. Some bakers believe that this mislabeling has contributed to a decline in overall flour quality on the market. Some bakers believe that efforts to maintain stable bread price for Georgian consumers has come at the expense of lower quality, as less expensive, lower-quality flour is being used.
Not all bakers agreed that Georgian flour was of superior quality, as some preferred Russian flour. Historically, Georgian wheat and flour were preferred to Russian due to its higher quality. However, this preference has shifted toward Russian flour, primarily due to its greater consistency in quality and quantity. By contrast, Georgian wheat and flour are more inconsistent, with quality varying from farm to farm and supply fluctuating from year to year. Some bakeries add enrichments into their flour, while others do not. Most flour from Georgian mills is enriched, while the majority of Russian flour is not. Certain bakeries use gluten and malt as flour improvers, and larger bakeries use other improvers and additives as well.
Currently, there is little to no instrumentation available for testing flour quality in Georgia. Baking tests and visual color assessments are the primary methods used to evaluate quality. Despite inconsistencies in the quality of flour from Georgia and Russian, bakeries do not allocate time or resources to conduct laboratory testing of the flour. Bakers are faced with limited supply of flour, and will use the flour that is available on the market regardless of laboratory test results. Even if there were no flour shortage, many bakeries would not conduct laboratory testing, as they lack awareness of many flour and dough testing processes. Gluten percentage is another key attribute in flour. Bakers typically prefer flour with a minimum gluten percentage of 30%. However, some are willing to accept flour with a gluten percentage as low as 24%.
In 2020, there were approximately 2700 bakeries in Georgia, consisting mainly of small entrepreneurs (Dalma News, 2020). According to interviewed bakers, finding employees with baking experience is a challenge, further exacerbated by the limited baking training opportunities available in Georgia. Since 2023, Hazard Analysis Critical Control Points principles (HACCP) has been mandatory for all food business operators (Ministry of Environmental Protection and Agriculture of Georgia, 2023). However, some bakeries are requesting either initial HACCP training or additional HACCP and food safety training to better understand the food safety standards expected in the baking industry. Bakers and their employees would benefit from baking courses or training seminars focused on both baking techniques and food safety practices.
Traditional Georgian bread is baked either in a tóné and pourne oven. The tóné oven bakes bread by sticking pieces of dough to its hot walls, while the pourne oven uses flat stones for baking. Georgian lavashi and shoti are the most common breads, and both require flour with sufficient gluten content and gluten quality to adhere to the tóné oven walls. Premium flour is typically used to make bread in tóné ovens (Dalma News, 2020). The pourne oven is typically used for other types of breads such as Meskhuri breads in South Georgia (Bedoshvili et al., 2021).
Over half of the bread produced in Georgia is social bread, commonly referred to as poor people’s bread. It is considered the most necessary and in-demand product for the Georgian population (Dalma News, 2020). Due to its fixed price, flour pricing is not adjusted in response to wheat price fluctuations, which is not sustainable for mills. First-grade flour is typically used for social bread (Dalma News, 2020). The Georgian government has prioritized keeping flour prices as low as possible to ensure the bread remains affordable for low-income consumers.
3.3 Feed manufacturing
During the visits to feed mills, local feed-grade wheat was observed to have poor protein content, excessive seed and insect contamination, and high moisture levels, often exceeding 15%. Feed mills face a 18% VAT on local wheat, but mills can avoid paying a VAT on Russian wheat by importing crushed feed-grade wheat from Russia. Russia suppliers pelletize their bran, which improves transportation and handling, reduces waste due to transportation and processing, increases manufacturing efficiency, ensures more uniform nutrient distribution, and enhances feed conversion ratios (Briggs et al., 1999; Esmail, 2019; McKinney, 2013). Despite these advantages, some feeds mills prefer using wheat instead of pelletized Russian bran, since it is not compatible with their feed products.
In the past, when Georgian wheat mills operated at full capacity, 90% of the bran used in feed production was sourced locally. However, due to the reduced milling activity, mills are unable to procure sufficient quantity of bran locally, leading some to stop using it in their feed. Current local wheat production is only sufficient to support three to four months of feed manufacturing per year. Approximately 55% of this local feed production is consumed within the domestic market.
Bran derived from Georgian wheat tends to retain more residual starch compared to bran from Russian wheat that contributes to a higher feed energy value for poultry and swine diets. The majority of wheat-based feed products are formulated for poultry and swine, with potential expansion into aqua feed market in the future. Wheat typically comprises 25–30% of poultry feed rations and 12–15% of swine feed rations. However, as maize becomes more affordable in Georgia, it is displacing wheat in poultry feed formulations.
4. Wheat and flour quality assessment
This section presents an overall assessment of the three Georgian samples and the three Russian samples. Appendix A presents the detailed analytical results from assessments and tests conducted on the six samples. The samples underwent evaluation across five different assessment categories: wheat grade assessment, wheat non-grade assessment, flour quality tests, dough quality (rheological) tests, and baking evaluation. This testing process uses the same methodology used for U.S. Hard Red Winter Wheat (HRW) samples for the U.S. Wheat Associates annual crop quality report. The six samples were compared to the five-year average of the Gulf-exportable HRW harvest data from U.S. Wheat Associates (2024).
4.1 Overall assessment of the samples
All three Georgian samples indicate weak or weaker gluten flour. The Georgian sample G1 had significant quality concerns, including very low test weight and high foreign material contamination. The presence of a foreign odor downgraded it to Sample Grade wheat. While G1 exhibited good protein content and its proportion of large kernel size, its weak gluten strength negatively impacted end-product performance. Pan breads showed fair to poor results, with borderline hard texture and dark coloration.
Sample G2 met the recommended test weight target, was a clean sample, and received U.S. Grade 1 HRW status. It was classified as a soft wheat due to the large presence of soft wheat kernels. Its flour had very good color and brightness, but its end-product performance was poor. It produced small volume pan breads, which was likely caused by its low protein content.
Sample G3 was graded as U.S. Grade 2 HRW, but had a slightly low test weight and an increased presence of foreign material. It had average protein content, but its poor sedimentation levels and lactic acid SRC indicated weaker gluten. Weak gluten strength was confirmed by the farinograph, alveograph and extensograph curves. End-product performance was poor, with the baked pan bread having a hard texture.
The Russian sample R1’s test weight was below the minimum acceptable limit for millers, resulting in a U.S. Grade 3 HRW classification. It had good protein content, and sedimentation values. Based on its kernel characteristics, R1 was classified as a mixed class. R1 demonstrated good overall flour functionality and gluten quality, aligning with baseline recommendations for HRW. However, this flour sample had a slightly darker color than desired. Although its GPI value exceeded the threshold for optimal pan bread loaf volume, the pan bread had only fair volume and a hard texture. Overall, R1 performed fair to poorly in its end-products.
R2 had the second lowest test weight among the six samples, and received a U.S. Grade 3 HRW. This sample contained high amounts of dockage, making it a dirty sample. It had average protein content and based on kernel characteristics, it was classified as a hard wheat. R2 exhibited a poor sedimentation value, indicating weak gluten strength. Russian sample R2 exhibited slightly weaker flour quality than expected given its protein and wet gluten content, as indicated by its stability and low GPI. End-product performance was poor, producing small pan breads with a hard texture. With a U.S. Grade 3 HRW, Samples R1 and R2 would not typically be accepted by mills.
R3 was classified as U.S. Grade 2 HRW wheat but had slightly lower test weight than the five-year average. This sample had a high percentage of total defects compared to the others. It had good protein content, sedimentation, and kernel traits, and was classified as hard wheat. However, R3 was affected by significant sprout damage, as indicated by a low falling number. Excessive enzyme activity may make the flour unsuitable for baking and affected wheat may be rejected. R3 had weak Farinograph, Alveograph and Extensograph curves, likely due to the sprout damage in the wheat. Russian sample R3 met the baseline expectations for HRW in key criteria, including lab extraction rate, color, protein content, wet gluten content, starch damage, and SRC. However, due to the higher levels of enzyme activity, this flour end-product performance was only fair. It produced pan breads with fair volumes and slightly hard texture. None of the six samples demonstrated optimal performance across all categories. Without the sprout damage, R3 has the best overall qualities.
Table 1 provides a brief overall of analytical results and insights from selected assessments and tests conducted on the six samples. Not all of the assessments and tests conducted are included in this table.
Overall assessment of Georgian and Russian samples
Citation: International Food and Agribusiness Management Review 29, 1 (2026) ; 10.22434/ifamr.1208
5. Recommendations
Based on the visits with flour mills, feed mills and bakeries and the comparison between the Georgian and Russian wheat samples, several recommendations have been developed to address key challenges, improve operations, and improve overall quality of Georgian wheat and wheat flour. Although Georgian mills and bakeries cannot directly influence the quality of the wheat and flour they receive, they can gain a better understanding of it through proper testing methods and practices. This deeper understanding can generate valuable data for Georgian producers, wheat breeders, government officials, and other supply chain stakeholders, helping them to identify areas for improvement in wheat cultivation and supporting efforts to enhance the quality of domestically produced wheat. While increasing wheat production is important, improving wheat quality is equally important to producing flour that meets the needs of millers, bakers, consumers. It is not enough to increase the quantity of wheat produced; higher quality wheat is needed to ensure consistent, high-quality flour. By implementing regular quality testing, millers and bakers can provide critical feedback to wheat producers and input suppliers such as seed breeders and crop protection providers regarding gluten quality, protein content, and test weight. This information can help guide improvements in wheat genetics and agronomic practices, ultimately increasing the yield and quality of wheat and the profitability of the entire value chain.
To support the dissemination and adoption of improved practices, a stronger connection between the research and extension services is necessary. Extension agents can build trust with producers by demonstrating the value of evidence-based recommendations, while also positioning themselves as credible sources of information. Strengthening research programs and improving training programs of local agronomists would enhance the quality and effectiveness of these extension services and ensure that producers are receiving the knowledge and guidance to successfully adopt and implement new methods.
5.1 Quality control and assurance, food safety, employee safety and other training programs
To address inconsistencies in wheat and flour quality, it is important to establish quality specifications and implement testing for quality verification. There is a need for adequate and updated wheat, flour, and dough testing equipment across many of the bakeries and some of the mills. Millers should receive education on the importance of wheat quality and develop an understanding of the key grading factors. Training sessions on grain grading should be conducted at locations equipped with proper testing equipment. Millers and bakers would benefit from short courses focused on flour quality and functionality using a number of testing methods. Millers would also benefit from training in storage and blending best practices, as well as basic milling training to understand the fundamentals of the milling process and proper equipment operation. Training in equipment maintenance is necessary for many mills, focusing on proper maintenance protocols, employee safety, food safety, and equipment efficiency.
While quality testing and related training are critical to improving wheat and flour quality, the milling and baking sectors also require broader capacity-building programs, particularly in food safety and operational best practices. Strengthening the capacity of millers and bakers is important not only for meeting current standards but also for ensuring the long-term competitiveness and sustainability of the sectors. Food safety improvements are needed for most of the mills and bakeries visited; however, the feed mills appear to have adequate food safety protocols in place. Comprehensive food safety training for all employees at the flour mills, bakeries, and feed mills is important to ensure compliance with current and future quality assurance and quality control regulations, including good manufacturing practices (GMP) and HACCP trainings. Although HACCP has become mandatory for all food business operators, these standards are being gradually implemented throughout Georgia and many mills and bakeries are still in the early stages of adoption. Some bakeries are in process of conducting audits to improve food safety practices, which is a step in the right direction toward meeting international standards and positioning the sector for long-term growth.
5.2 Improving gluten strength along the supply chain
Based on the quality assessment tests, gluten strengthen is a key attribute deficient in the Georgian samples. Improving gluten strength requires interventions at the wheat production stage, with a particular focus on protein quality and content. Selecting wheat varieties with genetic traits for stronger gluten and a targeted protein content range has the greatest influence on protein content and baking performance (Luo et al., 2000). To improve both quality and yield, the Georgian government aims to increase new wheat seed adoption by 20–30% among wheat producers. Soil fertility and nitrogen management are also important for enhancing wheat protein content. Increased nitrogen application rates generally leads to an increase in grain total protein and grain storage proteins, gliadin and glutenin, which are the foundation of gluten (An et al., 2024; Luo et al., 2000). However, excessive nitrogen application can lead to diminishing returns, by promoting increased vegetative growth instead of increased protein content (Carson and Edwards, 2009). The timing of nitrogen application is also important. Late-season nitrogen application, particularly during anthesis or grain filling, significantly increases grain protein content. Also, combining late-season nitrogen application with sulfur can further strength gluten networks, as sulfur promotes glutenin biosynthesis, improving the glutenin: gliadin ratio, resulting in a stronger gluten elasticity (Luo et al., 2000; Peng et al., 2022).
Environmental factors also play an important role for optimizing gluten quality. Moderate drought stress increases wheat storage protein content, thereby enhancing gluten strength, but this often comes at the expense of yield. A more balanced approach involves using micro-sprinkler irrigation in combination with late-season nitrogen application to ensure wheat has adequate water and nutrient availability after flowering. This strategy helps increase protein content without decreasing yield (Peng et al., 2022).
Maintaining plant health is another critical factor in protecting grain quality. Certain diseases and insect pests can reduce grain protein content or can introduce enzymes into the plant that degrade gluten. Fusarium head blight (aka “Scab” or “Fusariosis”), can contaminate the wheat kernels with mycotoxins such as DON that is harmful to humans and livestock, and it produces proteolytics enzymes that degrade wheat proteins, affecting the quality of the infected grains and reducing wheat end-use quality (Bacala et al., 2021). There are a number of ways that producers can effectively control Fusarium in the field such as apply fungicides at flowering when Fusarium infection risk is highest, plant Fusarium-resistant varieties, and use crop rotation or residue management to decrease the presence of inoculant (Edwards and Hunger, 2013; Kleczewski, 2014). Foliar fungal diseases, such as rusts and powdery mildew, can also negatively affect yield and baking quality, by impairing kernel development (Everts et al., 2001). Planting disease resistant varieties and applying fungicide at the correct time can effectively manage these diseases and protect overall wheat quality (Wegulo, 2010).
Timely harvest to prevent sprouting is important to prevent weather-related damage that can weaken gluten. Pre-harvest sprouting (PHS) occurs when wheat germinates within the grain head before harvest, and activates enzymes that break down starch and gluten. PHS results in lower yields and it limits end-use applications, due to reducing flour functionality (Thomason et al., 2024).
Once the wheat arrives at the mill, proper grain storage is important to help maintain the quality of the wheat. Wheat quality can never improve through storage, but through proper storage practices it can be maintained until the mill is ready to use it. Proper cleaning of the wheat helps ensure all defect, damage, and foreign material are removed from the wheat. If the contaminates are not efficiently cleaned out, some will end up in the flour and negatively impact the flour quality and final product quality. Proper wheat conditioning and tempering of the wheat are also important, ensuring the wheat is effectively separated into its components while minimizes bran contamination. Although the wheat bran layers contain a large amount of protein content, the proteins in the bran layers do not contain the gluten forming proteins, gliadin and glutenin. Therefore, excessive bran in the flour negatively affects the flour quality as the wet gluten and overall gluten strength would be reduced. The use of controlled grinding and careful monitoring of the milling process can help ensure overall higher flour quality and higher extraction rate on the mill to a point. At very high extraction rates (above 80%), the proportion of bran particles in the flour increases. Bran does not contain gluten forming proteins and disrupts the gluten-protein matrix, resulting in weaker dough properties and reduced gas retention capacity during fermentation.
To maintain consistent protein content and gluten strength, flour mills frequently blend wheat from different classes or lots to achieve a target protein content and optimal baking performance. Higher gluten wheat is typically incorporated into the mix to increase the protein content of the final flour. Flour mills blend different flour streams after milling to produce a consistently, uniform product with the desired characteristics. This blending practice is a key intervention to ensure the final flour meets the baking performance requirements across various end products. To further enhance gluten strength and improve dough elasticity and bread volume, additives such as vital wheat gluten and oxidizing agents can be incorporated to the flour. Currently, some bakeries add about 25–35% gluten to improve flour quality. However, most bakeries prefer to have access to naturally high quality flour rather than relying on these expensive additives. Larger bakeries often use other additives like dough conditioners and stabilizers to improve baking performance. Although these additives can improve the quality of the end product quality, they also increase production cost, which is not financially viable for Georgian bakeries given that the price of social bread is relatively fixed. By implementing these interventions and sourcing high quality raw wheat, flour millers can better provide bakeries and food manufacturers with a consistent, high-quality flour that meets the specifications required for various baked goods.
5.3 Flour fortification
Given that wheat products contribute a significant portion to a Georgian’s daily food intake, fortifying wheat flour is a good opportunity to have a national-level health impact. Fortification of processed flour is widely recognized as an efficient, safe, and cost-effective strategy to deliver vitamins and micronutrients to large populations at risk of nutrient deficiencies. It has been shown to improve nutritional outcomes related to iron deficiency anemia and deficiencies in folate, zinc, vitamin A and iodine. Fortification programs commonly enrich wheat flour with iron, thiamin, riboflavin, niacin, and folic acid. In addition to addressing vitamin and micronutrient inadequacies and deficiencies of public health concern, fortification can also help restore the nutrients lost during the milling process, and enhance the nutritional content of processed flour closer to levels found in unrefined wheat (Darnton-Hill, 2017;WHO, 2022). In 2016, there was a policy discussion in Georgia to mandate the fortification of wheat flour (Katsia, 2016). The outcome of this discussion is not known. According to the Global Fortification Data Exchange (2024), the fortification status of wheat flour in Georgia is unknown. Food fortification training could be beneficial for flour mills and bakeries, particularly as policy discussions on fortification continue.
5.4 Storage
Improving and expanding wheat storage capacity at flour mills is key for strengthening Georgia’s food security and improving its ability to manage supply fluctuations. Increased storage would allow mills to hold larger reserves, ensuring a stable wheat supply for processing. The Government of Georgia has been investing in agri-food infrastructure, focusing on modernizing processing and storage facilities to meet international standards (Ministry of Environmental Protection and Agriculture of Georgia, 2023). While storage facilities for both wheat flour and wheat grain are needed, a greater emphasis should be placed on wheat grain due to its strategic advantages for food security and economic stability. Wheat grains have a longer shelf life, retain their nutritional value longer, and are less susceptible to oxidation and pests than flour (Heshe et al., 2015; Sinka et al., 1988; Tufts Food Lab, 2022). By storing wheat grain, Georgian mills can produce flour on demand, ensuring a continuous supply even during trade restrictions, supply chain disruptions, conflicts, or poor harvests. Georgian millers and bakers state a preference for maintaining at least two months of grain reserves to safeguard against supply fluctuations. Increased storage capacity would also enable millers to segregate wheat by class and quality attributes, improving blending and ensuring consistent flour quality for mills and bakeries. Modern storage facilities could enable pre-cleaning wheat before storage, improving the storability of wheat to help maintain its quality easier. Strengthening wheat grain storage infrastructure will support Georgia in building a more resilient, self-sufficient, and adaptable wheat supply chain.
5.5 Trade diversification
In addition to strengthening the domestic wheat industry, Georgia can seek out alternative markets for wheat to secure a more reliable supply. Trade diversification is a complementary strategy to reduce the risks of supply chain disruption and exposure to geopolitical pressures. At present, most wheat and wheat flour imports from Russia arrive by truck through the LARS corridor. Importing wheat by sea through the Poti grain terminal is an alternative option, though it is more expensive and has longer delivery times. Countries in the Black Sea region that could source wheat include Bulgaria, Romania, and Turkey. The U.S. and Canada are alternatives sources outside of the Black Sea region. The key constraint is not availability of wheat, but the increased costs and shipping delays associated with sourcing from alternative wheat markets (Shanoyan et al., 2025).
6. Conclusion
Georgia’s significant dependence on imported wheat, especially from Russia, creates major food security risks for Georgia. Recent wheat supply disruptions caused by the global pandemic and the Russia-Ukraine conflict have emphasized the vulnerability of Georgia’s wheat supply chain, and reinforced the need for strategies to improve domestic production of wheat and wheat flour. This study aimed to evaluate the Georgian wheat and milling industry, compare the quality of domestically produced wheat and flour with Russian imports, and provide recommendations to enhance Georgia’s wheat industry.
The research team conducted site visits to multiple flour mills, bakeries, and feed mills across Georgia, assessing operational efficiency, food safety practices, and integrity of the infrastructure. Interviews with millers and bakers indicated a divided preference for domestic versus Russian flour. Some Georgian bakers favored local flour for its improved elasticity and fermentation properties and better color, while others preferred Russian flour for its greater consistency in quality and supply. However, a lack of standardized wheat and flour testing protocols in Georgia has contributed to misperceptions regarding quality. To address this, wheat samples from Georgian and Russian sources were collected and examined using laboratory testing to evaluate their grain quality characteristics and milling and baking properties. Findings revealed that the Georgian samples indicated weaker gluten flour while the Russian samples, although still lower and weaker quality than U.S. HRW, were more aligned with the characteristics of HRW.
To strengthen Georgia’s wheat industry, several key interventions focused on supply chain upgrading are recommended, which include implementing standardized wheat and flour quality testing, enhancing milling and storage infrastructure, and providing training programs for millers and bakers on wheat, flour, and dough testing, food safety, quality control, and regulatory compliance. At the producer level, selecting high-gluten wheat varieties, optimizing fertilizer application and irrigation, and controlling disease can help increase protein content. Expanding the selection of available seed varieties either through a national seed breeding program or by easing restrictions on seed imports would further enable producers to choose varieties with desired traits, such as high protein content, resistance to disease and pests, improved storability, and other key agronomic and quality attributes. Milling practices such as proper cleaning, tempering, controlled grinding and wheat and flour blending can provide bakeries and food manufacturers with reliable, high quality flour. Improving wheat storage capacity at mills and promoting strategic wheat segregation by quality traits and grade can improve blending efficiency and product consistency, resulting in higher quality baked goods. Given wheat’s prominence in the Georgian diet, fortification initiatives to enhance nutritional outcomes may be an area for Georgian bakeries to explore.
In addition to supply chain upgrading interventions, agricultural transformation through land consolidation has the potential to increase agricultural productivity in Georgia. Currently, highly fragmented farmland limits producers’ competitiveness by reducing efficiency and preventing economies of scale. As a result, producers’ yields suffer as well as the quality of the wheat. Based on the interviews with the research team, many stakeholders along the supply chain stated land fragmentation as a major contributing factor to Georgia’s inconsistent supply of high quality wheat.
Research has shown that land consolidation improves agricultural productivity and efficiency (Hiironen and Riekkinen, 2016; Looga et al., 2018; Nguyen and Warr, 2020). Land consolidation programs are not only limited to the reallocation of land, but they are a part of a broader rural development strategy, which may include community-based agro-harvesting and storage systems, upgraded road networks, and the construction and rehabilitation of irrigation and drainage systems (FAO, 2003; Hartvigsen et al., 2023; Pašakarnis and Maliene, 2010). For these consolidation efforts to succeed, active producer participation is essential to ensure local buy-in and sustainability (Lisec et al., 2014). Effective programs require involvement from multiple stakeholders, including national, regional and local governments, farmers’ groups and other related associations, as well as transparency in the planning and implementation (Hartvigsen et al., 2003). Support from agricultural extension agents is important. Extension services provide the technical assistance producers need to adopt new practices, and they help build trust and confidence in the consolidated process, which encourages broader producer participation (Hartvigsen et al., 2023). Together these interventions would improve farm-level efficiency as well as strengthen Georgia’s wheat supply chain.
The Georgian government has set an ambitious goal of achieving 50% wheat self-sufficiency in the coming years. Achieving this goal would strengthen Georgia’s national food security and reduce its dependence on Russian imports. Historically, much of Georgia’s domestic wheat has been lower-grade and used for livestock feed, but improving its quality is essential to meeting Georgia’s self-sufficiency goals. By adopting these interventions, Georgia can improve the quality of its domestic wheat and flour, enhance the competitiveness of its domestic wheat industry, and reduce reliance on Russian imports. These efforts will contribute to a more resilient, self-sufficient wheat supply chain, and promote long-term stability and sustainability in the country’s wheat industry.
References
AACCI. 2010. AACC Approved Methods of Analysis, 11th Ed. Cereals and Grains Association, St. Paul, MN. Available online at https://www.cerealsgrains.org/resources/Methods/Pages/default.aspx
An, H.-Y., J.-J. Han, Q.-N. He, Y.-L. Zhu, P. Wu, Y.-C. Wang, Z.-Q. Gao, T.-Q. Du and J.-F. Xue. 2024. Influence of nitrogen application rate on wheat grain protein content and composition in China: a meta-analysis. Agronomy 14(6): 1164. https://doi.org/10.3390/agronomy14061164
Bacala R., B.X. Fu, K. Cordova and D.W. Hatcher. 2021. Wheat Fusarium protease specificity and effect on dough properties. Foods 10(7): 1585. https://doi:10.3390/foods10071585
Bedoshvili, D., M. Mosulishvili, G. Chkhutiashvilid, I. Maisaia, N. Ustiashvili and M. Merabishvili. 2021. Diversity and local use of wheat in Georgia. Annals of Agrarian Science 19(2): 103–110. Available online at https://journals.org.ge/index.php/aans/article/view/245
Briggs, J.L., D.E. Maier, B.A. Watkins and K.C. Behnke. 1999. Effect of ingredients and processing parameters on pellet quality. Poultry Science 78: 1467–1471. https://doi.org/10.1093/ps/78.10.1464
Carson, G.R. and N.M. Edwards. 2009. Criteria of wheat and flour quality. In Wheat: Chemistry and Technology, 4th edn. AACC International, St. Paul, MN, pp. 97–118.
Chen, R. Y., and B.W. Seabourn. 2019. HWWQC Technical Board and Goals for HWW Breeders (Appendix B). Milling and baking test results for hard winter wheat harvested in 2019. USDA-ARS Hard Winter Wheat Quality Laboratory. Wheat Quality Council. Available online at https://www.wheatqualitycouncil.org/2019/Hard-Winter-Wheat-Milling-And-Baking-Test-Results-2019.pdf
Commersant. 2023. Georgia still imports wheat and flour from Russia, our situation is unchanged. Available online at https://commersant.ge/en/news/business/georgia-still-imports-wheat-and-flour-from-russia-our-situation-is-unchanged-association-of-grain-producers
Dalma News. 2020. “Social bread” will be available in Georgia: flour is getting more expensive, but bread is not? Available online at https://dalma.news/ru/socialniy-xleb-budet-dostupen-v-gruzii-muka-dorozhaet-a-hleb-net/
Darnton-Hill, I. 2017. Fortification of Wheat Flour. e-Library of Evidence for Nutrition Actions (eLENA). World Health Organization. Available online at https://www.who.int/tools/elena/bbc/wheat-flour-fortification.
Edwards, J. and B. Hunger. 2013. Fusarium head blight (head scab) of wheat: questions and answers (PSS-124). Oklahoma Cooperative Services, Division of Agricultural Sciences and Natural Resources, Oklahoma State University, Stillwater, OK. Available online at http://osufacts.okstate.edu
Esmail. S.H. 2019. Effects of pelleting on poultry performance. Poultry World. Available online at https://www.poultryworld.net/health-nutrition/effects-of-pelleting-on-poultry-performance/#:~:text=Processing%20of%20feed%20in%20uniform,factors%20and%20hence%20improves%20performance
Everts, K.L, S. Leath and P.L. Finney. 2001. Impact of powdery mildew and leaf rust on milling and baking quality of soft red winter wheat. Plant Disease 85(4): 423–429. https://doi.org/10.1094/PDIS.2001.85.4.423
Ferrari, M.C., M.T.P.S. Clerici and Y.K. Chang. 2014. A comparative study among methods used for wheat flour analysis and for measurements of gluten properties using the Wheat Gluten Quality Analyser (WGQA). Food Science and Technology 34(2): 235–242. https://doi.org/10.1590/fst.2014.0038
FAO. 2003. The design of land consolidation pilot projects in Central and Eastern Europe. FAO Land Tenure Studies No. 6. FAO, Rome.
FDA. 2018. Guidance for industry and FDA: advisory levels for deoxynivalenol (DON) in finished wheat products for human consumption and grains and grain by-products used for animal feed. Available online at https://www.fda.gov/regulatory-information/search-fda-guidance-documents/guidance-industry-and-fda-advisory-levels-deoxynivalenol-don-finished-wheat-products-human
Gelashvili, S. 2024. Russian wheat policies and Georgia’s strategic responses. Policy Paper N2024/04. International School of Economics at TSU Policy Institute. Available online at https://iset-pi.ge/storage/media/other/2024-04-29/f36f4c20-0612-11ef-897c-5748d67678dc.pdf
Gelashvii, S. and Y. Babych, 2016. We may not be hungry, but we are starving. … ISET Economist Blog. International School of Economics at TSU Policy Institute. Available online at https://iset-pi.ge/en/blog/293-we-may-not-be-hungry-but-we-are-starving
Gelashvii, S and E. Seturidze. 2024. Russian wheat policies and Georgia’s strategic trade policies. Free Network. Available online at https://freepolicybriefs.org/wp-content/uploads/2024/03/20230311.pdf
GEOSTAT. 2023a. External merchandise trade in Georgia 2022 (preliminary results). Available online at https://www.geostat.ge/media/50862/External-Merchandise-Trade-of-Georgia-in-2022-(Preliminary).pdf
GEOSTAT. 2023b, May 29. Ministry hosted the meeting to discuss the sale of Georgian wheat in the local market. Available online at https://mepa.gov.ge/En/News/Details/21268
GEOSTAT. 2024. Survey results for livestock slaughterhouses, elevators and cold storage facilities 2023. Available online at https://www.geostat.ge/media/63192/Survey-Results-for-Livestock-Slaughterhouses%2C-Elevators-and-Cold-Storage-Facilities---2023.pdf
GEOSTAT. 2025a. Production of annual crops. Available online at https://www.geostat.ge/en/modules/categories/196/agriculture
GEOSTAT. 2025b. Food security. Available online at https://www.geostat.ge/en/modules/categories/297/food-security
GEOSTAT. 2025c. Survey results for livestock slaughterhouses, elevators and cold storage facilities 2024. Available online at https://www.geostat.ge/media/71251/Survey-Results-for-Livestock-Slaughterhouses%2C-Elevators-and-Cold-Storage-Facilities---%282024%29.pdf
Global Fortification Data Exchange. 2024. Georgia fortification dashboard. Available online at https://fortificationdata.org/country-fortification-dashboard/?alpha3_code=GEOandlang=en
Hartvigsen, M., K. Mitic-Arsova, M. Gorgan and K. Georgievski. 2023. Lessons learned from the introduction of land consolidation in North Macedonia during 2014–2023. FAO, Budapest. https://doi.org/10.4060/cc7573en
Heshe G.G., G.D. Haki, A.Z. Woldegiorgis and H.F. Gemede. 2015. Effect of conventional milling on the nutritional value and antioxidant capacity of wheat types common in Ethiopia and a recovery attempt with bran supplementation in bread. Food Science and Nutrition 4(4): 534–543. https://doi.org/10.1002/fsn3.315
Hiironen, J. and K. Riekkinen. 2016. Agricultural impacts and profitability of land consolidations. Land Use Policy 55: 309–317. https://doi.org/10.1016/j.landusepol.2016.04.018
International Grains Program. (n.d.). Wheat and flour testing methods: A guide to understanding wheat and flour quality (Version 2). Kansas State University, Wheat Marketing Center and Northern Crops Institute.
Katsia, Ia. 2016. Mandatory Flour Fortification in Georgia: a Boon or a Burden for the Poor? Economist Blog. International School of Economics at TSU Policy Institute. Available online at https://iset-pi.ge/en/blog/317-mandatory-flour-fortification-in-georgia-a-boon-or-a-burden-for-the-poor
Kereselidze, N. 2023. Analysis of the key factors affecting the productivity of cereal crops in Georgia. International Fund Dor Agricultural Development. Available online at https://www.50x2030.org/sites/default/files/resources/documents/2023-07/2021_Paper_Georgia_Nodar%20Kereselidze_Analysis%20of%20Key%20Factors%20Affecting%20the%20Productivity%20of%20Cereal%20Crops%20in%20Georgia.pdf
Khishtovani, G., N. Kapanadz, N. Kajaia and S. Mkervalidze. n.d. Wheat and flour sector in Georgia. Sector Snapshots 7. Available online at https://pmcg-i.com/app/uploads/2022/09/Wheat-SS-Final-ENG-1.pdf
Kleczewski, N. 2014. Fusarium head blight management in wheat. University of Delaware Department of Plant and Soil Sciences. Available online at https://www.udel.edu/academics/colleges/canr/cooperative-extension/fact-sheets/fusarium-head-blight-management-in-wheat/#:~:text=Suppression%20of%20FHB%20can%20be,wheatscab.psu.edu).
Lisec, A., T. Primožič, M. Ferlan, R. Šumrada and S. Drobne. 2014. Land owners’ perception of land consolidation and their satisfaction with the results — Slovenian experiences. Land Use Policy 38: 550–563. https://doi.org/10.1016/j.landusepol.2014.01.003
Looga, J., E. Jürgenson, K. Sikk, E. Matveev and S. Maasikamäe, 2018. Land fragmentation and other determinants of agricultural farm productivity: the case of Estonia. Land Use Policy 79: 285–292. https://doi.org/10.1016/j.landusepol.2018.08.021.
Luo, C., G. Branlard, W.B. Griffin and D.L. McNeil. 2000. The effect of nitrogen and sulphur fertilisation and their interaction with genotype on wheat glutenins and quality parameters. Journal of Cereal Science 31: 185–194. https://doi.org/10.1006/jcrs.1999.0298
McKinney, L. 2013. Processing, Performance, and Profit. Proceedings of the 34th Western Nutrition Conference, September 24-26, 2013. Saskatoon, SK. Available online at https://cabidigitallibrary.org by 129.130.54.85
Ministry of Environmental Protection and Agriculture of Georgia. 2023. Within the frames of the “Ministerial Hour”, the Minister of Environmental Protection and Agriculture, Mr. Otar Shamugia delivers a speech at the Parliament of Georgia. Available online at https://mepa.gov.ge/En/News/Details/21271
Nguyen, H.Q. and P. Warr. 2020. Land consolidation as technical change: economic impacts in rural Vietnam. World Development 127: 104750. https://doi.org/10.1016/j.worlddev.2019.104750.
Pašakarnis, G. and V. Maliene. 2010. Towards sustainable rural development in Central and Eastern Europe: applying land consolidation. Land Use Policy 27(2): 545–549. https://doi.org/10.1016/j.landusepol.2009.07.008
Peng Y., Zhao Y., Yu Z., Zeng J., Xu D., Dong J., Ma W. 2022. Wheat quality formation and its regulatory mechanism. Frontiers in Plant Science 13: 834654. https://doi:10.3389/fpls.2022.834654
Shanoyan, A., A.M. Featherstone and A. Khachatryan, A. 2025. Addressing food security risks due to trade constraints and geopolitical tensions: conceptual framework and practical application. International Food and Agribusiness Management Review: in press. https://doi.org/10.22434/ifamr1207
Sinka, R.N., C.J. Demianyk and R.I.H. Mckenzie. 1988. Vulnerability of common wheat cultivars to major stored-product beetles. Canadian Journal of Plant Science 68(2): 337–343. https://doi.org/10.4141/cjps88-044
Sputnik Georgia. 2025. Georgia extends duty on flour imports from Russia. UkrAgroConsult. Available online at https://ukragroconsult.com/en/news/georgia-extends-duty-on-flour-imports-from-russia/
Sowell, A. and B. Swearingen. 2022. Wheat outlook: February 2022. ERS WHS-22b. USDA, Washington, DC.
Sukhiashvili, V. 2023. How tax on imported flour affected wheat and flour import and prices. Grass FactCheck. Available online at https://factcheck.ge/en/story/42314-how-tax-on-imported-flour-affected-wheat-and-flour-import-and-prices#:~:text=The%20decrease%20in%20wheat%20imports,purchasing%20the%20remaining%20wheat%20crop
Tanchum, M. 2023. Georgia can end Russia’s stranglehold over its wheat supply with NATO assistance. The Central Asia–Caucasus Analyst. Available online at https://www.cacianalyst.org/publications/analytical-articles/item/13764-georgia-can-end-russia%E2%80%99s-stranglehold-over-its-wheat-supply-with-nato-assistance.html
Thomason, W., K.R. Hughes, C.A. Griffey, D.J. Parrish and W.F. Barbeau. 2024. Understanding Pre-harvest Sprouting of Wheat. Virginia Cooperative Extension Publication 424-060. Available online at https://www.pubs.ext.vt.edu/424/424-060/424-060.html
Tufts Food Lab. 2022. Milling and storage. Gerald J. and Dorothy R. Friedman School of Nutrition Science and Policy. Tufts University, Medford, MA. Available online at https://foodlab.nutrition.tufts.edu/milling-and-storage/
USDA. 2023. Grain Inspection Handbook — Book II: Grain Grading Procedures. Agricultural Marketing Service. USDA, Washington, DC. Available online at https://www.ams.usda.gov/sites/default/files/media/Book2.pdf.
USDA, AMS and FGIS. 2014. United States standards for wheat (Subpart M). USDA, Washington, DC. Available online at https://www.ams.usda.gov/sites/default/files/media/WheatStandards.pdf
USDA FAS. n.d. European Union wheat: country summary. IPAD. Available online at https://ipad.fas.usda.gov/countrysummary/?id=E4andcrop=Wheat (accessed 29 November 2024).
U.S. Wheat Associates. 2021. Solvent retention capacity recommendations. U.S. Wheat Associates. Available online at https://uswheat.org/wp-content/uploads/2024/07/2021-Solvent-Retention-Capacity-Recommendations.pdf
U.S. Wheat Associates. 2022. Solvent retention capacity (SRC): utilization and interpretation. U.S. Wheat Associates. Available online at https://uswheat.org/wheatletter/solvent-retention-capacity-src-utilization-and-interpretation
U.S. Wheat Associates. 2024. U.S. Wheat Crop Quality Report. 2024, Available online at https://www.uswheat.org/wp-content/uploads/2024-USW-Crop-Quality-Report.pdf
Wegulo, S.N. 2010. Powdery Mildew of Wheat. Publication No. G1997. University of Nebraska–Lincoln Extension, Lincoln, NE.
Wegulo, S.N., P.S. Baenziger, J. Hernandez Nopsa, W.W. Bockus and H. Hallen-Adams. 2015. Management of Fusarium head blight of wheat and barley. Crop Protection 73: 100–107. https://doi.org/10.1016/j.cropro.2015.02.025
WHO. 2022. Guideline: fortification of wheat flour with vitamins and minerals as a public health strategy. WHO, Geneva.
Appendix A
A1. Wheat Grade Data
Table A1 presents the U.S. wheat grade test results for the Georgian and Russian samples. Test weight is used to grade the wheat and can indicate potential milling yield and the overall condition of the sample (AACCI Approved Method 55-10.01) (AACC International, 2010). A low test weight may suggest issues occurring during the growing season or at harvest. Test weight is measured in pounds per Winchester bushels or kilograms per hectoliter. For pan bread, the recommended target test weight is greater than 60 lb/bu. The five-year U.S. average had a test weight of 60 lb/bu. Only one sample met the recommended target value, Georgian wheat sample G2 had a test weight of 61.3 lb/bu. Georgian wheat samples averaged 58.1 lb/bu and ranged from 57.2 lb/bu to 61.3 lb/bu. The average test weight for the three Russian wheat samples was 57.8 lb/bu and ranged from 56.7 lb/bu to 59.4 lb/bu. The Wheat Quality Council Hard Winter Wheat Technical Committee suggests a minimum acceptable test weight for millers of 58 lb/bu (Chen and Seabourn, 2019).
Wheat grade data from Georgian and Russian samples
Citation: International Food and Agribusiness Management Review 29, 1 (2026) ; 10.22434/ifamr.1208
Damaged kernels is another grade-determining factor, which represents the percentage of the kernels that have been materially discolored or damaged by physical or biological factors. Damage may result from disease, insect activity, frost or sprouting, all of which can negatively impact milling and flour quality. In the tested samples, all but one of the samples had less than 1% damaged kernels (Table A1). Russian wheat sample R3 had 1.7% of damaged kernels. Georgian wheat sample G2 had no damaged kernels.
Milling quality wheat is defined as wheat with a U.S. Grade 2 or better. Typically, mills will not accept wheat with a U.S. Grade 3 or lower for flour intended for human consumption. Sample G2 was the only sample to receive a U.S. Grade 1 HRW, as it had a high test weight and was a clean sample, with minimal total defects and no odor. Samples G3 and R3 were graded U.S. Grade 2 HRW due to their slightly lower test weights and elevated percentage of foreign material. Although most of the grade factors met the criteria for milling quality wheat, Samples R1 and R2 were graded as U.S. Grade 3 HRW, due to their lower test weight. Sample G1 received a U.S. Sample Grade, which means that it did not meet the requirements for the other grades (U.S. Grade 1–5), has musty, sour or objectionable foreign odor, or is heating or of distinctively low quality (USDA AMS and FGIS, 2014). Sample G1 had a very low test weight, high level of foreign material contamination, an excess amount of total defects, and the presence of a foreign odor. Without the foreign odor, Sample G1 would have received a U.S. Grade 4 HRW. Overall, only half of the samples (G2, G3 and R3) would be accepted by U.S. millers for flour for human consumption.
A2. Wheat non-grade data
Results from the non-grade tests — including wheat non-grade assessment, flour quality tests, dough quality (rheological) tests, and baking evaluation — do not affect the numerical wheat grades. However, these tests provide insights into the overall quality of both the wheat and flour. All non-grade factors, except moisture, are measured after dockage is removed. Explanations of select non-grade quality tests are included to highlight their importance. Table A2 presents the wheat non-grade test results for the Georgian and Russian samples.
Wheat non-grade data from Georgian and Russian Ssmples
Citation: International Food and Agribusiness Management Review 29, 1 (2026) ; 10.22434/ifamr.1208
Dockage refers to the material that is removed when the wheat is cleaned using standard cleaning equipment. Dockage typically includes all matter other than wheat, such as other grain cereals (barley and oats), ergot, dirt, fertilizer, stones, small seeds and roughage, such as chaff and threshed wheat heads. Dockage also includes any underdeveloped, shriveled, or small pieces of wheat kernels that can be removed during the cleaning process (Carson and Edwards, 2009). The type and quantity of foreign material that remains after the proper removal of dockage and shrunken and broken kernels can affect end product quality and milling extraction (Carson and Edwards, 2009). Official USDA procedures were used to determine the dockage in these six samples (USDA, 2023). The average percentage of dockage in the Russian samples was 1.3% with a range of 0.3–2.2%. The Georgian samples had an average dockage of 0.8% with a range of 0.1–1.7%. Russian samples, R2 and R3 and the Georgian sample G1, had the highest percentage of dockage and were considered to be dirty samples.
Moisture content is an indicator of storability of the wheat and flour. Wheat and flour with moisture content greater than 14% are more susceptible to mold, bacteria growth, and insect infestation, all which can deteriorate the quality of the wheat and flour during storage. Moisture content is expressed as the percentage of water by weight in a sample. A moisture content of 14% (moisture basis, mb) is commonly used as the standard reference of other quality tests (AACCI Approved Methods 39-01.01, 39-10.01 and 39-11.01) (AACC International, 2010). Before milling, flour millers adjust the wheat’s moisture to a standard moisture level by adding water, which toughens the wheat bran layers, mellows the wheat endosperm, and ultimately increases the grain’s weight. This is referred to as wheat conditioning and tempering and is a vital step in the flour milling process. For wheat with lower moisture content, millers can inexpensively increase its weight by adding water resulting in higher profitability for the mill. Lower moisture wheat is also more stable during storage, reducing the risk of spoilage. The moisture content for the five-year U.S. average was 11.2%, which matches the moisture content of sample G3. Samples G1 and G2 had a moisture content of 12.4 and 11.6%, respectively. All three of the Russian samples had lower moisture levels, averaging 9.5%, with a range of 8.8–10.1%. None of the samples had high moisture content that would negatively impact storability.
The thousand kernel weight (TKW) is a complementary measurement to the test weight, and it indicates the mass of the wheat kernel. TKW is the weight of 1000 kernels of wheat in grams. Wheat breeders and flour millers follow a general rule of thumb when interpreting the TKW: wheat with a high TKW is expected to have a greater potential flour extraction. For hard winter wheat, the ideal TKW is 30 g or heavier. The average TKWs for the Georgian and Russian wheat samples were 35.1 and 31.8 g, respectively. Samples G2, G3 and R3 had TKW of 34 g or higher and were considered to have excellent TKW.
Samples were tested for deoxynivalenol (DON) using a lateral flow strip following the Charm POSA DonQ2 Quantitative Test method. DON is a toxin produced by fusarium fungi and can occur in feed grains grown under warm and moist environments experiencing frequent precipitation (Wegulo et al., 2015). The acceptable limit of DON in wheat varies by country and intended use. In the U.S., the maximum allowable level in finished wheat products, e.g., flour and bran, for human consumption is 1.0 ppm. For animal feed, the acceptable DON limit ranges from 5 ppm to 10 ppm, dependent on the animal species and the proportion of grains or grain by-products in their diet (FDA, 2018). All of the samples had DON levels below 0.5 ppm.
Protein content varied from 11.3% (sample G2) to 12.6% (sample R3) on a 12% moisture basis, with an average of 12.0% (AACCI Approved Method 39-25.01) (AACC International, 2010). This narrow range suggests that the flour samples are optimal for bread manufacturing, which typically requires a flour protein content between 10 and 12% (Ferrari et al., 2014). Three of the samples — G1, R1 and R3 — exceeded the 12% target for protein content and were classified as having good protein content. Samples R2 and G3 had average protein for HRW, while G2 had lower protein content.
Ash is the inorganic or mineral content of the wheat or flour, and is affected by the soil and climate where the wheat is grown. Wheat cultivated under irrigation can have higher ash levels. Ash is mainly concentrated in the bran and is a measure of the grade or type of flour. Flour ash content is an indicator of milling performance by indirectly revealing the level of mineral content (bran) contamination in the flour. Higher ash content indicates a greater presence of non-endosperm material, which is known to decrease the flour’s baking quality. Ash content is measured as the percentage of minerals by weight in wheat or flour (AACCI Approved Method 08-01.01) (AACC International, 2010). For the three Georgian wheat samples, the average ash content was 1.50% on a 14% mb, with a range of 1.44–1.58%. The five-year U.S. average matched the highest Georgian sample at 1.58%. The Russian samples had an average wheat ash content of 1.33%, ranging from 1.30% to 1.35%.
The sedimentation test provides information on both the protein quantity and the quality of ground wheat and flour samples (Table A2). It is used as a screening tool in wheat breeding and milling applications. In this test, water and lactic acid are added to a small sample of flour or ground wheat, which is then mixed. The resulting sedimentation is measured to assess gluten strength. Wheat and flour samples with low protein content and weak gluten typically have sedimentation values of 20 or less, compared to high protein wheat with strong gluten can have sedimentation values of 70 or higher (AACCI Approved Method 56-61.02) (AACC International, 2010). There is a positive correlation between sedimentation volume and gluten strength or loaf volume. For the Georgian samples, the average sedimentation value was 38.9 ml, with a range of 35.7 (G3) to 41.6 ml (G1). For the Russian samples, the average sedimentation value was 42.7 ml with a range of 36.6 (R2) to 46.5 ml (R1). Samples R1 and R3 are considered to have good sedimentation values, while G1 has fair value and G2 has a poor value. The samples with the lowest sedimentation values, G3 and R2, are classified as having very poor sedimentation values.
The falling number is a viscosity analysis and measures the level of enzyme activity, which can have an effect on flour quality. The wheat falling number was determined using AACCI Approved Method 56-81.04 (AACC International, 2010) in conjunction with the 2019 USDA/FGIS barometric pressure correction modification. A high falling number indicates minimal enzyme activity, and a low falling number indicates substantial enzyme activity and sprout damaged wheat or flour. A high falling number can be corrected by blending the wheat or by adding enzymes to the flour to help with the breakdown of starch into fermentable sugars. A low falling number cannot be modified, as enzymes cannot be removed. As a result, flour with an excessively low falling number may be unusable and the affected wheat should be rejected. For pan bread, the recommended target value for falling number is greater than 300 s. The average falling number for the three Georgian wheat samples was 388 s, ranging from 331 to 418 s. The average falling number for the Russian wheat samples was 349 s, varying from 172 to 519 s. Russian sample R3 had a low falling number of 172 s, indicating a high level of enzyme activity. The flour from this wheat sample is expected to have poor baking qualities. Typically, mills would not source wheat with a falling number below 300 s or with a high level of enzyme activity present.
The Single Kernel Characterization System (SKCS) measures key properties of individual kernels including weight, diameter, and hardness index (HI). The AACCI Approved Method 54-31.01 (AACC International, 2010) was used to determine SKCS values, utilizing the Perten SKCS 4100 instrument. It is used to differentiate wheat cultivars and provide insights into the mechanical properties of grain. The SKCS instrument analyses 300 individual kernels, providing information on the uniformity of the grain sample. This information is valuable for predicting milling performance (Osborne and Anderssen, 2003). Results from the SKCS revealed that the majority of the kernels in each of the samples are large sized, with a higher proportion of large-sized kernels in the Georgian samples compared to the Russian samples. The Russian samples contained a greater proportion of medium-sized kernels than Georgian samples. The percentage of small-sized kernels was minimal in both Georgian and Russian samples. For the Georgia samples, the average HI score was 42.6, ranging from 21.4 (G2) to 58.2 (G3). The Russian samples had a higher average HI score of 57.1, with values ranging from 50 (R1) to 61.8 (R3). The weight and diameter of the kernels were generally similar across all samples, except for the G2 sample. Excluding G2, the average kernel weight was 34.2 mg and the average diameter was 2.7 mm. G2 sample had a higher weight (42.2 mg) and a larger diameter (3.04 mm). Only two of the six samples — R2 and R3 — are classified as being hard wheat. Half of the samples — G1, G3 and R1 — are classified as mixed class based on the quantity of soft and semi-soft berries present in the sample. The G2 sample consisted mostly of soft wheat kernels and is classified as a soft wheat. Soft wheat typically has weaker gluten, which corresponds with the lower sedimentation value indicating weak gluten strength. When milled, G2 exhibited characteristics similar to soft wheat milling, including increased break flour production, sticky flour, and bran with more starch remaining after milling. Samples R2 and G3 are comparable to the five-year U.S. average, with a few exceptions. R2 had high dockage and G3 contained a softer proportion of wheat kernels. Both R2 and G3 had poor sedimentations values, ranking the lowest among the six samples. Given their low sedimentation values compared to the five-year U.S. average, R2 and G3 are expected to have weak gluten strength.
A3. Wheat flour quality data
Table A3 summarizes the wheat flour testing for the Georgian and Russian samples. All six flour samples were analyzed by a series of methods, which included ash, protein, wet gluten, damaged starch content, falling number, color, and solvent retention capacity (SRC). None of the six flour samples flour were fortified.
Wheat flour data from Georgian and Russian samples
Citation: International Food and Agribusiness Management Review 29, 1 (2026) ; 10.22434/ifamr.1208
Laboratory flour milling can indicate milling properties and performance to an extent, but it is not consistently reliable and does not translate to a commercial mill extraction rate. The primary purpose of laboratory milling is to produce flour for additional laboratory analyses. All of the samples are cleaned and tempered according to AACCI Approved Method 26-10.02 (AACC International, 2010) and were milled using a tandem Bühler mill. The laboratory mill extraction is the percentage of flour obtained from the sample of wheat milled. This extraction rate is almost always lower than that achieved in commercial mills, so it is more of an indicator and not heavily relied upon to reflect actually mill extraction expectations. All three of the Georgian samples and Russian sample R1 had lower lab extraction rates than expected from a HRW wheat. The other two Russian samples — R2 and R3 — had better lab extraction rates, but were still lower then desired for HRW past crop quality data results.
The average falling number for the three Georgian flour samples was 429 s, ranging from 375 to 477 s. The average falling number for the Russian flour samples was 421.3 s, varying from 225 to 628 s. Russian sample R3 with the low falling number of 225 s exhibited high amounts of enzyme activity. The flour falling number was determined using AACCI Approved Method 56-81.04 (AACC International, 2010) in conjunction with the 2019 USDA/FGIS barometric pressure correction modification.
The amylograph test measures the gelatinization and pasting characteristics of wheat flour starch, which is important for baking performance, especially in products like bread, noodles, and batters. The acceptable amylograph peak viscosity values depend on the type of wheat flour and its intended use. Flour with high enzyme activity — sprouted wheat flour — have lower peak viscosity compared to flour with acceptable levels of enzyme activity. Flour with high enzyme activity produces sticky dough that can cause problems in processing and results in products with poor color and weak texture. Typical acceptable bread flour values are greater than 500 Brabender units (BU), with higher values indicating better water absorption and fermentation tolerance. The average peak viscosity for the Georgian sample was 638.7 BU with a range of 411.0 BU to 861.0 BU. The average peak viscosity for the Russian samples was 527.0 BU with a range of 124.0 BU to 1087.0 BU.
Flour color often affects the color of the finished product and is therefore one of many flour specifications required by end-users. Generally speaking, bright white color flour is more desirable for many products. It is important to note that there are several methods to measure flour color that all give different results. Due to this, flour color results cannot be compared or standardized unless every mill and bakery use the same instrument. The Minolta Chroma Meter is a modern instrument recommended for measuring color using several color scales or dimensions. Flour color results are reported in terms of 3-dimensional color values based on L* value, a* value and b*value, which is currently the most commonly used scale. A typical white flour has the color values of L*=+92.5 whiteness, a*=–2.4 green color, and b*=+6.9 yellow color (International Grains Program, n.d.).
For the Georgian samples, the average L*value was 90.6 (range 89.1–92.4), a* was –1.5 (range –1.7 to –1.1) and b* was 9.6 (range 6.6–11.3). For the Russian samples, the average L*value was 90.7 (range 90.2–90.8), a* was –1.7 (range –1.8 to –1.6) and b* was 11.4 (range 10.9–12.0). Georgian sample G2 with the highest L*value (92.4) had very good color and brightness. The color for the Georgian sample G1 with the lowest L*value (89.1) had a slightly darker color than desired. Russian sample R1 had a slightly darker color than desired as well (L*=90.8, a*=–1.8, and b*=11.4).
Wet gluten content of wheat reflects the gluten forming protein content in flour. The wet gluten test provides information on the quantity of gluten in wheat and flour (AACCI Approved Method 38-12.02 (AACC International, 2010). Gluten is the functional component of protein and is responsible for the elasticity and extensibility characteristic of flour dough. For high protein wheat, the wet gluten content is 35% on a 14% moisture basis, and it is 23% for low protein wheat. The average wet gluten content for the Georgian samples was 29.8% with a range of 28.7% to 31.6% and the average of the Russian samples was 30.8% with a range of 30.2% to 31.4%. These percentages for the wet gluten content indicate these samples were higher protein content wheats, but do not indicate the necessary gluten quality and strength.
Protein content in flour in the Georgian samples varied between 10.4 and 11.0% on a 14% mb and in the Russian samples varied between 11.3 to 11.7%. All of the flour samples had protein content and wet gluten content within baseline expectations for HRW except for one Georgian sample (G2). Georgian sample G2 had a slightly lower protein content than baseline (10.4%) but had an acceptable wet gluten content (29.2%). The flour protein content was measured using AACCI Approved Method 39-10.01 (AACC International, 2010) and the Near-Infrared Reflectance (NIR) method.
The ash content of standard bread flour usually varies between 0.5 and 0.57% on a 14% mb. Ash is mainly concentrated in the bran, and can be a measure of the grade or type of flour (AACCI Approved Method 08-01.01) (AACC International, 2010). As the ash content increases, the level of non-endosperm material in the flour increases, which is known to decrease the flour’s baking quality. Since the ash content can result in a darker color for the finished product, low ash content is preferred for white or bright-colored baked goods. Millers and bakers usually consider both the ash content and flour color when evaluating flour quality. The average ash content for the three Georgian samples was 0.53% on a 14% mb, with a range of 0.49–0.55%. The average for the Russian samples was 0.49% with a range of 0.47–0.52%. All of the Georgian flour samples and Russian sample R2 can be appropriate for high grade bread.
Damaged starch is the percentage by weight of damaged starch in a flour sample. It is a measure of the physical damage done to starch granules during milling. Hard wheat flour typically has higher starch damage than soft wheat flour. Damaged starch granules readily absorb more water, which affects dough mixing and other processing properties. Because starch damage depends on how the sample was milled, this factor is important for interpreting other reported results. The highest level of damaged starch was obtained in Russian sample R2 (6.2%) and the lowest damaged starch was reported in the Georgian sample G1 with 5.5%. The Georgian samples had an average of 5.7% damaged starch and the Russian samples had a slightly higher average of 6.0%. The level of damaged starch was measured using AACCI Approved Method 76-30.02 (AACC International, 2010) and enzymatic hydrolysis.
The solvent retention capacity (SRC) test provides insights into the flour quality and its functionality profile (AACCI Approved Method 56-11.02) (AACC International, 2010). The test examines the ability of gluten proteins, damaged starch, and pentosans to retain specific solvents (water SRC, 50% sucrose SRC, 5% sodium carbonate SRC, and 5% lactic acid SRC). The combined pattern of the four SRC values creates a practical flour quality profile that is useful for evaluating end product suitability, predicting functionality, and determining how well flour products conform to performance specifications (U.S. Wheat Associates, 2022). According to recommendations from the U.S. Wheat Associates (2021), the ideal SRC ranges for pan bread flour are 65–70% for water SRC, 105–115% for sucrose SRC, 80–90% for sodium carbonate SRC, and greater than 140% for lactic acid SRC. For high-gluten strength products such as pan breads, a higher lactic acid SRC is particularly important, as it reflects the flour’s ability to form a viscoelastic dough structure capable of retaining leavening gases. This characteristic supports the production of light, airy baked products with good volume retention (U.S. Wheat Associates, 2022). For pan bread, an ideal profile includes both a relatively high sucrose SRC and an even higher lactic acid SRC.
The average water SRC for Georgian samples was 66.7% of flour weight on a 14% moisture basis, compared to the average of the Russian samples of 70.0%. The average 50% sucrose SRC for Georgian samples was 122% on a 14% mb, compared to the average of the Russian samples of 120%. The average 5% lactic acid SRC for Georgian samples was 132% on a 14% mb, compared to the average of the Russian samples of 135.7%. The average 5% sodium carbonate SRC for Georgian samples was 88.3% on a 14% mb, compared to the average of the Russian samples of 91.3%. For pan bread flour, the recommended maximum value of sodium carbonate SRC is 88% (U.S. Wheat Associates, 2021). If damaged starch exceeds this threshold of sodium carbonate SRC greater than 90%, bread staling may accelerate, reducing shelf life (U.S. Wheat Associates, 2021). The SRC results for Russian sample R3 fall within the baseline expectation for HRW, while the results for Georgian sample G1 predict the flour is suitable for pan bread. Georgian sample G3 lactic acid SRC indicates weaker gluten.
The Gluten Performance Index (GPI) is lactic acid SCR divided by the sum of sucrose SRC and sodium carbonate SRC. GPI is a strong predictor of overall flour performance in baking applications and is highly correlated with bread volume. The optimum GPI threshold for pan bread is a minimum of 0.75, with values above 0.65 considered preferred and 0.60 regarded as the minimum acceptable value (U.S. Wheat Associates, 2021; 2024). Three samples — G1, R1, and R3 — met or exceeded the 0.65 threshold, indicating strong baking performance. The other three samples — R2, G2 and G3 — had relatively poor GPI values and weaker baking potential.
A4. Dough properties
Table A4 provides an overview of the dough properties of the Georgian and Russian samples. Dough rheology tests are used to evaluate the properties of the dough. These tests measure the dough’s physical properties and behavior during processes like mixing, fermentation, and baking and include the following empirical tests: Farinograph, Extensograph and Alveograph tests.
Dough properties of Georgian and Russian samples
Citation: International Food and Agribusiness Management Review 29, 1 (2026) ; 10.22434/ifamr.1208
The Farinograph measures flour water absorption and dough strength by measuring the resistance of a dough to mixing with paddles. Farinograph test results are used to predict processing effects such as tolerance to over-mixing and dough consistency. This test was conducted using AACCI Approved Method 54-21.02 (AACC International, 2010) and constant flour weight procedure. These results predict the texture characteristics of the finished product. The generated Farinograph curve has three main indicators: absorption, peak time, and stability time. Absorption refers to the amount of water required for optimal flour processing into end products. Peak time indicates dough development time, and stability time indicates the time the dough is at maximum consistency and serves as good indicator of dough strength. Flour with weak gluten has lower water absorption and shorter stability time compared to flour with strong gluten. Ideal target values for HRW dough quality is a water absorption of 58% or higher on a 14% mb, a peak time ranging from 4.0 and 8.0 min, and a stability range of 8.0–14.0 min. The average peak time for the Georgian samples was 3.8 min, with an average stability time of 5.7 min. The average absorption was 58.9%. For the Russian samples, the average peak time was 4.8 min, and the average stability time was 8.7 min. The average absorption was 58.6%, which is similar to that of the Georgian samples. Georgian samples G1 and G2 showed low peak times and short stability indicating a weaker gluten. The stability time for Russian sample R3 and Georgian sample G3 is shorter than expected, also indication of a slightly weaker gluten.
The Alveograph test measures dough strength by determining the force required to inflate and break a bubble of dough (AACCI Approved Method 54-10.01 at modified 45 and 135 min rest) (AACC International, 2010). It provides test results for common specifications such as tenacity, extensibility, elasticity and baking strength, factors that flour millers and processors use to ensure consistency in their process and products. The alveograph is well-suited for measuring the dough characteristics of weaker gluten wheat and with adapted hydration using a consistograph, for stronger wheats including durum. The generated Alveograph curve reports three main values: resistance (P) representing dough resistance to extension, length (L) representing dough extensibility, and W (the area under the curve) representing dough strength. Flour characteristics such as strength of gluten (P value) and extensibility (L value) determine its suitability for different end uses. Weak gluten flour has lower P values than strong gluten flour. Flour with low P values (indicating weak gluten) and short L value (low extensibility) are preferred for cakes and other confectionery products. Strong gluten flour preferred for pan bread has high W values and P/L ratio close to 1. For better bread making potential, flour should have a W value greater than 250 joules (J) and a P/L ratio of less than 0.8. For the Georgian samples, the average P value was 82.7 mm, the average L value was 76.3 mm, the average P/L ratio was 1.3, and the average W value was179.0 J. For the Russian samples, the average P value was 92.3 mm, the average L value was 83.3 mm, the average P/L ratio was 1.2, and the average W value was 258.7 J. Based on the W values and P/L ratios, Russian flour is better suited for bread-making than Georgian flour. For the Georgian sample G1, similar to the results of the Farinograph results, the lower P and W values suggest a weak gluten flour.
Extensograph measures dough extensibility and resistance to extension. This dough testing was conducted using AACCI Approved Method 54-30.02 (AACC International, 2010). The generated Extensograph curve represents a force-time curve for a piece of dough that is unilaterally stretched until it breaks. Dough resistance, extensibility, and area are measured and help describe the gluten strength and dough extensibility characteristics of flour. The dough from Georgian sample G1 had good extensibility but little strength. The high extensibility values for Georgian sample G2 along with its acceptable L values, indicate weak gluten flour with lots of extensibility. Georgian sample G3 had low extensibility properties. Russian sample R3 had less than desired resistance, which may be a result of the high amylase activity present.
The Farinograph, Alveograph and Extensograph curves indicate weak gluten for samples G1, G3 and R3. In particular, the weak curves show weakness in extensibility for G3. The weak curves for R3 may be attributed to sprout damage in the wheat. Sample R1 exhibits acceptable Farinograph, Alveograph and Extensograph curves, which may be attributed to its adequate protein content.
A5. Baking evaluation
Baking evaluation tests are the final tests in assessing wheat quality. Standardized tests determine the suitability of the flour for baking specific end products. In this study, flour was used to baked three end products: pan bread, noodles and steamed bread. Although the primary focus is on bread (Table A5), results from the baking evaluation for noodles and steamed bread are included in Table A6.
Bread baking evaluation of Georgian and Russian samples
Citation: International Food and Agribusiness Management Review 29, 1 (2026) ; 10.22434/ifamr.1208
End-products properties of Georgian and Russian samples
Citation: International Food and Agribusiness Management Review 29, 1 (2026) ; 10.22434/ifamr.1208
The bake test is used to assess the performance of flour during baking and the overall quality of both the flour and end product. Pan bread is evaluated based on its processing characteristics, external and internal characteristic, including loaf volume, crumb color, and aroma, and texture. During processing, pan bread dough is assessed for strength, extensibility, and stickiness. The final baked pan bread is weighed (grams) and measured for volume (cubic centimeters). This bake test followed the “pup loaf” method according to AACCI Approved Method 10-10.03 (AACC International, 2010). In commercial baking, consistent flour performance is essential, as consumers expect a product that consistently meets their standards for volume, color and texture. For pan bread, a texture measurement between 250 and 300 g is considered borderline hard, and a value above 300 g is classified as hard. Baking absorption refers to the amount of water required for optimum dough mixing to achieve the proper consistency for bread baking. It is measured as a percent of flour weight on 14% mb. Loaf volume represents the overall size of the baked bread, with larger loaf volumes generally indicating better baking performance and consumer preference. It is measured using the rapeseed displacement method. Specific volume, defined as the ratio of loaf volume to loaf weight, provides an indication of bread’s lightness and aeration.
Among the six tested samples, R3 was the only sample to perform fairly well across the range of end-products (pan bread, noodles, and steamed bread). However, R3 exhibited only fair volume and slightly hard texture in pan breads. Ideally, pan breads have a chewy texture (International Grains Program, n.d.). Samples G1 and R1 performed fair to poor performance across the end-product range. Both G1 and R1 had fair volume. G1 had borderline hard texture in pan breads and R1 had hard texture in pan breads. G1 had one of the darkest flour L* values, which resulted in darker end-product color. Samples G2, G3 and R2 performed poorly across the range of end products. All three samples had small volume in pan breads. The slightly low protein in G2 is likely a primary contributing factor. G3 and R2 had hard texture in pan breads.
Corresponding author

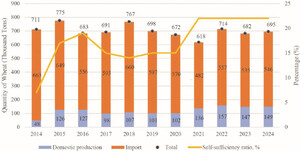
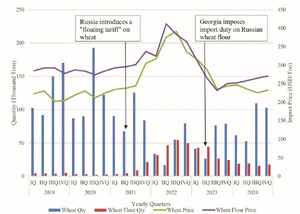
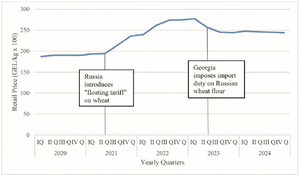

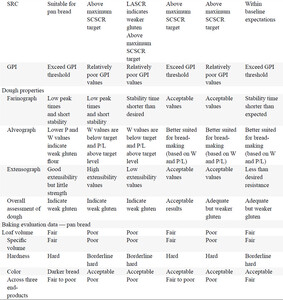

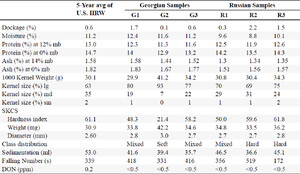
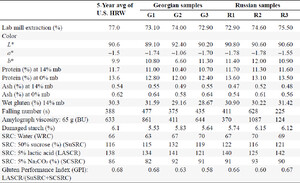
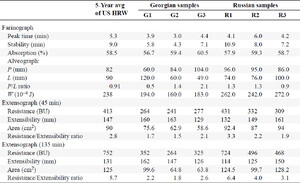
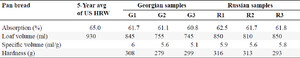

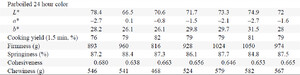

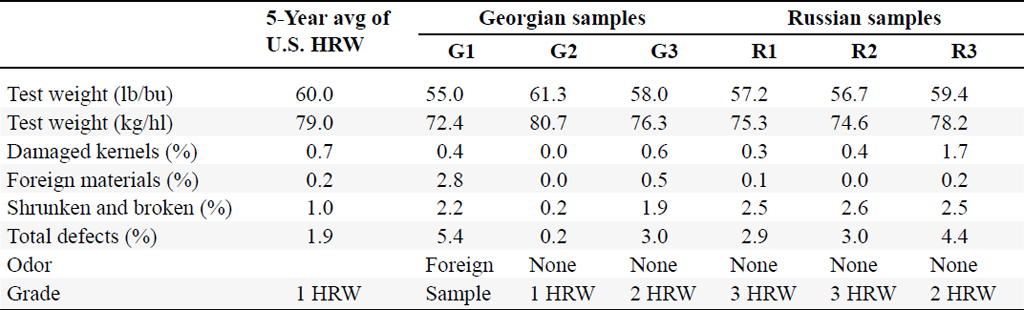
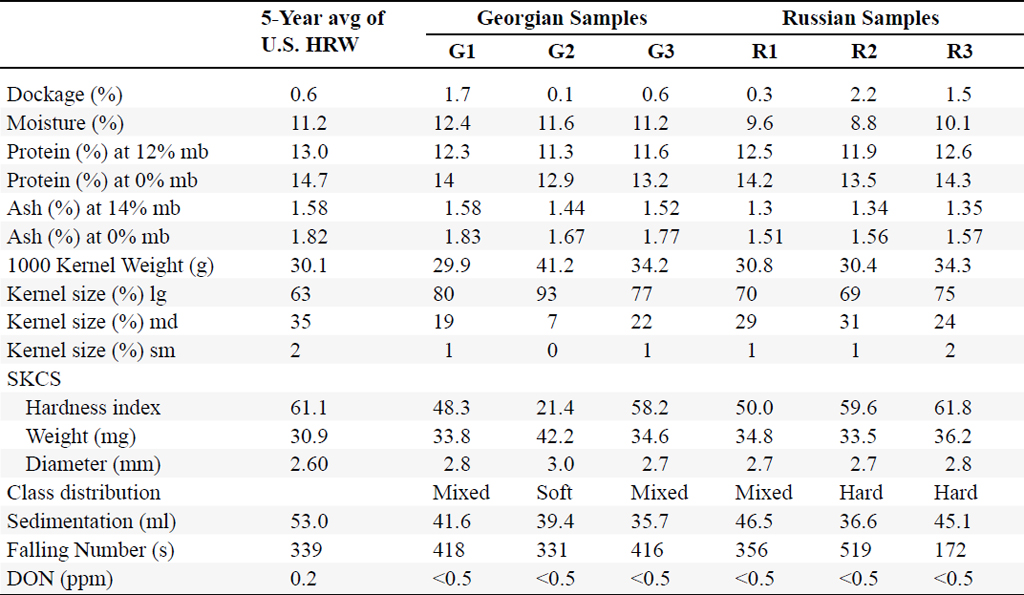
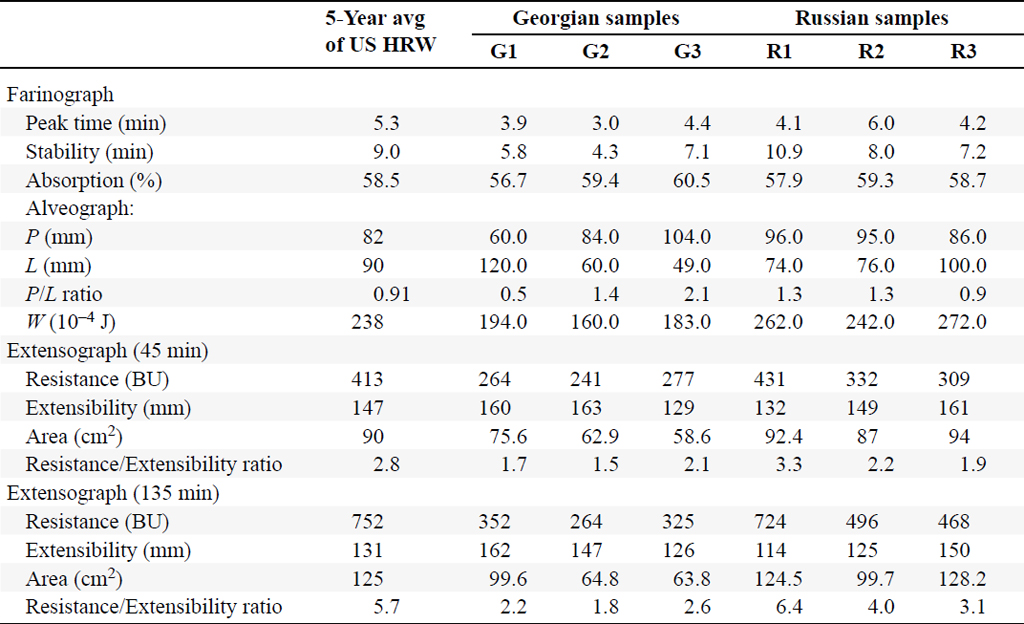
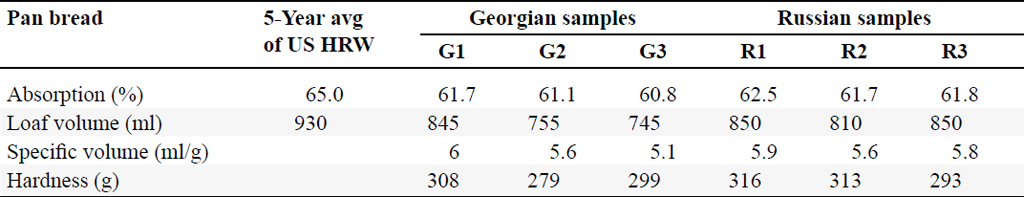
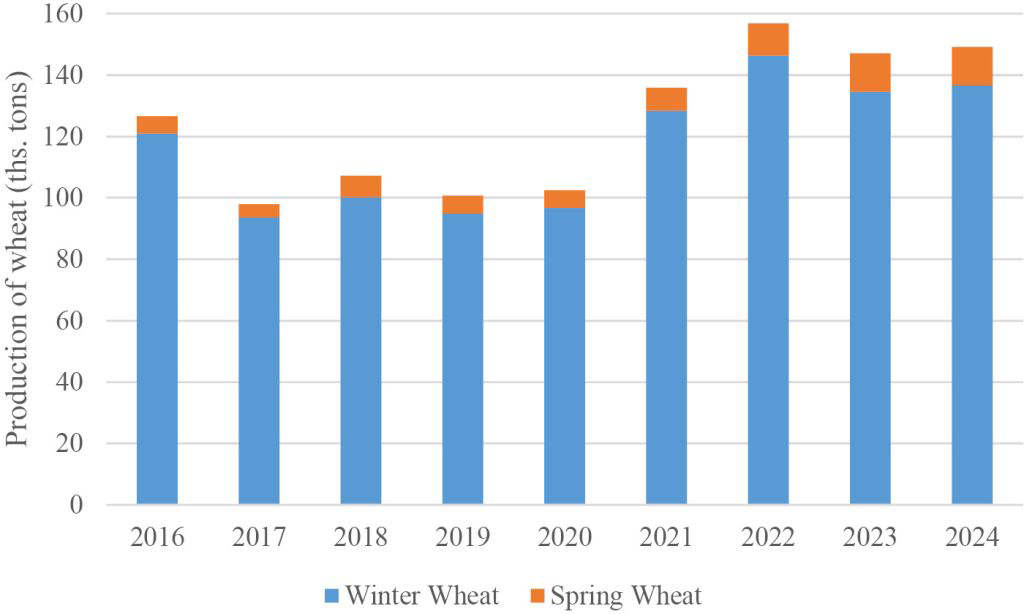
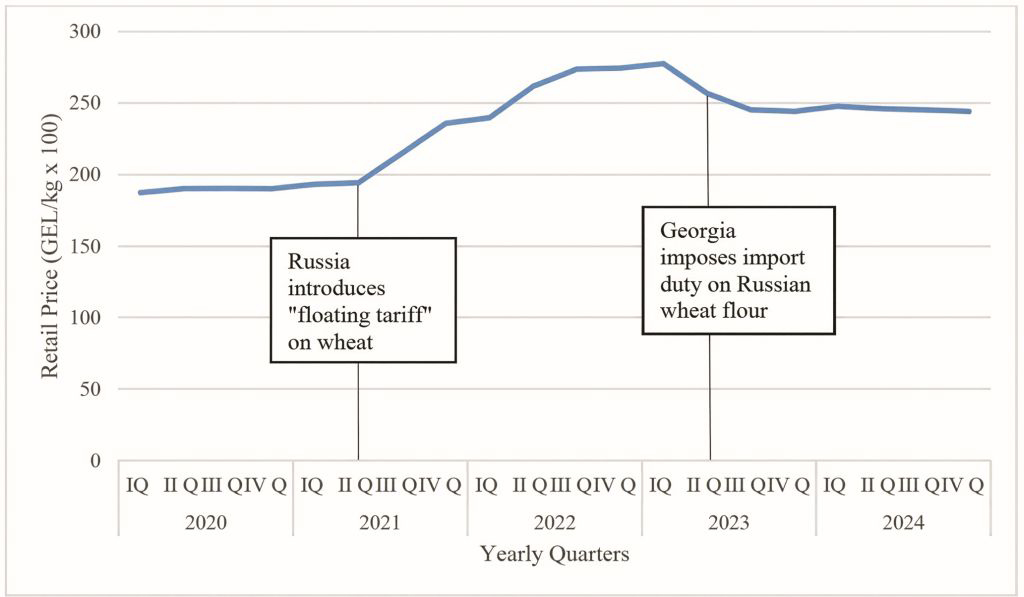