Abstract
How to effectively predict the risk of large-scale poverty-returning and realize prior targeted intervention are essential measures to prevent large-scale poverty-returning. In view of this, based on the Sustainable Livelihoods Framework, this paper employs machine learning algorithms to study the prediction and pattern recognition of large-scale poverty-returning risks using the China Family Panel Studies (CFPS) and satellite remote sensing data. Our findings demonstrate a remarkable prediction accuracy rate of 91.23% for large-scale poverty-returning, employing the random forest algorithm. Notably, key contributing variables to this prediction encompass education, health, and government subsidies, highlighting the potential of supervised learning methods in predicting large-scale poverty-returning risk. Furthermore, the K-means clustering analysis reveals three discernible risk patterns within large-scale poverty-returning, including low-risk, three-risk, and five-risk patterns. The findings could provide scientific empirical evidence for the governance of different types of large-scale poverty-returning risks.
1. Introduction
While China has effectively eradicated absolute poverty, the persisting vulnerability among the population that has been lifted out of poverty underscores the risk of large-scale poverty-returning. The external environment plays a significant role in this context, as the uncertainties surrounding the macroeconomic landscape negatively impact the employment opportunities of those lifted out of poverty, thereby hindering the sustained growth of their income. Concurrently, unpredictable shocks such as sudden diseases, natural disasters, and climate change act as crucial determinants leading to the occurrence of poverty-returning (Asfaw et al., 2015; Gong and Zhang, 2007; Li et al., 2022). Internally, the lack of endogenous development capacity emerges as a primary factor contributing to the risk of large-scale poverty-returning (Morduch, 1994; Ward, 2016). This is evident in the scenario where individuals lifted out of poverty, deprived of external economic support, return to poverty due to an insufficient capacity for wealth production (Li et al., 2022). Some studies have substantiated that cessation of financial and technical assistance to individuals lifted out of poverty results in the occurrence of poverty-returning, especially among those who have long relied on government support (Xu and Ludovico, 2017). To prevent poverty-returning, the Chinese Government has implemented a precise and targeted assistance policy, dispatching cadres to poor villages and households for âone-to-oneâ or âone-to-manyâ pairing assistance. Support measures are provided in areas such as industry, employment, education, and healthcare, tailored to the actual needs of different poor households. This approach not only helps poor households enhance their development capacity but also strengthens their ability to withstand risks, ensuring the long-term consolidation of poverty eradication outcomes and preventing poverty-returning (Deng et al., 2022; Guo et al., 2022; Li et al., 2022; Liu et al., 2018). However, a significant number of population remain at risk of falling back into poverty. According to survey data from the Poverty Alleviation Office of the State Council of China, nearly two million individuals lifted out of poverty are at risk of poverty-returning. Therefore, it is imperative to better understand the risk of large-scale poverty-returning.
Theoretical research and empirical evidence concur that prior intervention serves as an effective strategy in preventing large-scale poverty-returning. Successful anticipation of widespread poverty-returning risk constitutes a prerequisite for implementing pre-emptive interventions. Firstly, the accurate prediction of the risk of large-scale poverty-returning is a prerequisite for the realization of ex-ante intervention. Meanwhile, it is imperative to recognize that the characteristics of the risk of large-scale poverty-returning vary across regions, making a âone-size-fits-allâ policy ineffective. This underscores the necessity for precise identification of the specific type of risk associated with large-scale poverty-returning. Practically, some poverty-stricken regions have initiated monitoring and early warning systems for poverty-returning. However, these efforts predominantly rely on manual investigations and identifications conducted at the three-tier organizational levels of âvillage-village-county.â Such methodologies fall short in facilitating prior intervention against the risk of large-scale poverty-returning. Consequently, there is an urgent need for accurate prediction and pattern recognition of the risk of large-scale poverty-returning.
Numerous studies have addressed the critical issue of poverty-returning, emphasizing the urgency and necessity of managing this phenomenon. A consensus has emerged within the existing literature, asserting that Chinaâs rural poverty governance strategy post-2020 demands a transition from the traditional âpoverty alleviation strategyâ to a novel âpoverty prevention-orientedâ strategic framework. However, the discussion on monitoring and early warning systems for the risk of large-scale poverty-returning remains relatively superficial. Although some studies have introduced the basic idea of a large-scale early-warning mechanism for poverty-returning from a macro-strategic perspective, they typically remain at the policy level, focusing on system concepts and strategic planning, while lacking specific empirical analysis and in-depth exploration of the mechanisms influencing poverty-returning risk. In terms of large-scale poverty-returning risk monitoring and early-warning, there is a lack of systematic indicator systems and quantitative assessment methods, hindering the development of an operational monitoring and early-warning program. Regarding quantitative analysis, most literature evaluates the risk of poverty-returning for individuals who have escaped poverty using traditional statistical methods, which fail to capture the complexity and diversity of large-scale poverty-returning risk. These studies often assess poverty-returning risks from a single dimension, overlooking the impact of collective factors like the natural environment and social networks on large-scale poverty-returning (Xu et al., 2024; Zhang et al., 2022a,b; Zhou et al., 2024) Furthermore, existing studies have not fully leveraged the advantages of machine learning in predicting and identifying large-scale poverty-returning risks. It is crucial to recognize that large-scale poverty-returning differs significantly from individual poverty reduction, given its potential for poverty-returning scale and intensity, which could result in pronounced social and economic risks. Consequently, existing research findings grounded in individual poverty-returning may struggle to effectively inform policy formulation aimed at preventing the risk of large-scale poverty-returning. Further exploration and integration of machine learning methodologies could offer more specified insights into the complex dynamics associated with large-scale poverty-returning, ultimately enhancing the policy relevance.
In view of this, this paper aims to employ machine learning algorithms to analyze the prediction and pattern recognition of the large-scale poverty-returning risks based on the China Family Panel Studies (CFPS) and satellite remote sensing data. Machine learning has shown considerable strengths in both prediction and classification tasks. Specifically, supervised learning algorithms can automatically identify and select the most influential features affecting large-scale poverty-returning. Meanwhile, unsupervised learning algorithms, such as K-means clustering, do not require predefined category labels. They categorize data based on intrinsic characteristics. Consequently, machine learning offers greater accuracy in predicting and identifying large-scale poverty risks compared to traditional methods. Specifically, adopting the Sustainable Livelihood Framework, the paper constructs an indicator system encompassing five dimensions â human capital, physical capital, financial capital, natural capital, and social capital â to predict the risk of large-scale poverty-returning. This paper first applies the random forest algorithm as part of the supervised learning algorithm to predict the risk of large-scale poverty-returning. Subsequently, the study utilizes the K-means clustering algorithm within the unsupervised learning algorithm to identify discernible patterns associated with large-scale poverty-returning. This comprehensive approach seeks to integrate both predictive modeling and pattern recognition, offering a more specified understanding of large-scale poverty-returning risk.
Compared to existing literature, this paper contributes to the field in three aspects. Firstly, prevalent empirical studies predominantly adopt a micro-individual perspective to analyze the poverty-returning of individual rural households, largely neglecting the distinct characteristics associated with the risk of large-scale poverty-returning (Chen et al., 2016; Ward, 2016). This paper marks a notable departure by examining risk prediction and pattern recognition of large-scale poverty-returning risks at the village level, thereby offering a crucial supplement to the existing literature.
Secondly, prevailing predictions of the risk of large-scale poverty-returning frequently remain confined to theoretical and policy-level discussions, lacking empirical evidence (Di and Wang, 2019). In contrast, this paper integrates data from the China Family Panel Studies (CFPS) and satellite remote sensing, utilizing supervised machine learning algorithms to predict the risk of returning to poverty at scale. This approach not only offers empirical insights but also identifies crucial predictive variables. Consequently, this empirical foundation contributes valuable information for enhancing the monitoring and early-warning system for large-scale poverty-returning.
Thirdly, existing classifications of large-scale poverty-returning risk types often rely on subjective judgments, limiting the comprehensive and objective revelation of the various types of large-scale poverty-returning risks (Liu et al., 2024). In contrast, unsupervised learning algorithms, introduced in this paper for identifying types of large-scale poverty-returning risks, can comprehensively capture intrinsic features of data and determine classifications based on feature similarity. This inclusion helps address the shortcomings of existing research methodologies, offering a more comprehensive and objective understanding of the types of large-scale poverty-returning risks.
The next part of this paper is organized as follows: the second part focuses on the literature review; the third part introduces the data, variable definitions, and machine learning algorithms; the fourth part applies the random forest algorithm to predict the risk of large-scale poverty-returning; the fifth part explores the types of large-scale poverty-returning risk based on K-means clustering algorithm; and lastly, the conclusions and policy implications are drawn from the paperâs findings.
2. Literature review
This paper aims to use machine learning algorithms to study the prediction and pattern recognition of large-scale poverty-returning, and there are three main strands of related literature.
In the first category of literature, based on poverty vulnerability theory and sustainable development theory, most studies use econometric approaches to analyze the inducing factors of poverty-returning. For example, Fan et al. (2023) explore the effects of various livelihood capitals, such as labor and land, on the risk of poverty-returning based on the perspective of poverty vulnerability theory. The results of Pan et al. (2022), based on the analytical framework of the vulnerability analysis, indicate that the economic dimension has a more significant effect on poverty-returning. Overall, the factors leading to poverty-returning are multifaceted, which can be divided into internal and external poverty-returning risks. Specifically, external risk shocks mainly include natural disaster risks such as climate change (Benali et al., 2018; Guo et al., 2023; Li et al., 2022; Xu and Yang, 2022), market risks caused by changes in supply and demand in the agricultural market as well as fluctuations in commodity prices (Komarek et al., 2020; Tothova, 2011), the social risk from factors such as employability and environmental integration, policy withdrawal, and policy risk from program failure (Adrian et al., 2019; Demissie and Kasie, 2017). Internal risks, on the other hand, are mainly derived from internal factors such as individualsâ education, health, natural resource endowment of the region in which they are located, and the economic situation of the family (Gloede et al., 2015; Mina and Imai, 2017; Wang et al., 2022).
Based on the identification of risk factors for poverty-returning, some studies have attempted to assess the level of risk of poverty-returning. Binary logistic regression analysis is the most commonly used method for constructing the predictive model of poverty-returning risk. For example, He et al. (2022) used a logistic regression model to assess the risk of poverty-returning of rural households in ecologically fragile areas. Similarly, Li et al. (2023) evaluate the risk of poverty-returning of farmers who escaped from poverty with the help of resilience indicators, using the micro-panel data from two periods of the China Household Finance Survey. Besides, some literature applies machine learning to explore the risk of poverty-returning, such as Zhang et al. (2022a,b) using BP neural network to explore the excessive subjectivity in the identification of poor households and the risk of poverty-returning, and Wang (2023) using an artificial neural network to assess the dynamic evolution law and main influencing factors of the multidimensional poverty-returning index. More relevant to this paper is the study of Onsay and Jomar (2024), which utilized machine learning regression and classification algorithms to measure multidimensional poverty in the poorest regions of the Philippines, proving that poverty is affected by multidimensional factors and, on the other hand, the study verified the feasibility of machine learning for poverty prediction.
The third strand of the literature focuses on establishing a monitoring and early warning mechanism for the risk of poverty-returning from the policy perspective. In terms of preventing poverty-returning, Du and Rong (2023) construct an early warning and evaluation system for poverty-returning and make recommendations based on the results of the early warning and evaluation to reduce the risk of poverty-returning. First of all, the establishment of a sound market-oriented employment assistance system is considered to be the key policy to prevent households from relapsing to poverty. At the same time, the full use of external resources and the empowerment of advanced information technology can realize the endogenous development of poverty-stricken households, thus avoiding the poverty-returning.
Existing literature has provided an insightful theoretical perspective for this paper, but further exploration is needed. First of all, the existing research pays more attention to evaluating and analyzing the risk of poverty-returning, reflecting a kind of ex-post analysis, which is difficult to carry out effective ex-ante intervention. Thus, there is an urgent need to explore the prediction of the risk of large-scale poverty-returning from the perspective of ex-ante analysis. Secondly, most of the analysis in the literature mainly stays at the micro level and has not yet fully considered the differences between the large-scale poverty-returning at the regional level and the micro-individualsâ return to poverty. Consequently, the research conclusions may not be able to effectively serve the policy formulation of preventing large-scale poverty-returning. Finally, methodologically, the existing prediction and pattern recognition of the risk of large-scale poverty-returning mainly relies on traditional econometric analysis for parameter estimation, while the potential of machine learning algorithms has not yet been fully paid attention to. In contrast, machine learning algorithms have the unique advantages of high efficiency, dynamics and precision in risk early warning and pattern recognition, and do not rely on any preset model assumptions, which could well serve the technical needs of this study. In view of this, this paper takes a new perspective, using machine learning algorithms to study the prediction and pattern recognition of large-scale poverty-returning.
3. Variables, data and models
3.1 Description of variables
The key variables involved in the machine learning algorithm are as follows:
3.1.1 Output variables
The output variable is the risk of large-scale poverty-returning. Specifically, large-scale poverty-returning refers to the phenomenon that a large number of the population relapse into poverty in a given region. Thus, it can be concluded that the root of large-scale poverty-returning is individual poverty, but it is characterized by regional and group characteristics. Therefore, this paper first defines the identification criteria of individual poverty. Existing mainstream research mainly considers income or consumption as the identification criteria of individual poverty-returning (Xu et al., 2022, 2023). Considering that âtwo no worries, three guaranteesâ and income standard are the basic criteria for recognizing the poverty-returning in the practices of local governments, combined with the availability of data indicators, we take the income standard, education security, and medical security as the criteria for identifying individuals poverty-returning.
The poverty-returning is a dynamic phenomenon, that is, a relapse from a state of non-poverty to poverty. In some studies, the stages of poverty-returning have been defined as the three stages of âpoverty â out of poverty â returning to povertyâ from a narrow perspective. In this paper, we focus on the phenomenon of poverty-returning in a broader sense, that is, ânon-poor â returning to povertyâ, a measure that comprehensively covers the population returning to poverty and is more in line with the objectives of current policy implementation in China. Therefore, we use the tracking samples from the 2018 and 2020 periods of the China Family Panel Studies (CFPS) data for identification. Specifically, a household is defined as being in poverty when its per capita income level is below the national poverty line, when a child of school age drops out of school, or when the household has difficulty affording medical expenses. Individuals are identified as poverty-returning if they were non-poor in 2018 but fell into poverty in 2020.
As mentioned above, large-scale poverty-returning emphasizes more on regionality. Therefore, this paper defines the risk of large-scale poverty-returning at the village level. Based on the identification of individual return to poverty, we further calculate the poverty-returning rate at the village level, that is, the ratio of the number of rural households experiencing poverty-returning to the total number of households in the same village. When the poverty-returning rate of a village is higher than the average, the village could be defined as having a high large-scale poverty-returning risk and assigned a value of 1, and vice versa.
3.1.2 Input variables
The input variables are the risk factors of large-scale poverty-returning. Particularly, we determine the indicators based on the Sustainable Livelihoods Framework (SLF). Specifically, livelihood capital is the core of SLF, which contains five types of capital: human capital, physical capital, financial capital, natural capital, and social capital, which are the abilities and resources that individuals need to make a sustainable living. That is, the poverty-returning is due to the inability of the population to utilize the relevant resources to maintain sustainable development (Chen et al., 2017). Therefore, the risk of poverty-returning may come from five aspects: the risk of human capital, the risk of physical capital, the risk of financial capital, the risk of natural capital, and the risk of social capital.
In summary, based on the SLF, the input variables contain five dimensions of capital: human capital, physical capital, financial capital, natural capital, and social capital. The relevant variables involved are as follows:
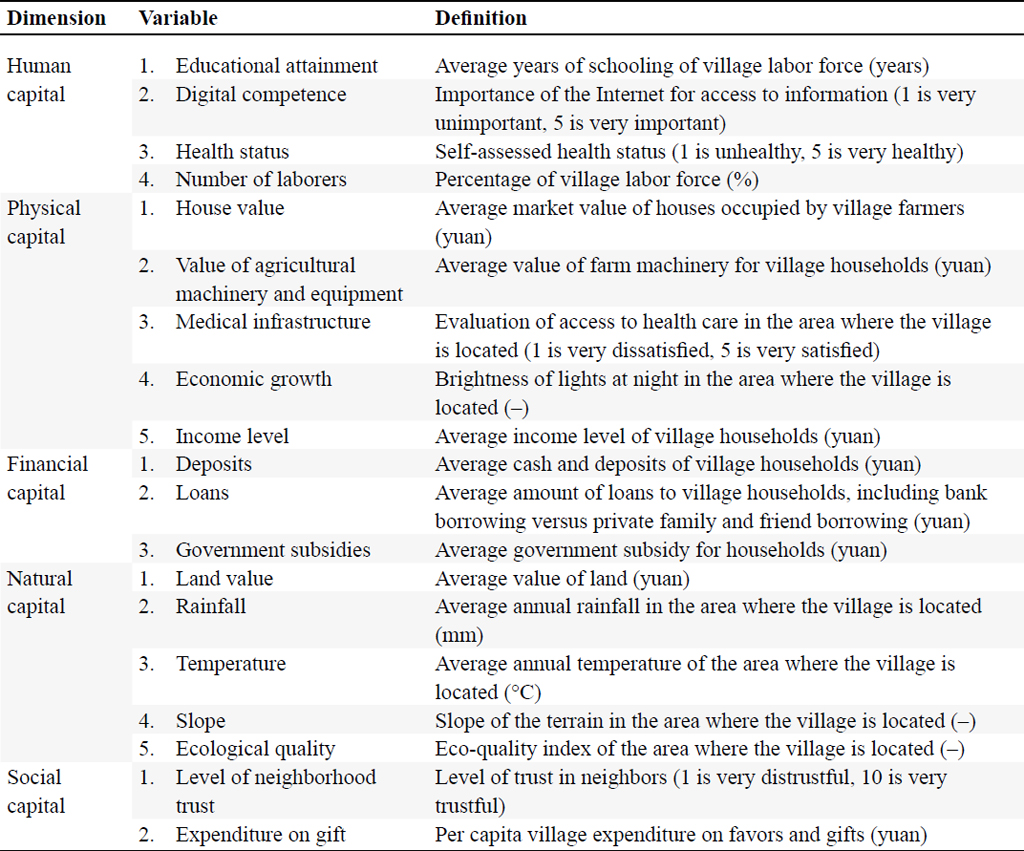
Human capital consists of mental and physical human capital. Precisely, mental human capital is measured by the level of education and digital ability of the village; physical human capital is measured by the health status of village farmers and the proportion of the labor force. Physical capital mainly includes the value of village houses, the value of agricultural machinery and equipment, medical infrastructure, economic growth, and the income level of village farmers. Economic growth is measured by nighttime light data, which is derived from satellite remote sensing data. Financial capital includes the average amount of deposits, loans, and government subsidies in the village. Natural capital consists of five indicators: land assets, rainfall, temperature, slope, and ecological quality. Among them, satellite remote sensing data derives the four geo-environmental indicators of precipitation, temperature, slope, and ecological quality. Social capital mainly includes the level of trust among village neighbors and gift expenditure.
In summary, the algorithm training involves 19 input variables, as measured by the specific indicators shown in Table 1.

Variable definitions
Citation: International Food and Agribusiness Management Review 28, 2 (2025) ; 10.22434/ifamr.1096
3.2 Data sources
This paper has two primary data sources for training machine learning algorithms. The first dataset is the traditional socio-economic survey data. This part of the data comes from the 2018 and 2020 China Family Panel Studies (CFPS), a nationally representative sample survey of family households conducted biannually since 2010 for all members of about 16,000 households across the country. The survey covers various research topics, including household economic activity, educational outcomes, family relationships and migration, and health. The data provides the essential information needed for this research. Its comprehensive survey information reflects the current living conditions of households lifted out of poverty and reveals the underlying factors influencing large-scale poverty-returning. Moreover, the long-term tracking records of the CFPS provides continuous dynamic data, allowing an in-depth analysis of poverty-returning trends and patterns. This feature greatly benefits the use of machine learning approaches in this study, ensuring the models accurately capture multi-dimensional and multi-stage characteristics of poverty-returning, thereby enhancing the studyâs accuracy and scientific validity. Based on the previous definition of large-scale poverty-returning, we finally get a sample of 143 villages.
The second dataset is satellite remote sensing data. It is difficult to comprehensively capture the potential risk factors of large-scale poverty-returning through micro-level socio-economic surveys alone, which need to be supplemented by big data technology. In this scenario, satellite remote sensing image data have explicit geospatial attributes, can accurately locate the area where the village is located, and provide relevant geographic information, which makes satellite remote sensing data have unparalleled advantages in poverty prediction and identification (Wang et al., 2021). Specifically, the five indicators, namely, nighttime light intensity, average annual rainfall, average annual temperature, terrain slope, and ecological quality index, are derived from satellite remote sensing data.
3.3 Machine learning algorithms
First of all, in the prediction of large-scale poverty-returning risks, the model we use is the random forest algorithm in supervised learning. The advantage of this algorithm is that it can not only effectively avoid the over-fitting problem of a single decision tree model but also does not need to carry out feature selection, which is one of the mainstream supervised learning algorithms. Secondly, in the pattern recognition of large-scale poverty-returning risks, the K-means clustering algorithm in unsupervised learning is used, which has a better clustering performance and fast convergence speed, and thus is widely used in clustering tasks (Wang and Yu, 2023; Zeng and Chen, 2023). The details of the two algorithms are described below.
3.3.1 Random forest algorithm
The random forest is a powerful machine learning algorithm for solving classification and regression problems (Breiman, 2001). The primary feature of this algorithm is based on multiple decision trees. First of all, several subsets of samples are randomly generated from the original data by the bootstrap sampling approach. This means that each decision tree has a different training dataset. Secondly, the random forest algorithm also introduces feature randomness in constructing each decision tree. Instead of selecting the best feature from all the features in the splitting phase of each node, a random subset is generated at a time to make the selection. Finally, when all the decision trees are constructed, a final prediction result will come out by voting or weighted average. Based on this idea, multiple weak learners (i.e., decision trees) are integrated into one powerful learner. By introducing resampling, feature randomness, and integration strategies, the random forest algorithm effectively overcomes the overfitting problem and has an extensive range of applications. The technical details of the random forest algorithm are described below.
Considering a scenario in which a random vector (X, Yâ ) follows an independent distribution, we create a random training set from (X, Yâ ) vector by dividing it into an input vector X and an output vector Y. Thus, we can denote the mean-square generalization error of the prediction result h(Xâ ) as EX,Y(Y â h(Xâ ))2. The prediction result of random forest is derived from the results of k-independent decision trees {h(θ, Xk)}, and the final prediction value is the average of these results. The random forest algorithm relies on the following two theorems:
Theorem 1: When k â â
Citation: International Food and Agribusiness Management Review 28, 2 (2025) ; 10.22434/ifamr.1096
In equation (1), the right part of the equation represents the predictive effectiveness metrics of the random forest algorithm, denoted as PE**, and PE* indicates the average predictive effectiveness of a single decision tree. PE* satisfies the following theorem:
Citation: International Food and Agribusiness Management Review 28, 2 (2025) ; 10.22434/ifamr.1096
Theorem 2: For all randomly generated training sets θ:
Citation: International Food and Agribusiness Management Review 28, 2 (2025) ; 10.22434/ifamr.1096
Considering the scenario where θ is uncorrelated with θâ², ÏË indicates the weighting coefficient between the residuals Y â h(X, θ) and Yâh(X, θâ²â). The above theorem illustrates the preconditions for improving the accuracy of random forest. To further improve the prediction ability, the random forest algorithm adopts the weighting strategy ÏË. In the following part, we will introduce the implementation process of this algorithm in detail step by step.
Step 1: The bootstrap method is used to resample the sample set in order to generate k random training subsets θ1, θ2,â¦, θk. Each of the generated training subsets can further develop specific decision trees {T(x, θ1)}, {T(x, θ2)}, ⦠{T(x, θk)}.
Step 2: In the process of decision tree construction, we randomly select m features from all the M features and use them as the feature set when the current decision tree is split. Then, we select the optimal split from these m features (the value of m should be constant).
Step 3: No pruning1 operation is performed on a single decision tree to allow maximum expansion of the decision tree.
Step 4: Calculate the value of leaf node l(x, θ) and output the result of the operation of T(θ) after taking the mean value. Corresponding to an observation Xi, the weight wi(x, θ) can be expressed as:
Citation: International Food and Agribusiness Management Review 28, 2 (2025) ; 10.22434/ifamr.1096
where 
Step 5: The result of a particular decision tree is obtained by a weighted average of the observations Yi (i = 1,2,â¦, n) of the input variable x. The following equation gives the result of the operation of a single decision tree:
Citation: International Food and Agribusiness Management Review 28, 2 (2025) ; 10.22434/ifamr.1096
Step 6: The weights of the decision tree wi(x, θt)(t = 1,2,â¦, k) are averaged to get the weights of each observation Yi Ã(1,2,â¦, n) wi (x)
Citation: International Food and Agribusiness Management Review 28, 2 (2025) ; 10.22434/ifamr.1096
Therefore, the final output value of the algorithm can be obtained by the following equation:
Citation: International Food and Agribusiness Management Review 28, 2 (2025) ; 10.22434/ifamr.1096
3.3.2 K-means algorithm
The K-means algorithm stands out as a classical representative among unsupervised machine learning algorithms, primarily employed in processing large-scale, high-dimensional data points (Likas et al., 2003; Yu and Maruejols, 2023). These data points, often characterized as cluster centers, play a pivotal role in data clustering. By employing a minimal number of representative points, the algorithm significantly alleviates the computational and data processing burden on the system. The fundamental concept underlying this clustering algorithm revolves around partitioning data into clusters, where data points within the same cluster exhibit similarities, while those in different clusters display significant dissimilarities. A critical aspect of this method involves pre-determining the number of clusters, followed by several rounds of iterative calculations aimed at progressively minimizing the error value of each objective function. This iterative process continues until the objective function approaches stability, thereby facilitating the effective clustering of data. The K-means algorithmâs versatility and efficiency make it particularly well-suited for applications involving large-scale datasets, contributing to its widespread acclaim in the realm of unsupervised machine learning.
When applying this clustering algorithm, the goal is to minimize the squared error between each data point and the cluster center to which it belongs. Suppose we have set the dataset to contain h cluster centers, and by default, the first k cluster can be denoted as the set Gk. Suppose Gk contains nk data points {X1k, X2k,â¦Xnk} and denote the center of the cluster as yk. In this case, the squared error of the cluster ek can be defined as:
Citation: International Food and Agribusiness Management Review 28, 2 (2025) ; 10.22434/ifamr.1096
Here, we need to specify that each data point xik belongs to a specific cluster Gk. Therefore, the total squared error for the h clusters E can be defined as the sum of the squared error for each cluster, i.e., the error function for the sub-cluster can be obtained:
Citation: International Food and Agribusiness Management Review 28, 2 (2025) ; 10.22434/ifamr.1096
The K-means algorithm is an algorithm that aims to find the h that minimizes the error function E and the corresponding cluster centers. The steps of the K-means algorithm are as follows:
Step 1: Set the number of clusters h and select h samples as the initial cluster centers.
Step 2: The distance between each sample and each default clustering center is calculated separately. Subsequently, each sample is assigned to the cluster center with the closest distance, thus forming an initial set of clustered data samples.
Step 3: For all samples within each cluster, the center (i.e., the mean value) of the cluster is recalculated, and this value is then used as the new center of the cluster. Each sample is then reassigned again to the closest cluster based on the distance between the sample and the new center.
Step 4: Repeat the first three steps until the clustering members reach a steady state, which means the clustering task has been completed.
4. Prediction of the large-scale poverty-returning risks
4.1 Prediction results based on the random forest algorithm
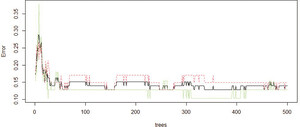
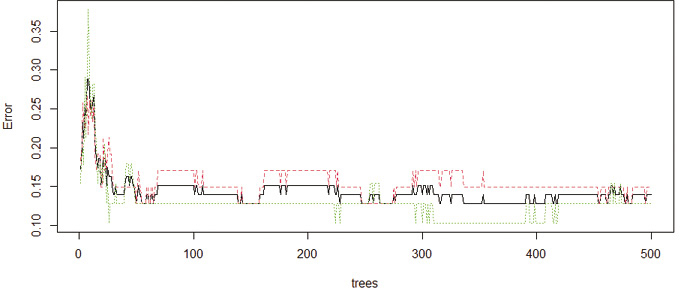
The random forest is an ensemble learning algorithm that takes decision trees as the basic unit and forms a random forest by integrating a large number of decision trees. Therefore, a key parameter of the random forest algorithm is to determine the optimal number of decision trees. Under the optimal number of decision trees, the random forest algorithm can achieve the optimal prediction performance. As shown in Figure 1, when the number of decision trees is 50, the random forest algorithm has the lowest out-of-bag error2 (OOB) rate, which means that the model predicts with the highest accuracy.
Number of optimal decision trees.
Citation: International Food and Agribusiness Management Review 28, 2 (2025) ; 10.22434/ifamr.1096
Accordingly, a random forest model with a number of decision trees of 50 is developed in this paper. The prediction results of this model show that the out-of-bag error rate (OOB) is 16.28%, indicating that the accuracy of the out-of-bag sample (out-of-bag sample) is 83.72%. Based on the testing results of the training dataset, we further use the test dataset to calculate the prediction results of the trained model. The results show that, based on the test dataset, the prediction accuracy of villages with a high risk of large-scale poverty-returning is as high as 91.23%. In this case, we can conclude that the five types of capital prediction indicators constructed based on the Sustainable Livelihoods Framework are able to accurately predict 91.23% of the villages with a high risk of large-scale poverty-returning. In addition to the above evaluation indicators, sensitivity and specificity based on the confusion matrix are also commonly used model evaluation indicators. The calculation results show that the modelâs sensitivity is as high as 95.65%, and the specificity reaches 88.23%. As such, the random forest algorithm confirms the prospect and application value of supervised machine learning algorithms in predicting the large-scale poverty-returning risk.
4.2 Evaluation of the importance of variables and economic interpretation
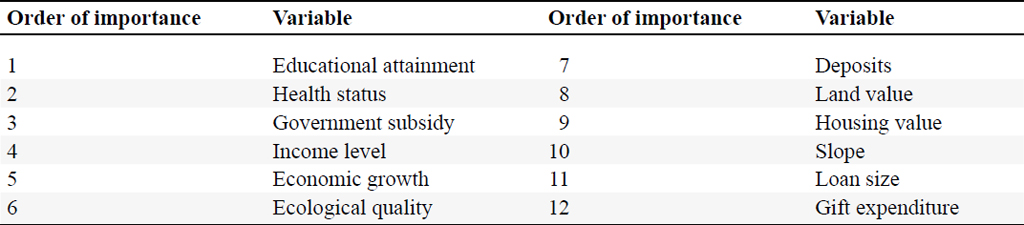
To enhance the interpretability of the algorithm and avoid the âblack boxâ problem of machine learning, we further analyze the importance of the variables in the prediction. In the random forest algorithm, the decrease in the average Gini coefficient due to each variable can be measured and averaged over each decision tree to obtain the importance of the variable. Following this line of thought, Table 2 presents the variable importance ranking in the predictions generated by the random forest algorithm. The top six variables, listed in descending order of significance, include educational attainment, health status, government subsidies, farm household income, regional economic development, and ecological quality. This investigation highlights a robust correlation between these factors and the risk of large-scale poverty-returning, offering valuable insights for predicting such risks.
Importance of variables
Citation: International Food and Agribusiness Management Review 28, 2 (2025) ; 10.22434/ifamr.1096
Beyond the conventional variables like education, health, government subsidies, and farmersâ income, satellite remote sensing data indicators, such as nighttime light intensity (a proxy for regional economic development) and ecological quality, emerge as crucial variables in predicting the risk of large-scale poverty-returning. These indicators not only address the limitations of traditional economic and social statistical indicators but also offer the advantages of high-frequency, real-time, and convenient data. Such inclusion contributes to enhancing monitoring and early-warning efficiency regarding the risk of large-scale poverty-returning.
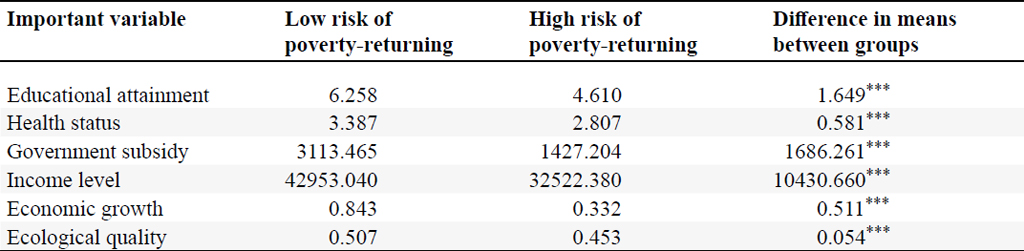
The descriptive statistical analysis results for the significant variables are presented in Table 3. The statistical tests for differences in group means demonstrate that the group means of the six critical predictor variables exhibit significant differences at the 1% level. Subsequent comparisons underscore that villages with a high risk of large-scale poverty-returning consistently exhibit inferior factor endowments across all aspects compared to villages with low risk.
Group differences of important variables
Citation: International Food and Agribusiness Management Review 28, 2 (2025) ; 10.22434/ifamr.1096
Firstly, The variable contributing most to the modelâs prediction accuracy is the human capital of village households, encompassing education levels and physical health. As evidenced by the statistical results in Table 3, villages with a high risk of large-scale poverty-returning exhibit a low level of human capital, while those with a low risk demonstrate a higher level of human capital. Despite the various support measures during the poverty eradication stage contributing significantly to the development of low-income populations, the enduring sustainability of poverty eradication hinges on the endogenous development capabilities of the population that has been lifted out of poverty. Obviously, the resilience against the potential risk of poverty-returning is contingent on the formation of endogenous development capabilities and the realization of sustainable income growth. The statistical analysis reveals that farmers in villages with a high risk of large-scale poverty-returning possess a lower level of education, rendering them less competitive in the job market, especially in the era of the digital economy, where the demand for skilled labor is escalating. Simultaneously, the physical health of farmers in high-risk villages is notably compromised. Numerous studies consistently emphasize the role of health-related factors, with âreturning to poverty due to illnessâ identified as a significant contributor to poverty-returning (Liao et al., 2020; Xiao et al., 2023). A diminished health status not only impedes effective socio-economic activities and jeopardizes a secure income source for the population out of poverty but also entails elevated medical expenditure costs. This challenge not only obstructs effective socio-economic activities but also escalates the risk of poverty-returning.
In addition to the human capital of village farmers, the villageâs physical and financial capital emerge as variables with substantial predictive contributions, encompassing government subsidies, the income level of farmers, and the regional economic development level. Consistent with the statistical results in Table 3, villages with a high risk of large-scale poverty-returning receive significantly lower government subsidies than those with a low risk. Government subsidies are pivotal in poverty reduction and income augmentation, particularly for individuals with limited working ability. For those who lack the means to sustain their basic livelihoods, reduced government subsidies may lead to a precarious economic situation, increasing the likelihood of a return to poverty. Furthermore, the level of physical capital is crucial for ensuring the sustainable development of the population out of poverty. At the micro level, the income generated by individuals who have escaped poverty satisfies their material needs and facilitates various socio-economic activities. This income level is instrumental in determining their ability to maintain their welfare effectively. Accordingly, rural households in villages with a low risk of large-scale poverty-returning demonstrate higher income levels, contributing to the assurance of their basic welfare. From a macro perspective, the income growth of the population out of poverty is intricately linked to regional economic development. A high level of regional economic development creates a conducive economic and industrial growth environment, offering more employment and entrepreneurial opportunities for the impoverished population. Additionally, it supports the enhancement of local government revenues and increases financial transfers at the regional level, further bolstering the economic resilience of the population out of poverty.
Lastly, the natural capital of the village, precisely the ecological quality, reveals noteworthy patterns in the statistical results from Table 3. It is evident that villages with a high risk of large-scale poverty-returning exhibit significantly lower ecological quality than villages with low risk. This underscores the vital role of ecological quality in shaping the potential for large-scale poverty-returning. Natural risk shocks, often manifesting as natural disasters, emerge as a critical factor influencing poverty-returning for individuals who have successfully escaped poverty. Villages with poor ecological quality are more susceptible to natural disasters, rendering individuals whose livelihoods predominantly rely on agricultural production particularly vulnerable to large-scale poverty-returning triggered by natural risk shocks. Moreover, the consequences of natural disasters threaten the lives and property of village residents and potentially hamper the village economyâs development. These detrimental effects are detrimental to the sustainable development of the impoverished population. Addressing and mitigating the ecological risks impoverished communities face is crucial to ensuring their sustainable development.
5. Identifying patterns of large-scale poverty-returning risks
The preceding section employed the random forest algorithm as a supervised learning approach to predict the risk of large-scale poverty-returning, identifying crucial variables for model predictions. While the random forest provides valuable insights for ex-ante intervention based on its predictive capabilities, it is essential to acknowledge the inherent regional variations in the characteristics of large-scale poverty-returning risk. Effectively managing the risk of large-scale poverty-returning requires a comprehensive understanding of diverse patterns associated with this risk across different regions. This paper will further employ unsupervised learning, specifically the K-means algorithm, to address this need. The objective is to unveil distinct patterns of large-scale poverty-returning risk and elucidate their intrinsic characteristics.
5.1 Pattern recognition results based on the K-means algorithm
The K-means algorithm, a prominent technique in unsupervised learning, serves as the primary method for cluster analysis. This method delves into the intrinsic characteristics of sample data, aiming to make the features of observations within the same category as similar as possible while ensuring that the features of observations across different categories are as dissimilar as possible. Thus, the K-means algorithm is a robust analytical tool pivotal for identifying patterns associated with large-scale poverty-returning risk in this paper.
Choosing the optimal number of clusters is a critical step in the K-means clustering algorithm, and various selection criteria have been proposed by scholars to address this issue. Common criteria include the Silhouette Coefficient, CalinskiâHarabasz Criterion, DaviesâBouldin Criterion and Elbow Rule, each providing a different perspective on optimal clustering. However, using a single index for selection may introduce bias in the clustering results, as each criterion has its own strengths and limitations. To address this challenge, this paper adopts the majority principle suggested by Charrad et al. (2014), considering multiple selection criteria simultaneously. The analysis reveals that among 23 selection guidelines, 13 indicate that the optimal number of clusters is 3. Consequently, based on the majority principle, the final number of clusters selected for this paper is 3. This implies that three distinct patterns are associated with the risk of large-scale poverty-returning, providing a more comprehensive understanding of the variations in these patterns across different regions.
5.2 Characterization of risk patterns of return to poverty at scale
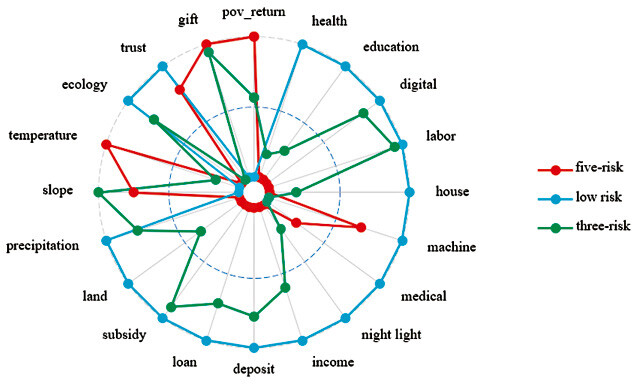
In applying the K-means clustering algorithm, this paper successfully identifies three distinct patterns associated with the risk of large-scale poverty-returning, as illustrated in Figure 2. Building upon the characteristics observed in these three patterns, the paper defines each type of risk pattern.
Poverty-returning risk pattern.
Citation: International Food and Agribusiness Management Review 28, 2 (2025) ; 10.22434/ifamr.1096
The first category is defined as having a low risk of large-scale poverty-returning. Villages falling into this category exhibit a low incidence of large-scale poverty-returning. Across all dimensions of sustainable livelihood capital, these villages demonstrate favorable conditions, showcasing elevated levels of human, physical, financial, and social capital. Additionally, in terms of natural capital, these villages boast a better ecological environment and climatic conditions than the other two types. This pattern indicates that when villages have more favorable sustainable livelihood capital conditions, the rural households enjoy sufficient resource guarantees, effectively reducing the risk of large-scale poverty-returning.
The second category is defined as the three-risk pattern. Villages falling into this category experience a significantly higher rate of large-scale poverty-returning compared to the first type, indicating a heightened scale risk of poverty-returning. Specifically, the risk in villages with this pattern is concentrated in human, physical, and social capital risks. Firstly, in terms of human capital, villages in this category exhibit lower levels of education and poorer health conditions. As discussed earlier, insufficient human capital in terms of education and health hinders the formation of self-development capabilities, leading to a higher likelihood of poverty-returning. Secondly, concerning physical capital, all types of physical capital in these villages are low. This impedes their ability to withstand external risk shocks due to inadequate assets and limits opportunities for economic development. Lastly, regarding social capital, villages in this category display significantly lower levels of neighborhood trust. Additionally, itâs noteworthy that high gift expenditures may crowd out investments in education, health, and production. Despite these challenges, financial capital and natural capital remain relatively favorable for this type of village.
The third category is defined as the five-risk pattern. Villages in this category exhibit the highest rate of large-scale poverty-returning among the three types, drawing significant attention from policymakers. Relative to the first and second types of villages, the level of sustainable livelihood capital in this category is not optimistic. Firstly, concerning human capital, both mental human capital (education, numerical ability) and physical human capital (health, number of laborers) are at the lowest levels among the three types of villages. This suggests that a substantial portion of the rural households in these villages may lack the ability to work, constraining their participation in economic production activities. Consequently, the channels for endogenous income generation are severely restricted. Secondly, regarding physical and financial capital, villages in this category also exhibit the lowest levels. This leads to a dual challenge: a lack of adequate physical and financial capital for economic production activities and a precarious livelihood situation due to low government financial subsidies, particularly for those lacking labor capacity. Regarding natural capital, these villages face notable deficiencies in natural resource conditions, such as high topographic slopes, low rainfall, and poor ecological quality. This exposes them to greater natural risk shocks, adversely affecting agricultural production activities. Additionally, in the realm of social capital, while the level of neighborhood trust is relatively sound, the average level of gift expenditures by village farmers is the highest among the three types of villages. In the absence of adequate economic support, heightened levels of human gift exchanges are likely to deteriorate the economic situation of the households further. In summary, the third category of villages faces greater risks across human, physical, financial, natural, and social capital. This elevated risk profile contributes to a high rate of poverty-returning in this category, making it susceptible to the phenomenon of large-scale poverty-returning.
The preceding analysis underscores discernible disparities in the livelihood capital among villages exhibiting varying patterns of large-scale poverty-returning. Consequently, targeted interventions aimed at forestalling large-scale poverty-returning necessitate a precise approach tailored to local conditions. For instance, for the five-risk pattern, the principal policy objective should center on fortifying basic needs through financial support, ensuring that individuals lacking the capacity can sustain a fundamental livelihood. Contrastingly, for the three-risk pattern, the populace possesses a certain degree of labor capability. Therefore, the primary thrust of policy orientation at this stage involves preferential policies and implementing measures conducive to fostering economic and industrial development in these areas. The overarching goal is to empower the population effectively, enabling them to extricate themselves from poverty. Conversely, for the low-risk pattern, it is essential to enhance social security entitlements to allow individuals to exercise their right to development, thereby realizing sustainable development.
6. Conclusions and policy implications
While China has successfully eradicated absolute poverty, the vulnerability among those who have escaped from poverty underscores the persisting risk of large-scale poverty-returning. Effectively predicting and proactively intervening to mitigate the risk of large-scale poverty-returning constitute crucial measures to sustain the achievements made. Machine learning, distinguished by its high efficiency, dynamic adaptability, and precision in early warning and pattern recognition, emerges as a potent tool for discovering the risk of large-scale poverty-returning. Therefore, this study endeavors to employ machine learning methodologies for the prediction and pattern recognition of large-scale poverty-returning risks. Adopting machine learning techniques represents a noteworthy contribution to the existing literature, enhancing the analytical toolkit available for comprehending and addressing the complexities associated with large-scale poverty-returning.
Building upon the Sustainable Livelihood Framework, this paper integrates data from the China Family Panel Studies (CFPS) and satellite remote sensing, employing machine learning algorithms such as the random forest and K-means clustering to investigate the prediction and pattern recognition of large-scale poverty-returning risks. The study concludes that the random forest algorithm demonstrates a commendable accuracy of 91.23% in predicting villages with a high risk of large-scale poverty-returning, affirming the promising prospects and value of supervised machine learning algorithms in forecasting large-scale poverty-returning. Moreover, the identification of crucial variables further enhances our understanding of the dynamics of poverty-returning. Notably, education level, health condition, government subsidy, income level of farmers, regional economic development, and ecological environment quality emerge as the top six contributors. These findings establish a factual basis for crafting preventive measures against the risk of large-scale poverty-returning. Subsequent clustering analysis identifies three distinct categories of large-scale poverty-returning risk: low-risk pattern, three-risk pattern, and five-risk pattern. Notably, the livelihood capital across various dimensions is consistently low in the five-risk pattern, signifying a heightened susceptibility to large-scale poverty-returning. This demands particular attention in policy formulations aimed at preventing large-scale poverty-returning.
The aforementioned findings carry significant policy implications. Firstly, there is a pressing need to expedite and enhance the establishment of a robust monitoring and early-warning mechanism for the risk of large-scale poverty-returning. Mitigating large-scale poverty-returning risk hinges on timely and effective preemptive measures. The conventional approach to identifying poverty-returning risk, relying on manual identification and one-by-one investigation, demands substantial workforce and material resources and is susceptible to issues such as delayed intervention in poverty alleviation efforts. Therefore, governments should harness the advantages of artificial intelligence and big data technology in the digital era to establish a modernized monitoring and early-warning system for the risk of returning to poverty on a large scale. This system should comprehensively capture internal and external risk elements associated with large-scale poverty-returning, enabling a dynamic screening and early intervention mechanism. The aim is to furnish efficient information supply and decision-making support for the governance of the risk of large-scale poverty-returning.
Secondly, tailored policy approaches are imperative for villages with distinct risk patterns. For the five-risk pattern villages, the implementation of social security measures, colloquially referred to as âbottoming outâ policies, is pivotal. These policies serve to establish a robust safety net, averting poverty-returning. It extends essential economic aid and living assistance to individuals lacking employable skills who have relapsed into poverty. Simultaneously, infrastructure construction should be enhanced to improve transportation, water supply, and irrigation systems. Additionally, financial support should be offered through pro-poor loans and interest-subsidy policies to assist villagers in developing their production activities. Furthermore, ecological compensation and environmental management measures have been implemented to foster sustainable agricultural development.
For three-risk pattern villages, which face moderate risks in human, physical, and social capital but are relatively strong in financial and natural capital, the policy focus should be on âempoweringâ the population to escape poverty. Also, supporting flexible employment and industrial development, developing local specialty industries, and offering skills training are crucial to ensuring that population escaping poverty have a stable income source. Besides, education and health services should be strengthened to improve rural householdsâ education, health, labor capacity, and employment competitiveness. Meanwhile, promoting rural householdsâ cooperatives and community activities can enhance trust and cooperation, reduce the burden of excessive cash gifting, and foster a stronger mutual assistance mechanism within villages. Lastly, sustained efforts are required for the low-risk pattern villages to advance the integrated development of urban and rural areas. This involves realizing the amalgamation of urban and rural social security systems. Essential to this effort is providing âfair, equitable, and sharedâ social security entitlements encompassing education, healthcare, and old-age pensions for the impoverished populace. Alleviating discrimination and employment inequalities is paramount, reinforcing impartial opportunities for the poor. This, in turn, propels sustainable livelihoods for the impoverished population.
Acknowledgements
This research was supported by the National Social Science Foundation of China (22CJY037) and the 2024 Humanities and Social Science Base Project of Chongqing Education Commission (24SKJD025).
References
Adrian, T., N. Boyarchenko and D. Giannone. 2019. Vulnerable growth. American Economic Review 109(4): 1263â1289.
Asfaw, S., N. McCarthy, A. Paolantonio, R. Cavatassi, M. Reda and L. Lipper. 2015. Livelihood diversification and vulnerability to poverty in rural Malawi. Available online at https://papers.ssrn.com/sol3/papers.cfm?abstract_id=3305894.
Benali, N., I. Abdelkafi and R. Feki. 2018. Naturalâdisaster shocks and governmentâs behavior: Evidence from middleâincome countries. International Journal of Disaster Risk Reduction 27: 1â6.
Breiman, L. 2001. Random forests. Machine Learning 45: 5â32.
Charrad, M., N. Ghazzali, V. Boiteau and A. Niknafs. 2014. NbClust: an R package for determining the relevant number of clusters in a data set. Journal of Statistical Software 61: 1â36.
Chen, S., J. Li, S. Lu and B. Xiong. 2017. Escaping from poverty trap: a choice between government transfer payments and public services. Global Health Research and Policy 2(1): 1â16.
Chen, J., S. Rong and M. Song. 2021. Poverty vulnerability and poverty causes in rural China. Social Indicators Research 153: 65â91.
Deng, Q., E. Li and Y. Yang. 2022. Politics, policies and rural poverty alleviation outcomes: Evidence from Lankao County, China. Habitat International 127: 102631.
Di, Z. and M. Wang. 2019. The internal logic of povertyâreturning: theory and verification of vulnerable poverty alleviation. Journal of Finance and Economics 45(11): 126â139.
Du, Y. and R. Zhao. 2023. Early Warning of Poverty Returning against the Background of Rural Revitalization: A Case Study of Two Counties in Guangxi Province, China. Agriculture 13(5): 1087.
Fan, Y., J. Ning and H. Qin. 2023. Investigating the effectiveness of livelihood capital in reducing reâpoverty risk: an empirical analysis of policy withdrawal and income structures in rural China. Frontiers in Environmental Science 11: 1175315.
Fang, J. Construction and demonstration of earlyâwarning evaluation index system of poverty return from the perspective of rural revitalization. Applied Mathematics and Nonlinear Sciences 9(1): 1â17.
Gloede, O., L. Menkhoff and H. Waibel. 2015. Shocks, individual risk attitude and vulnerability to poverty among rural households in Thailand and Vietnam. World Development 71: 54â78.
Gong, Q. and J. Zhang. 2007. Relations between agricultural natural disasters and rural poverty based on analysis of panel data in Anhui Province, China. China Population. Resources and Environment 17(4): 92â95.
Guo, Y., Y. Zhou and Y. Liu. 2022. Targeted poverty alleviation and its practices in rural China: A case study of Fuping County, Hebei Province. Journal of Rural Studies 93: 430â440.
Guo, K., Y. Li, Y. Zhang, Q. Ji and W. Zhao. 2023. How are climate risk shocks connected to agricultural markets?. Journal of Commodity Markets 32: 100367.
Komarek, A. M., A. De Pinto and V. H. Smith. 2020. A review of types of risks in agriculture: What we know and what we need to know. Agricultural Systems 178: 102738.
Li, E., Q. Deng and Y. Zhou. 2022. Livelihood resilience and the generative mechanism of rural households out of poverty: An empirical analysis from Lankao County, Henan Province, China. Journal of Rural Studies 93: 210â222.
Liu, Y., Y. Guo and Y. Zhou. 2018. Poverty alleviation in rural China: Policy changes, future challenges and policy implications. China Agricultural Economic Review 10(2): 241â259.
Liu, T., L. Yu, X. Chen, X. Li, Z. Du, Y. Yan, D. Peng and P. Gong. 2024. Utilizing nighttime light datasets to uncover the spatial patterns of countyâlevel relative povertyâreturning risk in China and its alleviating factors. Journal of Cleaner Production 448: 141682.
Li, Q., P. Sun, B. Li and M. Mohiuddin. 2022. Impact of climate change on rural poverty vulnerability from an income source perspective: A study based on CHIPS2013 and countyâlevel temperature data in China. International Journal of Environmental Research and Public Health 19(6): 3328.
Li, X., Y. Luo and H. Wang. 2023. Effects of Targeted Poverty Alleviation on the Sustainable Livelihood of Poor Farmers. Sustainability 15(7): 6217.
Liao, W., J. Qiao, D. Xiang, T. Peng and F. Kong. 2020. Can labor transfer reduce poverty? Evidence from a rural area in China. Journal of Environmental Management 271: 110981.
Likas, A., N. Vlassis and J. Verbeek. 2003. The global kâmeans clustering algorithm. Pattern Recognition 36(2): 451â461.
Mina, C. and K. Imai. 2017. Estimation of vulnerability to poverty using a multilevel longitudinal model: Evidence from the Philippines. The Journal of Development Studies 53(12): 2118â2144.
Morduch, J. 1994. Poverty and vulnerability. American Economic Review 84(2): 221â225.
Onsay, E. and J. Rabajante. 2024. Measuring the Unmeasurable through Machine Learning Regressions and Classifications: Multidimensional Poverty Predictions in the Poorest Region of Luzon, Philippines. Data Brief 53: 110150.
Pan, Y., J. Chen, X. Yan, J. Lin, S. Ye, Y. Xu and X. Qi. 2022. Identifying the spatialâtemporal patterns of vulnerability to Reâpoverty and its determinants in rural China. Applied Spatial Analysis and Policy 15(2): 483â505.
Wang, H. and X. Yu. 2023. Carbon dioxide emission typology and policy implications: Evidence from machine learning. China Economic Review 78: 101941.
Wang, H, L. Maruejols and X. Yu. 2021. Predicting energy poverty with combinations of remoteâsensing and socioeconomic survey data in India: Evidence from machine learning. Energy Economics 102: 105510.
Wang, S., Y. Guo and Z. He. 2023. Analysis on the measurement and dynamic evolution of multidimensional return to poverty in Chinese rural households. Social Indicators Research 165(1): 31â52.
Wang, Y.B., J. Zhao, R. Yao, R. Zhao and Y. Li. 2022. Risk of Poverty Returning to the Tibetan Area of Gansu Province in China. Sustainability 14(18): 11268.
Ward, P.S. 2016. Transient poverty, poverty dynamics and vulnerability to poverty: An empirical analysis using a balanced panel from rural China. World Development 78: 541â553.
Xiao, H., X. Liang, S. Xing, L. Huang and F. Xie. 2023. Does Land Lease Affect the Multidimensional Poverty Alleviation? The Evidence from Jiangxi, China. Land 12(5): 942.
Xu, Y. and L. Carraro. 2017. Minimum income programme and welfare dependency in China. International Journal of Social Welfare 26(2): 141â150.
Xu, F., X. Zhang and D. Zhou. 2022. Does digital financial inclusion reduce the risk of returning to poverty? Evidence from China. International Journal of Finance & Economics 10: 1467â8268.
Xu, F., X. Zhang and D. Zhou. 2023. Do rural clanâbased networks reduce the risk of a return to poverty? Evidence from China. Journal of International Development 35(5): 856â883.
Xu, F., X. Zhang and D. Zhou. 2024. Does digital financial inclusion reduce the risk of returning to poverty? Evidence from China. International Journal of Finance & Economics 29(3): 2927â2949.
Yu, X. and L. Maruejols. 2023. Prediction, pattern recognition and machine learning in agricultural economics. China Agricultural Economic Review 15(2): 375â378.
Zeng, Q. and X. Chen. 2023. Identification of urbanârural integration types in Chinaâan unsupervised machine learning approach. China Agricultural Economic Review 15(2): 400â415.
Zhang, Y., W. Wang and Y. Feng. 2022a. Impact of different models of rural land consolidation on rural household poverty vulnerability. Land Use Policy 114: 105963.
Zhang, R., Y. He, W. Cui, Z. Yang, J. Ma, H. Xu and D. Feng. 2022b. Povertyâreturning risk monitoring and analysis of the registered poor households based on BP neural network and natural Breaks: A Case study of Yunyang District, Hubei province. Sustainability 14(9): 5228.
Zhou, D., F. Zha, W. Qiu and X. Zhang. 2024. Does digital literacy reduce the risk of returning to poverty? Evidence from China. Telecommunications Policy 48(6): 102768.
Corresponding author
The decision tree is pruned for removing some unnecessary logical judgments and merging the subsets.
The meaning of out-of-bag refers to the assumption that the total number of samples is M, and only N samples are collected in one sampling, which means that there are M - N samples that are not collected for the training of the model, and these samples can be used as a later test of the prediction error of the Random Forest model, i.e., the out-of-bag prediction value is compared with the actual observation value, and the out-of-bag error is calculated.


