Beyond general aspects of research design and basic research concepts, educators seeking to build an evidence-informed knowledge base about learning, development, and teaching that includes evidence from neuroscience research will need more specialized knowledge. Such knowledge goes beyond general, summative claims such as teachers are “designers of experiences that ultimately change students’ brains” (Dubinsky et al., 2013, p. 318) (they are, but every experience changes the brain and most teachers in most classrooms will never directly observe neural changes in their students—although they may notice associated behavioral changes). If you will be spending time in the neuroscience research literature, there are some fundamental concepts that are useful to know when reading and evaluating neuroscience studies.
1 Neurons
A neuron is a type of brain cell that processes information (see Figure 4). Neurons process information through electrical and chemical signals. The electrical signals can be recorded noninvasively at the scalp using a method called electroencephalography (EEG). Another method that is closely related, event-related potentials (ERPs), involves recording the neural electrical activity related to processing a specific type of information. We will return to both of these methods.
In order to be active and process information, neurons need energy. That energy comes from oxygen and glucose. Neurons get oxygen and glucose from blood carried by blood vessels throughout the brain. Neurons that are more active need more energy. It follows that brain areas in which the bloodstream has less oxygen and glucose are areas in which the neurons are most active (because the neurons have used up the oxygen and glucose from the blood to be active). Methods such as functional magnetic resonance imaging (fMRI) provide a measure of relative oxygen levels in the blood. We will return to this method as well.
Sometimes when people talk about using neuroscience research in education, they mean using a scientific understanding of how the brain functions

A schematic neuron, with the axon at the lower left (Source: Nicolas Rougier, https://commons.wikimedia.org/wiki/File:Neuron-figure-notext.svg, CC BY-SA 3.0)
Indeed, it has been noted that “the causal chain of reasoning from a basic neuroscience fact to a teaching method is often weak or nonexistent” (Coch, 2018, p. 311). Cellular neuroscience studies purportedly showing that “the brain learns this way” are not the same as classroom studies showing that “you should teach this way”; in fact, they are not studies of teaching at all. A great inferential leap is required to draw pedagogical conclusions based on the findings from such basic neuroscience research, which is not the same as evidence-based practice. Nevertheless, it is useful to know a little bit about neurons in order
2 Levels of Analysis Issues
Another way of thinking about using neuroscience research in education involves a different level of analysis (see Figure 5). Rather than focus on how
An illustration of the idea of levels of analysis. Basic neural levels (in blues) are not observable. Types of neural processing (in purples) are not observable but are inferable through behavior. Behavior (in orange) is observable and is the key level of analysis in classrooms. The wider contexts within which behaviors and social, affective, cognitive, and neural processing occur (in greens) are designed and constructed, as is the local and national context (in salmon), for example, in terms of educational policies.
From this perspective, neuroscience research operates at a different level of analysis (systems, rather than cells) and many neuroscience studies, rather than providing general information about “how the brain learns”, can provide more specific information about how a child with a developing human brain learns certain skills and concepts (e.g., in the cognitive, affective, and social domains). However, this neuroscience research, too, is often not directly related to specific pedagogical practices (that is, the research design involves a manipulation of learning but not teaching). A science of learning and a science of teaching, although both necessarily interdisciplinary and intimately related, are not the same thing (Daniel and De Bruyckere, 2021; Mayer, 2018). It seems unlikely that neuroscience research would contribute in the same way or equally meaningfully to both.
A levels-of-analysis framework highlights at least two important hindrances to integrating neuroscience research findings into education-related knowledge bases and mental models. First, educationalists are concerned with many things that neuroscience research simply does not currently directly address, like attendance policies, grading rubrics, gradual release of responsibility, and community engagement. These factors are at entirely different levels of analysis than the ones at which neuroscience operates (refer to Figure 5). This has been called the goals problem in discussions about neuroscience and education
These problems underscore the importance of recognizing that neuroscience findings can likely only make modest contributions to education—and must do so in principled ways. Neuroscience research cannot tell educators what to do: It is descriptive rather than prescriptive (Christodoulou and Gaab, 2009). Neuroscience studies alone cannot account for the complexity of either the classroom, learning and development, or teacher-student interactions in context. Rather, as educators construct their knowledge in complex ways, the integrated understanding across multiple perspectives that underlies expertise (Lehmann et al., 2020, p. 905; Wilke and Losh, 2012, p. 222) may be informed—at limited levels of analysis—by the perspective of neuroscience. As illustrated in Figure 5, neurobiological factors are but one of many influences on learning and development and they both mediate and are mediated by other factors at different levels of analysis.
In order to better understand neuroscience research evidence from studies with children and adolescents and how it might be integrated across different (limited) levels of analysis, it is important to first understand the neuroscience methods used in the research studies that generate the evidence. At the same time as this methodological knowledge is built, it is important to remember that neuroscience represents just one small piece of the breathtaking complexity of learning and development (Cantor et al., 2019; Osher et al., 2020) and provides just one of many possible kinds of interdisciplinary evidence that might be incorporated into our knowledge base to inform models of learning, development, and teaching.
3 Select Human Developmental Neuroscience Methods: How They Work
3.1 Magnetic Resonance Imaging (MRI)
MRI machines are used to create the structural images that are the result of an MRI scan (see Figure 6). An MRI machine creates a strong and uniform magnetic field. The strength of the magnetic field is measured in Tesla (T). A 3T MRI machine is stronger than a 1.5T MRI machine. The stronger the magnet,
An MRI machine (Source: National Institute of Mental Health, National Institutes of Health, US Department of Health and Human Services, https://commons.wikimedia.org/wiki/File:MRI_machine_with_patient_(23423505123).jpg, public domain)
A structural MRI scan of a human brain (Source: DrOONeil, https://commons.wikimedia.org/wiki/File:FMRI_Brain_Scan.jpg, CC BY-SA 3.0)
Although structural neural data can be useful, it is crucially important not to infer function based on structure (Bruer, 2002). For example, researchers have reported that adolescents who recalled experiencing severe stress in early childhood had smaller hippocampal volumes, as measured by MRI scans, than those who recalled having less stress in early childhood (Humphreys et al., 2019). The hippocampus is a brain structure deep within each temporal lobe, one in the left hemisphere and one in the right hemisphere. Functionally, the hippocampus is involved in learning and memory processes (Eichenbaum, 2004). Given the function of the hippocampus, this structural difference (smaller size in the more stressed group) seems like a potentially concerning finding. However, the researchers did not report any functional neural data in this study, nor did they report any behavioral data. So, we do not know if
In addition, this was a retrospective study in which the adolescents (and their parents) were asked to recall previous stressful life experiences in early childhood, but these recollections were elicited and the MRI scans of the hippocampi were taken years later when the participants were adolescents. Thus, because of its design, this study can provide only an association (a correlation) between hippocampal size and stressful early life experiences—not a causal connection. That is, based on these data alone, we cannot say that more severe early life stress caused smaller hippocampal volumes in these adolescents. Similarly, we cannot say that these adolescents had smaller hippocampi as children, which caused them to experience more stress. The evidence suggests only an association; we can neither draw causal conclusions nor assume the nature of the association nor rule out the influence of a third variable.
3.2
DTI is an MRI technique that focuses on structural fiber tracts in the brain (Le Bihan et al., 2001). These fiber tracts are the axons of neurons (refer to Figure 4), which are referred to as the white matter of the brain. They are called white matter because they are wrapped with a whitish, fatty substance called myelin (which is actually a type of glial cell called an oligodendrocyte). Axons that are wrapped with myelin—myelinated axons—conduct electrical signals more quickly and efficiently than unmyelinated axons. In addition, water molecules tend to move (diffuse) along the direction of myelinated axons rather than across them (this directional diffusion of water molecules is called anisotropy). You can observe a similar effect if you put the end of a piece of string into a cup of water: The water moves up along the string, not across it. DTI provides a measure of anisotropy, and thus a way to chart myelinated fiber tracts in the brain. That is, this method provides a kind of map of how neuronal axons reach out to make synaptic connections with other neurons across short and long distances in the brain and thus create neural networks. In DTI images (see Figure 8), the fiber tracts are color-coded according to conventions related to their orientation in the brain. DTI can thus provide information about
DTI measurement of the human brain. (Source: Thomas Schultz, https://commons.wikimedia.org/wiki/File:DTI-sagittal-fibers.jpg, CC BY-SA 3.0)
The structural organization of the human brain in terms of multiple, distributed, interconnected neural networks changes with development across childhood and adolescence in response to both genetics and environmental input (Tau and Peterson, 2010). For example, a recent DTI study investigated the relationship between childhood environment in terms of socioeconomic status (SES) and connectomics across the whole brain in children ages 6 to 12 in the United Kingdom (Johnson et al., 2021). The authors reported widespread, global effects of SES on the structural connectome, consistent with previous findings indicating that the environment influences brain structure (Johnson et al., 2021). The researchers also found that the structural connectome measures mediated the relationship between SES and cognitive ability as measured by standardized reasoning and vocabulary tests (Johnson et al., 2021); that is, these structural differences were related to functional differences in cognitive processing.
3.3 Functional Magnetic Resonance Imaging (fMRI)
fMRI data can also be recorded in an MRI machine (refer to Figure 6), with extra equipment that allows for the measurement of function in addition to structure. An MRI machine (also referred to as a magnet) with adequate power for structural and functional neural research costs multiple millions of US dollars.
Many neuroscience studies with children and adolescents use the fMRI method. In particular, they use a kind of fMRI called blood-oxygenation-level-dependent (BOLD) fMRI. Recall that neurons that are more active use more oxygen from the blood. BOLD fMRI tracks levels of oxygen in the blood. Brain areas that have a high ratio of blood-with-oxygen (oxygenated blood) and blood-without-oxygen (deoxygenated blood) are areas in which the neurons are most active. Blood flows into the areas with lots of oxygen, the neurons use it, then blood flows out of the areas with little oxygen. Thus, with the BOLD fMRI method, brain activity is not measured directly. Instead, neural activity is inferred by the degree of use of oxygen from blood flowing through different areas of the brain.
In studies that use neuroscience methods that depend on blood flow (like fMRI or positron emission tomography, PET), researchers must use both a control condition and an experimental condition. The experimental condition is what the researchers are most interested in. For instance, in a study of word reading, the experimental condition might involve having the participant read
Most neuroscience studies based on blood flow measures do not publish the images recorded during the control condition and the images recorded during the experimental condition separately. If they did, what we would see—over and over again—is that the whole brain is active in both conditions (see Figure 9A, in which the experimental condition is labeled task state and the control condition is labeled control state) (Raichle, 1994). In these PET images,
(A) Blood flow information showing that the whole brain is active in both the experimental (task state) and control conditions. (B) The subtraction image (far right) highlighting the differences in activation patterns between the two conditions. Used with the kind permission of the author (from Raichle, 1994, p. 62)
This overall widespread activity may be surprising to you because many people have the mistaken belief (or believe the neuromyth) that we use only some small percentage of our brains (e.g., 10%) (OECD, 2007). This is not the case. In part, this neuromyth might be based on the fact that we rarely get to see the actual data from the experimental condition and the control condition in studies that use blood flow measures like fMRI, PET (as in the images in Figure 9), or functional near infrared spectroscopy (fNIRS). Instead, we usually see images that are the subtraction (or difference) between the two conditions (see Figure 9B). The subtraction data analysis method, which is common, highlights the differences between the two conditions. It lets us know, for example, which areas of the brain are more involved in reading real words in comparison to looking at strings of the same letters (rearranged) that are not words. The areas we see colored are areas that were statistically significantly more active (e.g., had higher ratios of oxygenated to deoxygenated blood in BOLD fMRI studies) in one condition than in the other according to analyses using p values. But the images created in the subtraction also make it easy to forget that all of the other regions of the brain that are not colored showed a similar level of activity (statistically insignificant differences by p value) across both conditions.
Something else that we rarely get to see in published neuroimaging studies are the data from each of the individual participants in the study. In typical data analyses, the subtraction of the blood flow information in the control condition from the blood flow information in the experimental condition is done for each participant, and the resulting subtraction (difference) images are then averaged together across all of the participants (see Figure 10). The final picture that we typically see in published studies is the averaged (or mean difference) image. Thus, the individual differences that may be of most interest to educators can be lost in some of the analysis methods used in neuroscience, which often depend more on groups than individuals.
In addition, the mean difference image may not accurately represent any individual because it is an average across all participants in the study. For example, in Figure 10, the first participant on the top row shows greater activation in the experimental condition than the control condition (areas colored white and red) in a region on the left side of the brain, the second shows greater activation on the right, the third on the left, the fourth relatively balanced on the left and right, and the fifth greater activation on the right. The mean difference image on the bottom row—the result of mathematically averaging all of the images in the top row together—suggests bilateral (relatively equal on
In data analyses, difference images for each individual (created by subtracting the control state from the task state activation pattern; top row) are averaged to create the mean difference image (bottom row) typically seen in a published article. Used with the kind permission of the author (Raichle, 1994, p. 62)
So, when you are looking at an image from an fMRI study, the colors superimposed on the structural MRI scan are an indication of which brain areas were statistically more active (as reflected by greater use of oxygen from the blood) in the experimental condition as compared to the control condition on average across all of the participants in the study. For example, Figure 11 illustrates which neural regions were statistically more active when participants were listening to normal speech as compared to listening to speech played backwards, on average, across 20 children ages 6 to 10 (Charbonnier et al., 2020).
It is important to understand what you are looking at and where an image came from in a neuroscience study if you want to incorporate neuroscience findings into your knowledge base on learning and development. Even then, how to use such neuroscience findings in education is not obvious. This has been called the horizontal problem in discussions about neuroscience and education (Willingham, 2009). Knowing that there is a specific neural region supporting a specific cognitive function does not tell us anything about how to design instruction for that function (Varma et al., 2008). In our example above, there is a region of the brain that is selectively more active when reading real words as compared to meaningless letter strings. So what? It is essential to recognize that this finding becomes useful to educators only in the context of
An image from an fMRI study showing which brain areas were statistically more active when children were listening to normal speech as compared to backward speech (Source: © Charbonnier et al., 2020. A functional magnetic resonance imaging approach for language laterality assessment in young children, Fig. 2 [modified to one condition], https://www.frontiersin.org/articles/10.3389/fped.2020.587593/full, CC BY 4.0)
For example, we know that learning to read in alphabetic languages involves mapping the sounds of spoken language (such as the sound that the letter b makes) to the letters on the page (to the printed letter b) (Adams, 1990). We also know that the phonics method of teaching reading, which emphasizes the mappings between letters and sounds, is part of evidence-based practice in teaching reading (National Institute of Child Health and Human Development, 2000). How does the neural word reading area finding fit into this established, research-based picture? It turns out that age 6, nonreading kindergarten children do not show activation in this region, but after being taught letter-sound correspondences for just a few hours do begin to show activation in this region when looking at words (as compared to strings of symbols)—even though they cannot yet read the words (Brem et al., 2010). In another fMRI study, as letter-sound correspondence knowledge and reading speed increased during the first months of reading acquisition (through classroom education), emerging specialized processing for words in this region also increased (Dehaene-Lambertz et al., 2018). This evidence indicates an association between educational practices (teaching and learning letter-sound correspondences in alphabetic languages during learning to read) and neural changes (developing specialization for word processing in this region). In the context of behavioral, cognitive,
3.4 Resting-State Functional Connectivity MRI (rs-fcMRI)
rs-fcMRI is based on the BOLD fMRI method, but without task and control conditions and with different data analysis approaches (Matthews and Fair, 2015; Vogel et al., 2010). As the name suggests, it is a measure of functional connectivity between brain areas when the participant is at rest (not being asked to perform a specific task). In other words, rs-fcMRI is a method that measures how activity in various regions of the brain is coordinated when a participant is not engaged in an explicit task. Thus, rs-fcMRI can provide a measure of the functional connectome (similar to DTI providing a measure of the structural connectome). This method has revealed that intrinsic (not related to a task) brain activity is functionally organized; that is, that regions of the brain are active in synchrony even when there is no specific task to perform. Whereas fMRI can be used to track development in task-related neural processing within specific brain regions, rs-fcMRI can be used to track development in non-task-related interactions between brain regions. Therefore, this method revealing co-activity among brain areas can provide insight into “the development of the brain’s functional network architecture” (Vogel et al., 2010, p. 362). For example, interactions between neural regions tend to shift from being more local and short-range in children to becoming more distant and long-range in young adults (Vogel et al., 2010); different brain regions are constantly in communication, forming and re-forming networks, across development.
One of these networks that has captured the interest of educators is the default mode network (DMN) (Hodges and Wilkins, 2015), an organized network of brain regions that co-activate during non-goal-directed behaviors (Raichle, 2015; Raichle et al., 2001), such as when at rest in an MRI scanner. Based primarily on studies conducted with adults, the DMN is thought to “support cognition that is independent of immediate perceptual input”, such as more introspective, self-referential, internal forms of cognition like imagining the future, recall of personal memories, or the perspective-taking required to understand another person’s beliefs (Immordino-Yang, 2016; Konishi et al., 2015, p. 1). However, in a study with children ages 7 to 9 and adults using rs-fcMRI, the regions involved in the DMN were only sparsely connected in children in comparison to their more cohesive integration into a coherent network in adults, suggesting significant change in the construction of the DMN across developmental time (Fair et al., 2008). Given that, behaviorally, children ages 7 to 9 do have introspective abilities like recall of personal memories or perspective-taking related to theory of mind, this calls into question the developmental nature of the DMN (Fair et al., 2008), as well as the appropriateness of
3.5 Electroencephalography (EEG) and Event-Related Potentials (ERPs)
EEG and ERPs, in contrast to fMRI, are methods that involve direct recordings of neural activity (Luck, 2005). When neurons are active, they create tiny electrical fields. When enough neurons are active at the same time and are oriented in the same way, the summary electrical signal can be strong enough to be recorded by electrodes placed on the scalp noninvasively (see Figure 12). Not all areas of the brain have neurons aligned in such a way that their activity can be recorded at the scalp, so EEG and ERP methods cannot be used to record from the entire brain. The equipment for recording and analyzing EEG and ERP data is appreciably less expensive (less than $US 100,000) than for fMRI research.
Whereas fMRI is good at revealing where information is being processed in the brain (has good spatial resolution), EEGs and ERPs are good at revealing the timing of information processing in the brain (have good temporal resolution). Because the brain is essentially a volume conductor, it can be difficult
An adult research participant wearing an EEG recording cap with electrodes. (Source: Chris Hope, https://commons.wikimedia.org/wiki/File:EEG_Recording_Cap.jpg, CC BY 2.0)
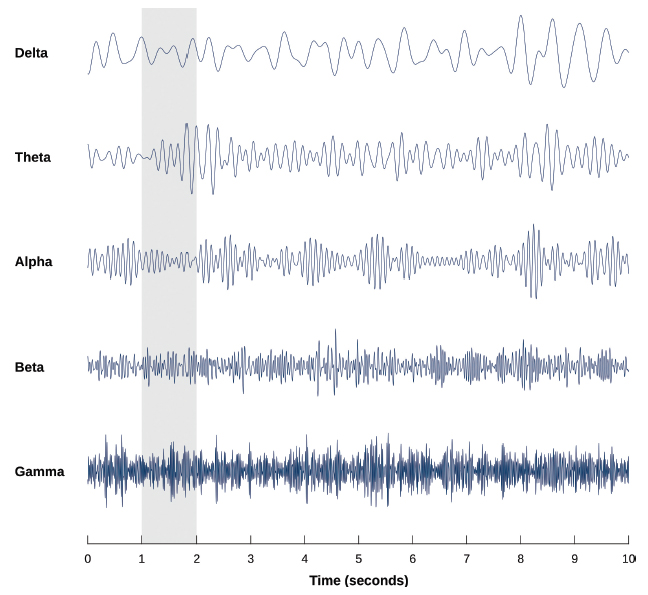
The EEG is a continuous recording of all of the electrical activity that is recordable at the scalp. It is commonly analyzed in terms of frequency bands (see Figure 13). The frequency bands indicate the overall state of awareness and engagement of the participant. For example, prominent beta waves indicate awake and alert whereas prominent delta waves indicate deep sleep. EEG can also be analyzed in terms of coherence, a measure of the degree to which brain waves recorded at various electrodes placed across the scalp of an individual are in synchrony. Somewhat similarly to rs-fcMRI, this reveals information about functional connectivity in networks of neurons. Recently, researchers have considered a new way to use EEG coherence: investigating how much EEG recorded from different students in the same classroom and EEG recorded from the teacher in that classroom are in synchrony (Bevilacqua et al., 2019; Dikker et al., 2017).
The ERP, which is a derivative of the EEG, is more commonly used in cognitive and affective studies. ERPs reflect how a participant’s brain processes specific types of information (not just overall state of arousal). An ERP is created by recording EEG from electrodes placed on the scalp and presenting numerous instances (often from 50 to hundreds) of a stimulus type or types. As illustrated in simplified form in Figure 14, the portions of EEG that occurred just as each stimulus type was being presented are then averaged together (Hillyard and Kutas, 1983). In that mathematical averaging process, the relatively consistent electrical activity in response to a stimulus type is strengthened. In contrast, the other electrical activity unrelated to processing the stimulus type is weakened, and eventually averages to zero because it is random with respect to stimulus presentation. So, what emerges from the averaging process is the brain’s response to a given stimulus type, or, put another way, the electrical potential related to a specific kind of event: the ERP waveform.
An illustration of the frequency bands of the EEG (Source: Laurens R. Krol, https://commons.wikimedia.org/wiki/File:EEG_Brainwaves.svg, public domain)
Deriving the event-related potential (ERP) from the electroencephalogram (EEG). In this example, two auditory stimuli (indicated by the black bell and the gray bell) are presented multiple times as the EEG is recorded (top panel). After the participant leaves the lab, the portions of EEG that occurred just as each black bell sound was presented are averaged together and the portions of EEG that occurred just as each gray bell sound was presented are averaged together (middle panel). What emerges are the auditory ERPs to the black bell and gray bell sounds (the neural electrical potentials specifically related to each type of sound event; bottom panel). Each of the peaks and valleys in the ERP waveform is related to a specific type of processing. Beta EEG (in blue, top and middle panels) (Source: Hugo Gamboa, https://commons.wikimedia.org/wiki/File:Eeg_beta.svg, CC BY-SA 3.0; ERP waveform [bottom panel]; Mononomic, https://commons.wikimedia.org/wiki/File:ComponentsofERP.svg, CC BY-SA 3.0 [gray trace added])
4
Brain images, particularly those based on blood flow measures such as fMRI (see Figure 15), can be fascinating and persuasive. Some studies have shown that people find results that include brain images (as compared to those
Another example of an image from an fMRI study. Recall that the color indicates areas with statistically significant differences in activation between conditions, plotted on top of the structural MRI image (Source: https://wikieducator.org/images/8/84/CNX_Psych_03_04_fMRI.jpg)
5 Ecological Validity
Early attempts to connect neuroscience and education often depended on the findings of cellular neuroscience studies with nonhuman animals (Bruer, 1997). For example, a series of studies with rats showed that young rats raised in
Overall, extrapolating from neuroscience studies with rats to child development and learning in classrooms sorely lacks ecological validity. Ecological validity means that the research was conducted in a way such that it is more likely to generalize to real-life settings. Indeed, this kind of neuroscience research seems unlikely to directly contribute anything specifically useful to real-life educational practice. Although we may not agree on the goals of education, we can probably agree that having children run mazes faster is not one of them. Often ostensibly based on such neuroscience research, there is a great temptation to declare that “the brain learns” in certain ways and to enumerate three or eight or ten grand principles about “how the brain learns” that every teacher must know—even though the referenced research does not involve instructional strategies or curricula (never mind children) in any way (if any neuroscience literature is even referenced at all to support the claims). There is not one best way to teach, nor one best way to learn (Daniel and Poole, 2009). Learning is contextualized and dynamic and involves multiple processes and
Although perhaps not as acute, but along the same lines, caution should be taken in extrapolating from findings from neuroscience studies with young adult participants to applications with young children (e.g., as discussed regarding rs-fcMRI studies of the DMN). Moreover, most studies with young adults are conducted with university students. This is a select group of the population, and a group that has had extensive experiences with classroom learning. Practice with learning over more than a dozen years likely has some effects. It may not be legitimate to assume that learning in a 19-year-old university student is the same as learning in a 9-year-old or fourth-grade student. Indeed, from a developmental perspective, it is not that sensible to assume that very much processing is identical in a 9-year-old and a 19-year-old except at the broadest levels of analysis: Development is, by definition, a process of change over time. Furthermore, most research studies (an estimated 80%) are conducted in Western, educated, industrialized, rich, and democratic societies (who represent only an estimated 12% of the world’s population); findings from such studies may not be representative of other human populations and contexts (American Psychological Association, 2010; Henrich et al., 2010).
Related to these issues of ecological validity, most neuroscience studies involve a very small number of participants (around 20 is not unusual, and studies with fewer participants have been published in peer-reviewed journals), so basic generalizability of the findings is limited. However, some databases include developmental neuroimaging data as well as data from other levels of analysis (e.g., genetic, neuropsychiatric testing, and standardized test data) from the same participants, numbering in the hundreds or even thousands. For example, the Generation R Study in the Netherlands (White et al., 2013); the developmental segment of the Chinese Color Nest Project: Growing Up in China (Dong et al., 2020; Yang et al., 2017); and the Child Psychiatry Branch of the National Institute of Mental Health study (Giedd et al., 2015), Philadelphia Neurodevelopmental Cohort study (Satterthwaite et al., 2016), Pediatric Imaging, Neurocognition, and Genetics (PING) study (Jernigan et al., 2016), Lifespan Human Connectome Project in Development (HCP-D) study (Somerville et al., 2018), and the Adolescent Brain Cognitive Development (ABCD) study (Casey et al., 2018) in the United States. For instance, ABCD is a multi-site study involving about 12,000 children ages 9 to 10 whose biological
When considering the ecological validity of neuroscience research in relation to education, as with any other research, it is also important to take into account the culture and values of education. Even if we had a neuroscience method that was completely accurate in showing us when some kind of information had been learned—for example, if we had a “neural signature” of learning for a mathematical concept—it seems unlikely that it would be of value on its own. First, if we did find this neural signature in a child but the child could not explain the mathematical concept to us in a way that revealed understanding, we would likely discount the neural evidence as an invalid indicator of learning and depend on the behavioral evidence. Second, even if it were valid, it is both unlikely and impractical that we would put every child in a magnet in order to see if we could find this neural signature as a form of assessment. This is because, currently, we value the behavioral level of analysis for learning in education (Bowers, 2016) (refer to Figure 5). If there is a conflict between evidence sources, educators will most likely believe and act on what the child in front of them is saying and doing rather than the results of a brain scan.
Finally, because of the nature of neuroscience methods, most neuroscience studies are conducted in the controlled environment of a research laboratory. It is currently impossible to bring a magnet to a primary school, and even though EEG studies can be conducted in a classroom (Bevilacqua et al., 2019; Davidesco et al., 2021; Dikker et al., 2017), interactions while wearing caps with electrodes and wires on your head are not necessarily normal. Although we are vitally interested in the complexity of classroom learning as educators, neuroscience research (like most empirical research) requires control of