Abstract
In the quantitative, macro-oriented triple helix literature, synergy is measured indirectly, through patent data, firm data and other secondary statistical sources. These macro-level quantitative studies do not open up for understanding how different processes of cooperation create different outcomes, in terms of synergies. This article presents an alternative method of measuring quantitatively how different networks of innovation in a variety of ways create different types of complex synergies. This opens up for an empirical analysis of variations of synergy formation, seen as innovation networks with different structures, formed within and between helices, regions and geographical levels. Data was collected through a snapshot survey in 10 regional cases in the Baltic Sea Region. The analysis presents how different networks of innovation within and between helices are formed by different combinations of expectations, experiences and gaps.
Arabic
Chinese
Seija Virkkala and Åge Mariussen
French
Réseaux d’innovation : Mesurer la structure et la dynamique entre et au sein des hélices, des régions et des niveaux spatiaux : preuves empiriques de la Région de la Mer Baltique
Résumé
Dans la littérature quantitative et macro-orientée Triple Hélice, la synergie est mesurée indirectement par les données sur les brevets ou les entreprises et d’autres sources secondaires de statistiques. Ces études quantitatives au niveau macro ne permettent pas de comprendre comment différents processus de coopération créent des résultats différents, en termes de synergie. Cet article présente une méthode alternative pour mesurer quantitativement comment différents réseaux d’innovation à travers différents moyens créent différents types de synergies complexes. Cela conduit à une analyse empirique des variations de la formation de la synergie, vue comme des réseaux d’innovation avec des structures différentes, formés au sein et entre les hélices, les régions et les niveaux géographiques. Les données ont été collectées grâce à une enquête instantanée dans 10 unités administratives de la Région de la Mer Baltique. L’analyse se focalise sur comment sont formés différents réseaux d’innovation au sein et entre les hélices par diverses combinaisons d’attentes, d’expériences et d’écarts.
Mots-clés
Mesures d’hélices – réseau d’innovation – synergie – connectivité – région de la mer Baltique – Luhmann
Portuguese
Redes de inovação: Estrutura e dinâmica de medição entre e dentro de hélices, regiões e níveis espaciais. Evidência empírica da região do Mar Báltico
Resumo
Na literatura quantitativa e macro-orientada da hélice tripla, a sinergia é medida indiretamente, por meio de dados de patentes, dados de empresas e outras fontes estatísticas secundárias. Esses estudos quantitativos em nível macro não permitem compreender como diferentes processos de cooperação geram diferentes resultados, em termos de sinergias. Este artigo apresenta um método alternativo de medir quantitativamente como diferentes redes de inovação de várias maneiras criam diferentes tipos de sinergias complexas. Isso abre para uma análise empírica das variações da formação de sinergias, vistas como redes de inovação com diferentes estruturas, formadas dentro e entre hélices, regiões e níveis geográficos. Os dados foram coletados por meio de uma pesquisa instantânea em 10 casos regionais na região do Mar Báltico. A análise apresenta como diferentes redes de inovação dentro e entre hélices são formadas por diferentes combinações de expectativas, experiências e lacunas.
Palavras-chave
Região do Mar Báltico – Conectividade – Medidas de hélices – Rede de inovação – Luhmann – Sinergia
Russian
Spanish
Redes de innovación: estructura y dinámica de medición entre y dentro de hélices, regiones y niveles espaciales. Evidencia empírica de la región del mar Báltico
Resumen
En la literatura de triple hélice cuantitativa y macro-orientada, la sinergia se mide indirectamente, a través de datos de patentes, datos de empresas y otras fuentes estadísticas secundarias. Estos estudios cuantitativos a nivel macro no permiten comprender cómo los diferentes procesos de cooperación generan diferentes resultados, en términos de sinergias. Este artículo presenta un método alternativo para medir cuantitativamente cómo diferentes redes de innovación en una variedad de formas crean diferentes tipos de sinergias complejas. Esto abre para un análisis empírico de variaciones en la formación de sinergias, vistas como redes de innovación con diferentes estructuras, formadas dentro y entre hélices, regiones y niveles geográficos. Los datos se recopilaron mediante una encuesta instantánea en 10 casos regionales en la región del mar Báltico. El análisis presenta cómo las diferentes redes de innovación dentro y entre hélices están formadas por diferentes combinaciones de expectativas, experiencias y brechas.
Palabras clave
Región del Mar Báltico – Conectividad – Mediciones de hélices – Red de innovación – Luhmann – Sinergia
1 Introduction
The article responds to the call by Cai and Etzkowitz (2020) for new methodological approaches in understanding helix dynamics, as well as Meyer et al. (2014: 170):
more enriched indicators that are multilayered and multi-dimensional are required to unpick the situation from different and differing angles, thus allowing for the heterogeneity of the different actors to be voiced and heard.
State of the art studies use qualitative case-studies and quantitative analysis of secondary macro-level statistical sources, such as patents, co-authorships, citation indexes etc. to build analysis of synergy indicators between helices (Leydesdorff and Etzkowitz, 1998; Leydesdorff et al., 2017b; Meyer et al., 2014). Synergy means interaction giving rise to a whole that is greater than the simple sum of its parts (see section 2). We suspect that there are important synergies which are not captured by secondary macro-level data.
Our research questions are:
How can we build indicators which measures synergies within and between helices in innovation networks through primary data collected from informants participating in these processes? What can we learn from this approach?
The approach presented in this article use primary micro-level data which was collected in our studies of connectivity between organizations within and between helices in selected regions. Connectivity analysis has been developed since 2013 (Virkkala et al., 2014, Virkkala et al., 2017; Mäenpää, 2020) in the context of a regional innovation development policy called Smart Specialization Strategy. It has been developed both as an analytical approach and as policy model, originally in cooperation with regional development authorities in Ostrobothnia, Finland. Connectivity between actors, measured through expectations, experiences and importance is an important feature in the approach, which has been used in analyzing both triple helix (TH) (Mäenpää, 2020) and quadruple helix (QH) arrangements (Mariussen et al., 2019; Vilkė et al., 2020; Gedminaitė-Raudonė et al., forthcoming 2021). We are now applying these data on analysis of synergies.
Our data is a snapshot of one point in time based on stratified samples of actors, collected from 167 informants in 10 different regions and different industrial sectors and clusters around the Baltic Sea Region (BSR). Our informants are a variety of actors in different helices. Based on these variations, we argue that our data captures core aspects of the dynamic where expectations and experiences create and shape perceptions of importance, indicating synergies within and between helices in innovation networks.
Our analysis is related to and draw upon Niklas Luhmann’s analysis of how social systems emerge through creation and protection of expectations (for a comparison of our approach and Luhmann, see section 3.2).
By using individual-level primary data this article explores how the dynamic (or functions) between expectation, experience and importance resulting in synergies is different in different helices. In this article, the notion of synergy and connectivity are used as synonymous. The article documents differences between helices in the perceptions of the importance of relations to other helices, as well as in the ability to overcome gaps between expectations and experiences.
There are variations in synergies (connectivity) between regions, and variations between organizations within regions. Synergies (measured as importance) at regional, national and international levels are cumulative.
The next section presents the state of the art of measuring helix synergies. After that we present the background of connectivity analysis. The fourth section describes the data and method, and the fifth section our findings on synergy measurement in innovation networks. The relevance of our analysis for synergy measurements is discussed in the next section, and the final section concludes the article.
2 State-of-the-Art of Helix Measurement
2.1 Triple Helix and Quadruple Helix Models
The concept of knowledge-based society emphasizes the role of science and universities in innovation processes and networks (Etzkowitz and Leydesdorff, 2000; Etzkowitz, 2003). The core of the TH model developed by Etzkowitz and Leydesdorff (Etzkowitz and Leydesdorff, 2000; Leydesdorff and Etzkowitz, 1998) is the dynamic in arrangements of university-industry-government relations at regional, national and international levels. (Etzkowitz, 2003; Etzkowitz and Zhou, 2017). The synergy between the helices strive to create a process of self-reinforcement for innovation and economic development (Galvao et al., 2019). The TH model focuses on the societal conditions of knowledge-based society and innovation, which can be enhanced in interaction between university, industry and government. This capacity can be described with the notion of “Innovation in Innovation” (Etzkowitz, 2003; Cai and Etzkowitz, 2020). The potential of knowledge-base can be realized in different mechanisms like start-up support or technology transfer. (Etzkowitz and Zhou, 2017).
TH arrangements consist of several key characteristics, which are components (institutional spheres), functions (processes within spaces), and relationships (networking within and among helices), (Ranga and Etzkowitz, 2013). The TH model is used to describe dynamic interaction between these institutional spheres (universities, firms and public organizations). They have different selection environments (Leydesdorff and Meyer, 2006) or functions: Universities’ activities are based on novelty production, on discovery of technological opportunities and they act as a globalising force. Firms aim at wealth generation and operate in markets. Public organisations’ activities are based on normative control, established rules and have a stabilizing effect. The helices provide a selective force (Ranga and Etzkowitz, 2013) and follow different codes of conduct. Universities, as scientific systems, communicate and function in accordance with the code of true/false, business in accordance with the code of profit/loss, and the public sector in accordance with the code of right/wrong. This article is focusing on networking of helix actors as self-organising innovation network.
According to the TH model, the best environments for innovation are created at the intersection of the helices, where different types of knowledge and institutional logics intermingle. The non-linear interactions between the helices can generate new combinations of knowledge and resources that can advance innovation. (Ranga and Etzkowitz, 2013; Etzkowitz and Zhou, 2017). At these intersections the boundary walls may be transformed into “boundary spaces” and new formats for interaction are invented, drawing from different spheres (Champenois and Etzkowitz, 2018; Cai and Etzkowitz, 2020). In the TH literature (Etzkowitz and Leydesdorff, 2000) this ideal situation on overlapping functions is called balanced model contrary to the model in which the state controls business and universities or laissez faire model with separate institutional spheres with strong boundaries.
In the TH model the potential source for innovation is the situation when the helices “take the role of the other” (Etzkowitz, 2008), carrying out new roles from the other helices in addition to their traditional functions. For instance, firms continue to produce goods and services, but also do research and development. The government is responsible for public policies and establishing market rules, but it can also involve in business for instance making available venture capital to start new enterprises.
According to Leydesdorff and Etzkowitz (2003) the three helices “represented specialization and codification in function systems which evolve from and within society”, so society was broadly represented by the three helices. However, TH model has been criticized of neglecting the civic engagement, and the quadruple helix (QH) approach was developed as an extension of the TH model, adding civil society as forth helix. According to the QH approach, actors of science, industry, and governments should interact together with citizens to promote knowledge co-creation. (Carayannis and Campbell, 2012; Höglund and Linton, 2018). The forth helix consists of consumers and innovation users (Arnkil et al., 2010), non-governmental organizations (Lindberg et al., 2014), non-profit organizations representing citizens, businesses and workers (Gianelle et al., 2016), as well as community (Nordberg et al., 2020). However, there are many definitions for the forth helix.
The cooperation between QH actors creates more opportunities for innovative interaction, which can expand the intersection between helices. Individuals in civil society can belong to other spheres in their working life (like teachers, civil servants, businesspeople, or workers) but in civil society, they are representatives of citizens and the fourth helix. In everyday life, they may follow the specific mechanisms of coordination within their helices. (Nordberg et al., 2020)
The QH literature describes the helices as encompassing differing rationales and selection environments. (Borkowska and Osborne, 2018; Carayannis and Campbell, 2012; MacGregor et al., 2010; McAdam et al., 2016). However, the QH approach is often used in a rather abstract way, as a general backdrop to innovation related activities. Some efforts have been made to operationalize the QH approach (Arnkil et al., 2010; Miller et al., 2016). Hasche et al. (2019) argue, that the fourth helix should be viewed as an arena where triple helix actors take on different roles and where they create value to civil society.
2.2 Helix Measurements
In the context of TH arrangements, the notion of synergy means that the helix actors are transcending institutional borders in order to create conditions for innovations. At macro level, synergy can be seen as innovation for innovation (Etzkowitz, 2003). Synergy is needed for self-sustaining growth processes in knowledge and innovation spaces. This article focuses on synergy created by innovation cooperation between helix actors. We use the notions synergy and connectivity between helix actors as synonymous, since the purpose for innovation interaction is to create something new.
Most studies have taken a macro-perspective on helices and helix measurement. Visual presentations have captured the situation in different regions and countries. The overlay of the functions in TH cooperation has been measured with synergy indicators based on quantitative methods and statistical data. Synergy indicators were initiated by Leydesdorff (2003) and Leydesdorff and Meyer (2003) who explained TH dynamics with scientometric measurement. TH indicators have been developed by Leydesdorff and others to measure synergies through correlations in patent data, firm data and other secondary statistical sources, and they have been applied to many geographical contexts like Hungary, Germany, Sweden Russia, China and South Korea (Leydesdorff and Park, 2014). The quantitative measurements like synergy indicators enable the comparison between regions and nations, and give a more accurate understanding on the TH dynamics than just visual expression of TH arrangements.
According to Leydesdorff and Park (2014: 3):
The specification of how the codes operate as selection environments upon one another requires a systems perspective on the distributions of both relations and non-relations in terms of correlations. Specific relations can also be functionally equivalent. The correlations carry the latent functions that can operate synergetically to a varying extent. The synergy is an interaction effect among the distributions: do the functions fit?
The strength of existing TH indicators is that they can be used to document that a given system is not a priori integrated or synergic at a specific level (Leydesdorff and Park, 2014). However, according to the evaluation of 109 articles on synergy indicators, Meyer et al. (2014: 169) wonder that
intriguingly for a research field that scrutinizes interaction between practitioners in academe, industry and government; there is relatively little work that is immediately relevant to TH practitioners. Many of the contributions reviewed are still concerned with capturing, measuring and mapping TH relations and activities and a large share of them are descriptive rather than explanatory in approach. This may not be surprising because the body of work studied is primarily about indicators. Impact on practice may well go beyond the scope of work on indicators. Nevertheless, more applied work would be desirable.
One explanation for the limited concrete relevance of the synergy indicators to the practitioners might be the macro-level approach of the indicators. The latent functions seen in correlations on macro-level might be too abstract to use in practical development activities by the practitioners. (Leydesdorff, 2000, 2018; Leydesdorff and Deakin, 2011). These indicators might not capture individual level innovative actions or specific relationships involving emerging niches or cooperation on innovation. The helix actors can be better taken account in micro-level analysis (McAdam and Debackere, 2018). Recent calls have suggested to research the helix arrangements, synergies, and collaborations from a micro perspective (Höglund and Linton, 2018; Cai and Etzkowitz 2020, Hasche et al., 2019).
The second limitation is the databases and statistics used in calculating the synergy indicators, which are not based on surveys on relationships and innovation cooperation. However, social network theory has been used for analyzing the patterns of interactions among different actors (Pinto, 2017). The starting point is individual actors, and their networking.
The second way to measure helix cooperation is based on qualitative methods and data capturing individual actors. The most common method is case studies on the helix relationships, which can be historical analysis, narratives, and snapshot based on interviews. Synergy between TH helices has been analyzed in comparative case studies: Etzkowitz and Klofsten (2005) analyze the development of University of Linköping as an entrepreneurial university in innovating region compared to the Stanford University and some other universities in the USA. Teräs and Ylinenpää (2012) compare regional dynamics in two non-metropolitan hi-tech clusters: Oulu in Finland and Luleå in Sweden.
This article aims to overcome the limitations of macro-level synergy indicators based on statistical databases with measuring micro-level dynamics as emergence and development of innovation network. We argue that synergy can be measured at the micro level as the individual or system level benefits of cooperation between the helix actors.
3 Theoretical Framework of Connectivity Analysis and Measurement of Helix Synergy
Innovation research has pointed the fact that a major share of innovations arise from interaction between firms as well as between firms and research institutions (Lundvall, 1992). Inter-organizational interaction has played a crucial role in the literature on regional innovation systems and clusters, but the structure of this interaction has not been enough assessed empirically in quantitative terms (Ter Wal and Boschma, 2009).
Cooperation between helix actors within a region promotes synergies between helices, which is improving the innovation capability and the performance of regional economy (Krätke, 2010). However, regional economies operate in an open world and extra-regional and global connections might be equally important for innovation purposes. In regional innovation studies, the interplay between actors’ intra-regional innovation cooperation and extra-regional cooperation has been referred with the phrase ‘local buzz and global pipelines’. (Bathelt et al., 2004). Innovative performance of regional economy might depend on the appropriate combination of cooperation with regional as well as national and global partners. The strengthening only intra-regional networking may lead to regional lock-in (Grabher, 2006; Boschma, 2005), that is why regional networking is often necessary to complement by wider network of national and global linkages.
We apply notions of Luhmann’s theory, which has also inspired the developers of TH model (Leydesdorff, 2008, 2013, 2018). Luhmann’s theory of system has also been applied and developed by organization researchers (Bakken and Hernes, 2003), but not in explaining the structure and dynamics of innovation networks between helix actors, which is the focus of this article. A network between helix actors can be seen as a(n) (second level) organization (see Åkerstrøm Andersen 2008), in which the partner organizations have innovation as a common vision.
We first explain the notions of network theory used in describing the structure of the helix network. Second, we explain the Luhmann’s notions which we use in analyzing the emergence and dynamics of helix networks. However, structure and dynamics are interlinked: structure influences dynamics but is also constituted by the dynamics through the feedback loops of expectations and experiences in the helix network. Third, we clarify how we use the concepts in connectivity analysis.
3.1 Measuring Structure of Helix Networks
The helix actors in a regional innovation ecosystem are becoming increasingly interdependent to each other through different links. We are interested in how innovation networks consisting of different actors within and between helices emerge and develop. Our method is align of neoinstitutional helix approach (Etzkowitz and Ranga, 2011).
In this article we define helix actors in a broad way: To the academia/university helix belong all types of educational and research institutes. Different types of public organizations including municipalities and regional councils are important, not just the government. In the empirical analysis of the article we use QH arrangement approach, and define the forth helix as NGO s representing different interest organizations (trade unions, business organizations) and intermediary organization like cluster organization in innovation system. They can also be environmental organizations, consumer organizations, for instance, in other words, a helix organization.
We define innovation broadly, not only new products, processes, markets or organizations, but also new ways to act. Innovation can occur in all helices, for instance in the form of policy, social or institutional innovation. The broad definition of innovation is important especially in regional development and for policy agents, which develop lagging regions and have no possibility for high-tech innovations.
We follow Ranga and Etzkowitz (2013) by defining the helices as nodes and the relationships between helices as linkages or ties (see Figure 1). The innovation networks consists of helix actors and their cooperation for the purpose of innovation. We are interested in the characteristics of the cooperation: strength and tension between the relations of helix actors. What kind of structure do the helix networks have, and what is the driving force in the networks?

Mapping innovation network. Helices as nodes, the relations between helices as ties
Citation: Triple Helix 8, 2 (2021) ; 10.1163/21971927-bja10019
Source: Mariussen et al. 2019, p. 27We follow the main principles of network analysis, according to which the focus of the study is on linkages between actors; these actors are interdependent; the linkages between the actors are channels for flows or transfer of resources; the actors see the network as their environment, and structure is conceptualized as patterns of relations among actors (Wassermann and Faust, 1994). However, instead of collecting full network data (roster recall methodology), we measure so-called ego-centered networks, which consists of a focal actor, termed ego, as set of alters who have ties to ego, and measurements on the ties among these alters. (Wassermann and Faust, 1994). The egos in this ego-centric networks are helix organizations like universities, public organizations, firms and NGO s.
We approach the structure of a helix network measuring the strength of its relations. Granovetter (1973) has studied the role of strength of relationship in social network, and it has been applied in innovation network analysis (Kauffeld-Monz and Fritsch, 2010). The argument ‘strength of weak ties’ (Granovetter, 1973) for example is based on the premise that strong ties characterize a dense cluster of actors who are all mutually connected to each other with trustful relations. Granovetter posits that new information is obtained through temporary contacts (weak ties) rather than through close personal friends (strong ties). Weak ties are important channels for acquisition of new knowledge for innovation, and strong ties for the long term path of the innovation. We apply the notions of strong and weak ties measuring the importance of relations between helix actors: We interpret strong ties as important relations and weak ties as less important relations.
In this article, the tie between helix actors is a cooperation for innovation. We examine the strength of the innovation cooperation with a specific helix actor with other helix actors with questions referring to its importance. We ask: how important is the other helix organization (universities, public organizations, firms, NGO s) as your innovation partner in scale 1-10, when 0 indicates now importance. (Table 4) One helix actor can have both strong and weak ties with other helix actors, that is: both important and less important innovation partners belonging to different helices. The relationship between helix actors X and Y can be different from the point of view of partner X than that of partner Y. The ego-centric networks can be analyzed in two ways: First, what kind of helix actors (universities, firms, public organizations or NGO s) are important for a specific helix actor, and second, how important this specific helix actor is as an innovation partner for the other helix actors? In empirical analysis of this article, both ways are used.
QH arrangements can vary between different innovation networks: for some of helix actors innovation networks are unimportant, for others universities are very important, etc. The importance of innovation partners reveals the structure of the network; cooperation with many important partners is a more integrated network than network consisting of fewer and less important partners. The more there are highly important relations in the network, the more integrated the network, and vice versa: the less important the relations between helix actors are in the network, the more fragmented is the network. Integrated networks consists of important relations (strong ties) and fragmented networks of less important relations (weak ties).
The importance and the level of integration can be studied with the help of indicators: new analytical variables based on factor analysis, which reveal the degree of integration in an innovation network.
The actors in a regional innovation system cooperate with other actors in the same region but increasingly with those outside the region in the same nation and the regions across national borders. Innovation networks are often open and extended outside the regions. We have mapped the innovation networks of studied regions on three spatial levels: regional, national and international. This means that the respective region’s innovation networks are stretching on national and international levels. The proximity is not only geographical, it can also be social, organizational etc. (Boschma, 2005). The innovation network from a specific respondent consisting of different helix organization can be regional embedded, nationally embedded or global embedded or it can be embedded in all these spatial scales at the same time.
Notions of network analysis in measuring innovation networks
Citation: Triple Helix 8, 2 (2021) ; 10.1163/21971927-bja10019
In this article, we do not measure the change of size or shape of a network through entry and exit of the nodes according to the principle of homology (Wassermann and Faust, 1994; Ter Wal and Boschma, 2009), instead the dynamism of a network is measured studying tensions in the relationships between helix actors. This tension is caused by expectation of the relationship, which may be confirmed and strengthened, or frustrated. The role of expectations driving changes in innovation networks is the application of the social system perspective of Luhmann (1995).
3.2 Measuring Dynamism of Helix Networks – Applying Luhmann’s Theory of Systems
According to Leydesdorff (2013) Niklas Luhmann’s theory of autopoiesis, or self-organising networks is particularly relevant for TH analysis of the dynamics of the emerging, complex knowledge-based society. However, Luhmann (1995) applies autopoiesis as a general theory of society as a social system, with sub-systems, such as economy, policy and science. Systems are constituted by communication within relations provided by synergies. Autopoiesis is the self-organization enabling these processes of communication to form and evolve. Autopoiesis becomes relevant when it can explain communication across the institutionalized boundaries between the helices.
Luhmann defines system by a boundary between the system itself and its environment. Outside the system the world is chaotic. Inside the system, complexity is reduced. Shared meaning is created. System can communicate only with a limited amount of information from the outside. The process of reduction of complexity is made with meaning as the selection criterion. Each system has its own identity. Meaning must be reproduced through decisions of what is excluded and included to the system. The system is emerging when it reflects what is outside and what is inside of its borders. (Mörcol, 2011) This process of self-organization through the creation and reproduction of shared meaning is what Luhmann calls autopoiesis.
When social systems are created through communication around functions like economy, government, law, and science, organizations are the concrete carriers of the functions. Observed through the guiding distinction system/environment, organizations are systems of communication communicating through decisions. As autopoietic systems, organizations create themselves and all their elements through decisions. Function system close around the fact dimension and organizations around the social dimension (+/- membership). (Åkerstrøm Andersen, 2003). TH studies have concern on functions like wealth generation, novelty production, and normative control, but the carriers of these functions are industry, university and government (Leydesdorff and Meyer, 2006), which are organizations like firms, universities and public organizations.
Autopoiesis means reproduction of shared meaning, where exchange of information at one point in time, in one event, may lead to expectations, enabling expectations of expectations, and new exchanges at later events. According to Luhmann, this continuity through time is achieved through observations of expectations and experiences, involving sequences of self-observation, self-reference and self-reflection. These observations have to be recognized by both communication partners. In this way, autopoiesis builds on “multiple constitutions”, or a double contingency which create shared expectations. Expectations may be rewarded and reinforced through feedback loops, positive experiences.
According to Luhmann, events of information exchange build on mutual references to previous events, and self-observations based on expectations. This chain of events, the continuity of the system, is not self-evident. It must be maintained. Complex systems face the dilemma of continuation or disintegration. It can be broken through expectations which are not met. If there is no expectation, there is nothing to build on. Creation and reproduction of expectations feeds a process of differentiation, guided by expectations and experiences. The process of communication grows a closed structure, expectations are selective, directed towards positive experiences, which has expectations of expectations as its function.
We apply the Luhmann’s theory of systems when explaining the emergence of an innovation network from the point of view a helix actor or organization, and in measurements of helix synergy. The helix organizations build systems (innovation network) from the elements of their environment. Formation of autopoiesis through innovation networks outside the borders of own organization means that parts of what used to be environment becomes inside, connecting the organization and its network. This change of the border between what is inside and outside increases complexity, and environments are created in new ways. In our approach, communication refers to innovation cooperation with different helix organizations on three specific spatial levels, regional, national and international. In the first phase of autopoiesis (self-observation), the helix actors ponder what is important for their innovation processes. They may innovate without external relations or rely more or less on external relations. They observe first their own organization and decide whether the innovation process can occur inside their own organization or whether they are searching innovation partners outside the organization. In the second phase of autopoiesis (self-reflection), organizations search innovation partners by matching their own needs with the features of their potential innovation partners. The third phase is the selection of the relevant partners. Having communication with innovation partners, and repeating the communication so that there is reciprocity between the partners, the innovation network is emerging and the organization creates a new environment. There is a broad variability in the scope and depth of this process. Innovation networks can be regional, national and/or international and they can consist of many types of helix organizations, including the organizations of its own helix. In this way, organizations create their own space and spatial levels. Some have more regional innovation space, other national and international, and third ones mixture of spatial levels.
Autopoiesis is a process which may flow in a variety of ways, leading to a broad variety of innovation network integration. Autopoiesis may be locked into a university, a firm, or a government office. Autopoiesis in a helix arrangement does not emerge anywhere. According to Leydesdorff (2013), the process of autopoiesis is primarily important in the complex innovation networks of the emerging knowledge-based economy.
In our view, autopoiesis is the process of structuring (creating, maintaining and changing) the organization and its innovation network. This process creates meaning for the organization and its innovation partners and this occurs through positive feedback loop, which we measure through questions of importance of partners. According to the theory of autopoiesis, these cognitive processes, where shared meaning emerge, are characterized by double contingency, and they are accordingly likely to take a variety of forms, some large and highly integrated, some more fragmented. They create functions: expectations. Expectations describe what an organization can achieve in the innovation cooperation, and experience in what degree the expectations have fulfilled. Experience is the feedback of expectation. Expectations may be rewarded and reinforced through feedback loops, positive experiences. Or expectations may meet experiences below expectations, what we refer to as gaps. Below, we will show how we mapped and measured expectations and experiences of partners in innovation networks. This helped us to identify gaps, tensions in the networks. Through expectation and experience, an organization is building networks of innovation, which creates the system dynamics.
A strong structure consists of many important innovation partners at different spatial levels and in different helices. Structure can be also inside helices, like networks of firms. In this study, we refer the deviation (by Luhmann) as gap between expectation and experience (see Table 2). When expectations are repeated, the structure is repeating the change (and there will be a process of institutionalization).
Applying Luhmann’s systems theory in connectivity analysis
Citation: Triple Helix 8, 2 (2021) ; 10.1163/21971927-bja10019
Luhmann’s theory has also inspired the developers of TH model (Leydesdorff, 2008, 2013, 2018). The theory has also been applied and developed by organization researchers (Bakken and Hernes, 2003), but not in explaining the structure and dynamics of innovation networks between helix actors. A network between helix actors can be seen as an (second level) organization, in which the partner organizations have common vision like innovation (Åkerstrøm Andersen, 2008).
3.3 Summary: Measuring Synergy in Helix Networks with Connectivity Analysis
Cooperation between helix actors creates synergy, which is measured here with the help of variables expectation, experience and importance. The relation between them is not linear. We illustrate the relations with a model (Figure 2), which combines causal relations and feedback loops. The driver of a change in a relationship between two actors is caused by expectations, which may be confirmed and strengthened, or frustrated. High expectations may lead to large frustrations (gaps). Large frustrations provide dynamics, they may lead to destructive consequences, or to an innovative reassessment and improvement of the relation. Similarly, a combination of high expectations and good experiences may lead to strong and stable long-term relations, where partners recognize each other as important.
Creation of synergies: expectation, experience and importance
Citation: Triple Helix 8, 2 (2021) ; 10.1163/21971927-bja10019
The dynamism originated from expectations and experiences creates structure of a network, which in this article is measured as importance of partners in innovation cooperation (Table 1 and Table 3). There is another feedback loop since structure (importance) begins to influence the dynamism of the network (Figure 2). Creation of synergies can be seen as formation of more or less stable expectations, which may be reinforced by positive experiences or challenged by negative experiences (gaps). This leads to perceptions of importance in specific relations. The quantitative analysis of this model is presented in section 5.
According to Leydesdorff et al. (2017a: 5):
From the evolutionary perspective, the analysis of relations is not a purpose but a means to study the potential synergy in new arrangements…. Institutional arrangements evolve because of new options for knowledge production, wealth generation and regulation
In the cases of this article, the potential synergy created in the cooperation with helix actors has been studied in the context of smart specialization strategies of the European Union. The aim has been to create synergy in exploring new fields (business domains) which can be discovered in the cooperation between helix actors (Foray, 2015; Virkkala and Mariussen, 2019). Connectivity analysis has been used as a method to reveal and energize the innovation potential for the purpose of regional entrepreneurial discovery processes (Mariussen et al., 2019; Mäenpää, 2020; Gedminaitė-Raudonė et al., 2021). Better cooperation creates more opportunities for innovation cooperation, which can expand the intersection between helices and form a point of departure for additional entrepreneurial discoveries.
In this article, we do not construct an overall indicator for synergy in a helix network. Instead of building a composite indicator, we aim to build a typology of helix networks across the structure (integration vs. fragmentation) and dynamism (dynamism vs. static). In order to do that synergy is measured with the values of indicators describing structure and dynamism of a helix network, and with the correlations of these values. An indicator (factor) IMPORTANCE was created with the help of factor analysis to reveal the strength of the helix relations and the structure of the helix network. The indicator EXPECTATION describes the dynamism of relationships, and the indicator EXPECTATION the satisfaction or frustration of the expectations. If both are high, the relation is demanding but satisfying. The indicator GAP is a difference between experiences and expectations describing the tensions in relations. A high score in indicator GAP means that the relationship needs more attention. (Table 3)
Indicators describing structure and dynamism of helix networks
Citation: Triple Helix 8, 2 (2021) ; 10.1163/21971927-bja10019
Synergy in an innovation network means that the values of the indicators of importance, expectations, and experiences are correlated. (Figure 2). The synergy is high, when there is high expectations and experiences in important relations of the networks. In this case, the partners are likely to contribute to innovation. Some regions are characterized by high levels of synergy, both inside the region and into wider areas. Other networks are characterized by various forms of gaps between expectations and experiences. Important relations combined with low levels of expectation and experience or big gaps indicate a dynamic and integrated helix network. In these cases there might be potentially harmful relation between helix actors, where a deep gap or a missing relation between helices might disrupt innovation (Gedminaitė-Raudonė et al., 2021). By measuring importance, expectations and gaps, it is possible to identify multi-level spatial mixtures of synergies in helix networks.
4 Research Data and Method
The data is gathered in the project LARS (Learning Among Regions on Smart Specialisation) implementing the INTERREG Baltic Sea Region program 2014–2020. The participants of the project represented regional and national governments, educational and research institutes and NGO s. The data consists of mapping innovation network in ten value chains/clusters in different regions: circular economy in Hamburg, metal cluster in Latvia, bio economy in Lithuania, robotics in Lithuania, wood cluster in Oppland (Norway), energy technology in Ostrobothnia (Finland), ICT and energy in Pomorskie (Poland), grain cluster in Päijät-Häme (Finland) and bio economy in Västerbotten (Sweden). The selected value chains and clusters are important in the regional or national smart specialization strategies of the regions.
The data was gathered though a detailed survey (interviews) in ten cases (regions) in BSR. The interviews were made by the project partners, who were familiar with the selected cluster, sector or value chain. In the first phase, the relevant stakeholders representing helix organizations in the selected sectors, clusters or value chains were selected based on their salience for the cluster (power, urgency and legitimacy defined by Mitchell et al., 1997). The selected informants were representatives of organizations located in different helices.
In the second phase, interviews were conducted using standardized questionnaires in the case regions. The questionnaire measured relationships of respondents with their innovation partners in three spatial levels: own region, own country and international level. (Figure 1). Innovation partner was defined to respondents as any organization, which is important to the innovation activities of the interviewed organization and in which both sides are genuinely interacting with one another. 12 different types of relationships for one respondent were measured. A distinction between four types of possible partners was made based on the QH approach: firms, public organizations, universities, and NGO s, which were non-profit interest organizations and operate on issues regarding business, environment, social security, public policy, education, etc. The relationships were mapped in a quite detailed questionnaire. For instance, the relationships towards universities from other helix actors were mapped based on their functions like research, education and development (see Table 5).
During face-to-face interviews, respondents reported first the importance of their partners by helices and geographical levels (regional, national, international) on a scale from 1–10 (from lowest to highest and using 0 to denote no connection, see Table 4). Second, collaboration was reported in terms of expectations and experiences of the relationships with innovation partner of different helices (Table 5). Expectation means what the cooperation should be in an ideal situation. This was measured with a value from 10 to 1, 10 indicating very high expectations, 1 very low expectations, and 0 = no expectations. Experience means the collaboration in practice which was measured from very good (=10) to very bad (=1) experiences (=1) (Mariussen et al., 2019; Mäenpää, 2020).
Example of a question on structure of a network (based on Virkkala et al. 2014, p. 147 and Mäenpää 2020)
Citation: Triple Helix 8, 2 (2021) ; 10.1163/21971927-bja10019
Example of a question on dynamics of a network (based on Virkkala et al. 2014)
Citation: Triple Helix 8, 2 (2021) ; 10.1163/21971927-bja10019
At least three respondents from each helix was interviewed in every region, which made 13–23 interviews per region. From 167 informants 61 were firms, 36 universities, 38 public organizations and 32 NGO s. Every interviewed responded on his/her organization’s relationships towards innovation partners in all four helices in three different spatial units (regional, national and international). Altogether, it was at least 12 relations per value chain. However, not all interviewed had relationships with partners in all helices and all spatial levels. The values of these relationships (expectation, experience) were treated as zero. The survey was conducted during the years 2018–2019 by the partners of project LARS.
The gained data is quite detailed, since every individual relationship between helix organizations were still differentiated, which resulted in a statistical database more than 100 basic variables. This data and especially gaps between expectations and experiences were verified in the focus group meetings of relevant stakeholders organized by project partners, and the gaps, the problems in connectivity between helices and possible good practices were discussed.
The data consists of relations of 167 respondents. In analysis, we study the relational data on helix actors at different levels: individual, helix specific, spatial, and structural levels. (see also Ranga and Etzkowitz, 2013). We focus on data regarding the importance of partners and data regarding expectations and experiences of relationships. The analysis explores innovation networks and their connectivity with different indicators describing the innovation cooperation between helix organizations. Our framework is based on interactive co-evolution between three variables (see Figure 2), not causal relations between independent and dependent variables which is analyzed through regression analysis. In the analysis, we use mostly factor analysis, correlation analysis and scatter diagrams. We illustrate the connections also with plot diagrams and cubic diagrams (see Table 6).
Research methodology and process
Citation: Triple Helix 8, 2 (2021) ; 10.1163/21971927-bja10019
We expect that our respondents have given replies, which are more or less based on unique, individual circumstances. As we will see below, this generates a lot of variation. Looking across these individual variations, it is possible to discover deeper patterns where general factors, that are shaping innovation networks, come into play. The scales of new variables generated from many variables by factor analysis results in comparisons between respondents along a new analytical variable where the average is 0. An indicator (factor) IMPORTANCE was created to reveal the strength of the helix relations, and the degree of integration in the network. Further indicators (factors) were developed based on importance of different spatial levels, different helices and cases. The indicators EXPECTATION, EXPERIENCE and GAP as difference between experience and expectation were also created. Some relations are important with high expectations and equally high experiences (close to 10), and some are less important with low expectations and experiences (close to 1).
The data has also limitations, since it is based only on 167 interviews, and some helices in the researched regions and value chains are represented only for three interviews. Second, the values are based on subjective evaluations of the interviewees regarding expectations and experiences of the relationships and importance of innovation partners. However, it was tried to guide the interviewers to use common scales. Third, the use of means reduces the variation but this limitation was approached by adding scatter diagrams to see the variations in the data.
5 Findings
The innovation network of a helix organization has emerged through a process what Luhmann refers to as self-observation and self-reference (measured through expectations, experiences and gaps), and system closure or selection of important innovation partners (measured through importance).
The network consists of partners at different spatial levels and in different helices, which are described in the first section. We examine how important different helices and geographical levels in innovation processes actually are, having in mind that the cases are selected as existing or emerging specializations in the regions. Second section examines the dynamics of innovation networks, and the connections between structure (importance), expectations and gaps. We analyse the responses of interviewees on importance of helix specific relationships and expectations with the help of correlation analysis (scatter diagram). Third section compares the variation of some indicators like IMPORTANCE and GAP among regions, and fourth section discuss summary on the findings.
5.1 Synergies Between Helices in Innovation Networks
Figure 3 is based on four separate IMPORTANCE factors for each of the four helices across all informants and spatial levels. A high score on the IMPORTANCE UNIVERSITY factor means that the respondent has important relations to global, national and regional universities. The colored line indicates the average of the respondent own helix. The position of the red line on each of the four factors indicates the position of respondents from universities. The figure shows that universities regard other universities as important, and, to a somewhat lesser degree public sector organizations and firms.
Importance between and within helices (all actors)
Citation: Triple Helix 8, 2 (2021) ; 10.1163/21971927-bja10019
Informants from the public sector and NGO s has an average score on the IMPORTANCE UNIVERSITY factor, and firms score lower. Similarly, informants from the public organizations regard other public organizations and NGO s as important. Compared to informants from other helices, informants from firms score relatively low. Firms are less interested in other firms than universities are. But this is based on averages, in the next section we will look at variance.
Different helices have different functions and mechanisms of selection. Accordingly, the finding in Figure 3 is not surprising. There are different perceptions between helices on the significance of synergies, seen as important relations.
The more general IMPORTANCE indicator is based on all questions of importance in the survey across spatial levels and helices. The result of this calculation is showed in Figure 4, which shows how important the QH relations are for informants from different helices. The blue column is the standard deviation. Half of the respondents in the helix are within the range of the blue column. The line inside the blue column is the median value of the score. The thin line is the range between maximum and minimum. Similar to the previous figure, we see that QH relations are regarded as more important for informants in universities, public organizations and NGO s than for firms. However, among firms there is a broad variation, some firms regard QH relations as important, while others do not to the same extent.
IMPORTANCE of quadruple helix relations across helices (N=141, without Polish cases)
Citation: Triple Helix 8, 2 (2021) ; 10.1163/21971927-bja10019
Figure 5 describes the importance of helix partners across spatial levels for each respondent. The respondent’s helix is colored circle in the cubic. Importance of actors in different spatial levels is in most cases cumulative. The more important regional partners are, the more important also are the national and international partners for respondent’s innovation activities. Spatial differentiation would mean that there are firms, which are embedded only at national or international levels. However, we find some respondents for which only regional firms and public organizations are important (see Figure 6 for firms) but these are exception in the data. For some other respondents, regional innovation partners were highly important but national and international partner less important.
Importance of partners across the spatial levels. (N=167)
Citation: Triple Helix 8, 2 (2021) ; 10.1163/21971927-bja10019
Importance of firms as helix partners across spatial levels (N=61)
Citation: Triple Helix 8, 2 (2021) ; 10.1163/21971927-bja10019
This finding is in line with earlier studies on innovation processes, according to which geographical proximity is important for innovation processes of firms, but the innovation processes stretch in space taking place at multiple sites. (Bathelt et al., 2004; Nygaard Tanner, 2018; Boschma, 2005).
The indicator IMPORTANCE also describes the network integration; that is how integrated or fragmented is the network. In Figure 5 and Figure 6, fragmented network is at bottom and right of the cubic. There are some very fragmented networks, but generally the innovation networks seem to be quite integrated especially for firms and universities. High levels of IMPORTANCE means that networks both within and between the helices are relatively strong. The more integrated the network is at regional level the more important are the national and international level partners.
5.2 System Integration and the Strength of Weak Ties
The data shows a strong connection between structure (importance) and expectation (correlation coefficient 0,567), which means that the more important the partner the higher the expectation towards it in innovation cooperation (Table 7 and Figure 7). There is also a high correlation between expectations and experiences, and between experiences and importance. Most of the time, experiences confirm and strengthen expectations, and positive experiences and expectations strengthen importance, or integration of the system. These are the positive feedback loop which feeds innovation system integration (importance).
Correlations between the structure, expectation, experience and gap
Citation: Triple Helix 8, 2 (2021) ; 10.1163/21971927-bja10019
Structure (IMPORTANCE) and expectation (N=167)
Citation: Triple Helix 8, 2 (2021) ; 10.1163/21971927-bja10019
However, there is no correlation between structure (importance) and gap (correlation coefficient 0,065).
The connection between structure and expectation differs across helices, which can be seen in the scatter diagram of Figure 8. Dots are respondents and color of dots indicates helix of respondent. The exponential blue line going up shows the relation between importance and expectations for firms. The function of the business helix is wealth generation according to profitability. The firms focus on efficiency and predictability, hence a high positive correlation between expectations and importance of QH. This means that in order to integrate firms within innovation network, the networks need to be predictable and able to provide the right kinds of interaction with firms, satisfying high expectations. Put it differently, firms are not likely to attach importance to unstable partners.
Structure (IMPORTANCE) and EXPECTATIONS across helices
Citation: Triple Helix 8, 2 (2021) ; 10.1163/21971927-bja10019
NGO s are on the other end of this scale. NGO s often have clients, members or opponents characterized by tensions or conflicts. Similarly, public organizations (normative control) and universities (novelty production) often exist in environment where they may allow themselves to have frustrations to their expectations, wide gaps.
One might say that gaps are not just factors of disintegration and disruption. They may also be sources of exploration and learning through weak relations (Granovetter, 1973). Data shows a strong connection between structure (importance) and expectations, but not with structure (importance) and gap (Figure 9).
Structure (IMPORTANCE) and GAP (N= 167)
Citation: Triple Helix 8, 2 (2021) ; 10.1163/21971927-bja10019
Universities and public organizations allow themselves big gaps in important relations. This can be interpreted as move towards knowledge-based society. Universities and public organizations are less restricted by structures. Public organizations have high correlation between expectations and experience, and large gaps, which are weakly correlated with the structure (Figure 10).
The relation between structure and gap is illustrated in Figure 9.
Structure (IMPORTANCE) and GAP by helices (N= 167)
Citation: Triple Helix 8, 2 (2021) ; 10.1163/21971927-bja10019
Figure 10 seems to illustrate the over-all differences between helices we have observed above. However, there is a great deal of variation. The reason for this is that the dynamic between expectations, experiences and importance is influenced by a contextual variable: region.
5.3 Regional Level Variation
According to previous empirical findings, TH emergence and configurations vary across countries. (e.g. Lengyel and Leydesdorff, 2011; Leydesdorff and Park, 2014). Scholars have also recognised variances across regions to promote QH structures for the implementation of regional innovation (Carayannis and Rakhmatullin, 2014). Our findings among the regions in BSR confirm these findings, measured with the variation of importance and gap.
High levels of IMPORTANCE mean that networks both within and between the helices are relatively strong. The regions with the highest levels of IMPORTANCE (Lithuania bio economy and Latvia metal) meaning more integrated networks than regions with lowest score (Oppland wood and Hamburg circular economy, see Figure 11). Regions with high level of helix integration (high score on IMPORTANCE) have more possibilities for self-organization in helix arrangements than regions with fragmented networks. However, the regions with low level of helix integration might have other forms of self-organization in knowledge-based economy, like innovation cooperation inside firms.
Mean IMPORTANCE of QH integration across regions
Citation: Triple Helix 8, 2 (2021) ; 10.1163/21971927-bja10019
Regions with low scores on IMPORTANCE, such as Oppland (Norway) and Päijät-Häme (Finland) are aware of their challenges. They work in different ways to improve connectivity in the QH innovation network. A typical pattern is public sector support to NGO s and knowledge brokers connecting researchers and small firms, like the initiatives in Oppland (Mariussen et al. 2019).
Figure 11 shows the mean of IMPORTANCE by regions. Figure 12 shows the mean of GAP.
Mean GAP in innovation networks (towards firms and public organizations)
Citation: Triple Helix 8, 2 (2021) ; 10.1163/21971927-bja10019
The GAPS are generally larger in Baltic countries and Pomorskie (Poland) than in Nordic countries and in Germany, which leads to two somewhat contractionary implication. In one hand, large gaps mean frustrations in the cooperation between the QH actors and fewer possibilities to discoveries, but on the other hand, high gaps in important relations with high expectations are an indication that the system is evolving fast, since there is a tension that is driving towards change. The higher gaps in Baltic countries compared to Nordic countries can be explained with diverging historical context and with cultural features of the path dependent development of the cases. (Gedminaitė-Raudonė et al., 2021). The Swedish region Västerbotten indicates a stable system, since the network is integrated and the gaps are small, and there is a high correlation between IMPORTANCE and EXPECTATION.
These differences indicates that regional innovation networks may be influenced in different ways by the functions of different helices.
We can derive following typology:
-
Firm-dominated synergies in networks of innovation. Regions with strong or medium strong networks (high importance) and small or average gaps. Examples are Västerbotten (Sweden), Päijät-Häme (Finland), Lithuanian robotics and Pomorskie ICT (Poland).
-
Public sector dominated synergies. Regions with strong networks and big gaps. Examples are Lithuania (BIO) and Latvia.
-
Weak or no synergies. This is regions where the innovation network is regarded as less important. Innovation is taking place inside firms or other organizations. Examples are Oppland (Norway) and Hamburg. (Virkkala et al. 2021)
5.4 Summary of the Empirical Analysis
What can we learn from indicators which measure synergies within and between helices in innovation networks through primary data collected from informants? Helices are not “taking functions from each other”, instead we find creation of increased complexity through multi-level systems, where helix functions are combined with varieties of synergies (Table 8).
The driver of this dynamic is the differences between helices when it comes to inclusion or acceptance of partners, in other words, the relation between importance and gaps. Firms, driven by regards for profitability, have a focus on important, efficient relation with small gaps. This might lead into a productivity trap where exploitation triumphs exploration. In a firm-dominated region, this might lead to innovation strategies where universities adapt and support the firm strategy of innovation in a close cooperation with low gaps.
Universities, public organizations, and NGO s have other motives for cooperation. This opens up for wider inclusion of cooperative relations, to include and spend time with somewhat less important partners, and acceptance of surprises and frustrations, gaps, on the road. If regional embedded networks have different power and legitimacy relations between different helices, this is likely to open up for networks with different structures, different trajectories and probably also different strategies. A case in point is the Lituanian BIO region, where a pro-active public organization is driving a strategy of radical circular economy innovation, and in doing so accepts constructive disagreements with private entrepreneurs and businesses they involve with. Similarly, one might think of a university in the role as a broker between business sector restricted by a tight productivity regime and a pro-active public sector with, say, a political agenda on green transition. In this situation, the university might decide to take a fight, based on a scientific theory of green energy and global warming. So maybe, after all, the firms will open up? If so, the helices open up to each other and form a more complex, multi layered network of innovation. The key to this process of transformation is the ability of universities, public sector organizations and NGO s to work and live with cooperative relations which also include tensions and gaps. This new network might of course result in publications and patents, but the main function is likely to be a new regional strategy of innovation.
6 Discussion
In the TH and QH analysis the helices are often treated uniform, but they are heterogeneous. The case studies were focused on specific cluster, value chain or sector, varying among the cases from ICT and robotics to bio economy and circular economy. However, the specific sectors or clusters consisted of smaller and larger firms, and firms embedded only in regional level, as well as firms operating at regional, national and international levels. Also the government has a multilayer character, from municipalities, to regional councils, to national authorities, and to EU authorities, which were captured analyzing the stretching of innovation networks on different geographical scales (see also Cai and Etzkowitz, 2020).
The connectivity analysis has been used both in TH and QH arrangements, but this article used QH approach NGO s representing the forth helix. The NGO s were both interest organizations like trade unions, farmers’ unions and employers’ associations typical for the Nordic societies, and development agencies, which have often hybrid character. It would have been possibly to categorize the interest organizations to business since they have wealth generation functions. The development agencies could have been accounted to public organizations (government), since their functions are normative like promoting regional development. The inclusion of the forth helix as NGO s made the analysis quite complicated. Accordingly, we agree the recommendation of Cai and Etzkowitz (2020) and Leydesdorff (2012) to limit the empirical analysis in the three helices whenever it is possible. However, we argue that when the main focus is civil society, like local communities, and social innovation, QH might be a useful approach (see Nordberg et al., 2020).
Second limitation of the empirical analysis in this article is the focus on bilateral relations of the respondents. We know what kind of helix actors a specific respondent is cooperating, but not how the partners of this respondent relate to each other. The gathering of data of full network instead of egocentric network would have been quite a big effort. In spite of this limitation, we have made overall assessments of the role of helices in the innovation cooperation in terms of importance and gaps.
The connectivity analysis captures many features of helix models, but for instance not the feature of dynamic interactions through “taking the role of the other”. Instead the helices might complement each other in innovation strategies. The data on BSR reveals that firms have a focus on important, efficient relation with small gaps, when universities, public organizations and NGO s allow large gaps even in important relations. We find creation of increased complexity through multi-level systems, where helix functions are combined with varieties of synergies.
The method presented in this article is quite heavy, since it is based on interviews, and there should be at least three respondents per helix to make the calculations possible. We have made another study based on web based questionnaire, but so far that has not been successful, since the data was biased and not representative (Johnson et al., 2019; Mäenpää, 2020).
The advantages of the use of connectivity analysis is that it captures the structure and dynamics of helix network, the data can be used in comparative analysis, and it has practical value for the regional developers.
The analyzed data was not longitudinal, so the statements of the emergence and development are indirect. The dynamic dimension of the measurement is derived from Luhmann’s notion of expectation. Even a snapshot survey can capture the dynamics in the system measured with expectations and gaps. However, the measurement is not mechanistic: not all gaps are relevant. Only gaps in important relations are relevant and that is the reason why importance and gaps should be related. Using the connectivity analysis needs deep understanding of the dynamics and character in the target region. In LARS report (Mariussen et al., 2019) the context of the regions and cases are analyzed.
The indicators of the connectivity analysis presented in the article enable the comparison of the role of different helices on different spatial scales in innovation networks, as well as the different processes of structuring and dynamics of innovation networks. In this article we compared ten cases, but even comparing two cases or one case in two different time has proved to be fruitful for the deeper understanding of the dynamics of regional innovation networks (Mäenpää, 2020; Johnson et al., 2019).
Connectivity analysis is also a policy tool. The indicators of the analysis like GAP can and have been used by the regional actors in reflecting their own innovation ecosystem and improving the connectivity between helices in their regions, often with extra-regional linkages (self-reflection). The indicators have been used as an input in a structured dialogue in focus groups in which relevant helix actors participate. Discussions on gaps can open the door to the discovery of emergent connections (weak relations that may be strengthened) and structural holes (lack of relations), which may reveal an opportunity for discovery processes in the region as actors resolve the issues hindering cooperation on various aspects of innovation. The indicators have also been used on systems level as a basis on transnational learning when good connectivity has been the subject of benchmarking and learning for helix actors in other regions (LARS project, 2020).
7 Conclusion
This article has introduced an alternative way to measure synergy in helix arrangement, called connectivity analysis. The unique data on perceptions of helix actors in BSR has been used to overcome the limitations of the earlier synergy indicators based on macro-level statistical databases.
The article has contributed to the operationalization of helix arrangement in analyzing structure and dynamics of actor based innovation networks. In explaining the connections between the structure and dynamics of innovation networks, Luhmann’s theory of systems proved to be useful. A helix organization evaluates with whom it is innovating, both within and across helices through self-reflection. Sets of important innovation partners make up the self-organizing networks. The framework model consisting of expectations, experience, and importance combines causal relations and feedback loops.
According to our findings there is correlation between the three core variables expectation, experience and importance. Different organizations create their networks in different ways, and we found large variation among organizations even in the same helix.
Large gaps are concentrated in medium-weak relations, in terms of importance. This is consistent with the Granovetter theory of the strength of weak ties. Based on measurement of importance and gaps, we derived typology of helix synergy based on strength (importance) and dynamism (gap) of the network: some regions have well-functioning systems of innovation, other regions high innovation potential with strong networks and big gaps, and third fragmented networks with weak networks and small gaps.
According to the findings, firms have a lower ability to accept gaps in important relations than other helix actors. Universities, public organizations and NGO s are able to work and live with cooperative relations which also include gaps even in strong (highly important) relations. Universities adapt and support the firm-based innovation strategy in a close cooperation. Universities can also act as brokers between firms and pro-active public sector, which might after all open up firms and lead the four helices to form a more complex, multi-layered network of innovation leading to transformation of regional economy. The transformative ability of universities, public sector organizations and NGO s is due to their propensity to tolerate tensions in cooperative relations and work with them.
However, further research is needed on the relations of complementarities and synergies of helices from the micro-level perspective.
Acknowledgements
The authors received funding from the project LARS (Learning Among Regions on Smart Specialisation) implementing the INTERREG Baltic Sea Region Programme 2014–2020. We would like to acknowledge our project partners, the project coordinator Mr. Jerker Johnson from Regional Council of Ostrobothnia (Finland) and our colleague Dr. Antti Mäenpää. We would also like to thank the editor of the special issue Yuzhuo Cai for valuable and constructive comments.
References
Åkerstrøm Andersen N (2003) Polyphonic Organisations. In: Bakken T and Hernes, T (eds) Autopoietic Organization Theory. Drawing on Niklas Luhmann’s Social Systems Perspectives. Copenhagen: Abstrakt Forlag, Copenhagen Business School Press, 151–182.
Åkerstrøm Andersen N (2008) Partnerships: Machines of Possibility. Bristol: Bristol University Press.
Arnkil R, Järvensivu A, Koski P and Piirainen T (2010). Exploring Quadruple Helix. Outlining User-Oriented Innovation Models. University of Tampere, Institute for Social Research, Work Research Centre, 85/2010 Working Papers. http://urn.fi/urn:isbn:978-951-44-8209-0.
Bakken T and Hernes T (eds) (2003) Autopoietic Organization Theory. Drawing on Niklas Luhmann’s Social Systems Perspectives. Copenhagen: Abstrakt forlag, Copenhagen Business School Press.
Bathelt H, Malmberg A and Maskell P (2004) Clusters and knowledge: local buzz, global pipelines and the process of knowledge creation. Progress in Human Geography 28: 31–56. DOI: 10.1191/0309132504ph469oa.
Borkowska K and Osborne M (2018) Locating the Fourth Helix: rethinking the role of civil society in developing smart learning cities. International Review of Education 64(3): 355–372. https://doi.org/10.1007/s11159-018-9723-0.
Boschma R (2005) Proximity and innovation: a critical assessment. Regional Studies 39(1): 61–74. https://doi.org/10.1080/0034340052000320887.
Cai Y and Etzkowitz H (2020) Theorizing the Triple Helix model: past, present, and future. Triple Helix Journal 6: 1–38. https://doi.org/10.1163/21971927-bja10003.
Carayannis E and Campbell D (2012) Triple Helix, Quadruple Helix and Quintuple Helix and how do knowledge, innovation, and environment relate to each other? International Journal of Social Ecology and Sustainable Development 1(1): 41–69. DOI: 10.4018/jsesd.2010010105.
Carayannis E and Rakhmatullin R (2014) The Quadruple/Quintuple innovation Helixes and smart specialisation strategies for sustainable and inclusive growth in Europe and beyond. Journal of the Knowledge Economy 5(2): 212–239. https://doi.org/10.1007/s13132-014-0185-8.
Champenois EG and Etzkowitz H (2018) From boundary line to boundary space: the creation of hybrid organizations as Triple Helix micro-foundation. Technovation (76/77): 28–39. 10.1016/j.technovation.2017.11.002.
Etzkowitz H (2003) Innovation in nnovation: the Triple Helix of university–industry– government Relations. Social Science Information 42(3): 293–337. doi:10.1177/05390184030423002.
Etzkowitz H (2008). The Triple Helix: University–Industry–Government Innovation in Action. London: Routledge.
Etzkowitz H and Klofsten M (2005) The innovating region: toward a theory of knowledge-based regional development. R&D Management 35(3): 243–255. https://doi.org/10.1111/j.1467-9310.2005.00387.x.
Etzkowitz H and Leydesdorff L (2000) The dynamics of innovation: from national systems and “Mode2” to a Triple Helix of university–industry–government relations. Research Policy 29(2): 109–123. DOI: 10.1016/S0048-7333(99)00055-4.
Etzkowitz H and Ranga M (2011) “Spaces”: a Triple Helix governance strategy for regional innovation. In: Rickne A, Laestadius S and Etzkowitz H (eds) Regional Innovation Systems: The Swedish Experience of Policy, Governance and Knowledge Dynamics. Abingdon: Routledge, 51–68.
Etzkowitz H and Zhou C (2017) Triple Helix: University–Industry–Government Innovation and Entrepreneurship. Milton Park: Routledge.
Foray D (2015) Smart Specialization: Opportunities and Challenges for Regional Innovation Policy. London: Routledge.
Galvao A, Mascarenhas C, Marques C, Ferreira J and Ratten V (2019) Triple Helix and its evolution: a systematic literature review. Journal of Science and Technology Policy Management 10(3): 812–833. 10.1108/JSTPM-10-2018-0103.
Gedminaitė-Raudonė Z, Virkkala S, Vilkė R, Mariussen Å and Mäenpää A (forthcoming 2021) Discovering regional innovation potential for smart specialization: the case of the two Baltic Sea regions. Journal of Baltic Studies.
Gianelle C, Kiriakou D, Cohen C and Przeor M (2016) Implementing Smart Specialisation Strategies: a Handbook. European Commission, Joint Research Centre, Directorate B. Growth and Innovation Smart Specialisation Platform. Joint Research Centre. Seville, Spain. 10.2791/61039410.2791/5356910.2791/838209.
Grabher G (2006) Trading routes, bypasses, and risky intersections: mapping the travels of “networks” between economic sociology and economic geography. Progress in Human Geography 30(2): 163–189.
Granovetter M (1973) The strength of weak ties. American Journal of Sociology 78(6): 1360–1380.
Hasche N, Höglund L and Linton G (2019) Quadruple Helix as a network of relationships: creating value within a Swedish regional innovation system. Journal of Small Business & Entrepreneurship 32(2): 1–22. 10.1080/08276331.2019.1643134.
Höglund L and Linton L (2018) Smart specialization in regional innovation systems: a quadruple helix perspective. R&D Management 48(1): 60–72. http://dx.doi.org/10.1111/radm.12306.
Johnson J, Dahl J and Mariussen Å (2019) Smart specialization driving globalization of small and middle-sized companies in the Finnish region of Ostrobothnia. Ekonomiaz. Revista Vasca de Economia 95: 176–201.
Kauffeld-Monz M and Fritsch M (2010) The impact of network structure on knowledge transfer: an empirical application of social network analysis in the context of regional networks of innovation. The Annals of Regional Science 44(21). https://doi.org/10.1007/s00168-008-0245-8.
Krätke S (2010) Regional knowledge networks. A network analysis approach to the interlinking of knowledge resources. European Urban and Regional Studies 17(1): 83–97. https://doi.org/10.1177/0969776409350794.
LARS project (2020). Available at: https://www.lars-project.eu/.
Lengyel B and Leydesdorff L (2011) Regional innovation systems in Hungary: the failing synergy at the national level. Regional Studies 45(5): 677–693.
Leydesdorff L (2000) The Triple Helix as an evolutionary model of innovation. Research Policy 29(2/3): 243–255. 10.1016/S0048-7333(99)00063-3.
Leydesdorff L (2003) The mutual information of university–industry–government relations: an indicator of the Triple Helix dynamics. Scientometrics 58(2): 445–467. https://doi.org/10.1023/A:1026253130577.
Leydesdorff L (2008) The communication of meaning in anticipatory systems: a simulation study of the dynamics of intentionality in social interactions. In: Dubois DM (ed.) Computing Anticipatory Systems. CASYS ‘07 – Eighth international conference, 33–49. (AIP conference proceedings, Vol. 1051). Melville: American Institute of Physics. https://doi.org/10.1063/1.3020674.
Leydesdorff L (2012) The Triple Helix, Quadruple Helix, …, and an N-Tuple of helices: explanatory models for analyzing the knowledge-based economy? Journal of Knowledge Economy 3: 25–35. 10.1007/s13132-13011-0049-0044.
Leydesdorff L (2013) Niklas Luhmann’s magnificent contribution to the sociological tradition: the emergence of the knowledge-based economy as an order of expectations. SSRN Electronic Journal.
Leydesdorff L (2018) The differentia specifica of interhuman communications: Luhmann and the sociological reflection of information theory. In: Dodig-Cnkovic M and Burgin G (eds) Theoretical Information Studies. World Scientific Series in Information Studies, Vol. 2.
Leydesdorff L and Deakin M (2011) The triple helix model of smart cities: a neo- evolutionary perspective. Journal of Urban Technology 18(2): 53–63. 10.1080/10630732.2011.601111.
Leydesdorff L and Etzkowitz H (1998). The triple helix as a model for innovation studies. Science and Public Policy 25(3): 195–203. https://doi.org/10.1093/spp/25.3.195.
Leydesdorff L and Etzkowitz H (2003) Can “the public” be considered as a fourth helix in university–industry–government relations? Science and Public Policy 30(1): 55–61.
Leydesdorff L, Ivanova I and Meyer M (2017a) Synergy in innovation systems: redundancy in the triple helix of university–industry–government relations. SPRU Working Paper Series (SWPS) 2017(08): 1–52. ISSN 2057-6668. Available at: http://www.sussex.ac.uk/spru/documents/2017-08-swps-leydesdorff-et-al.pdf.
Leydesdorff L and Meyer M (2003) Triple Helix of University-Industry-Government Relations. Scientometrics 58(2):191-203. DOI: 10.1023/A:1026276308287.
Leydesdorff L and Meyer M (2006) The Triple Helix, Indicators, and Knowledge- based Innovation Systems. Research Policy 35(10): 1441–1449. DOI: https://doi.org/10.1016/j.respol.2006.09.016.
Leydesdorff L and Park HW (2014) Can Synergy in Triple Helix Relations be Quantified? A Review of the Development of the Triple Helix Indicator. Triple Helix, 1(4). DOI: https://doi.org/10.1186/s40604-014-0004-z.
Leydesdorff L, Petersen A and Ivanova I (2017b) The Self-organization of Meaning and the Reflexive Communication of Information. Social Science Information, 56(1), pp. 4–27.
Lindberg M, Lindgren M and Packendorff J (2014) Quadruple Helix as a Way to Bridge the Gender Gap in Entrepreneurship: The Case of an Innovation System Project in the Baltic Sea Region. Journal of Knowledge Economy, 5, pp. 94–113. DOI 10.1007/s13132-13012-0098-0093.
Luhmann, N. (1995) Social Systems. Stanford: Stanford University Press.
Lundvall, B-Å., ed. (1992) National Systems of Innovations. London: Pinter Publishers.
MacGregor SP, Marques-Gou P and Simon-Villar A (2010) Gauging readiness for the quadruple helix: a study of 16 European organizations. Journal of the Knowledge Economy 1(3): 173–190. DOI: 10.1007/s13132-010-0012-9.
Mariussen Å, Mäenpää A and Virkkala S (2019) Revealing of the Innovation Potential in Baltic Sea Region – A Comparative Analysis, LARS WP3 report. https://www.lars-project.eu/ McAdam M and Debackere K (2018) Beyond “triple helix” toward “quadruple helix” models in regional innovation systems: implications for theory and practice. R&D Management 48(1): 3–6. https://doi.org/10.1111/radm.12309.
McAdam M, Miller K and McAdam R (2016) Situated regional university incubation: a multi-level stakeholder perspective. Technovation 50/51: 69–78. DOI: 10.1016/j.technovation.2015.09.002.
Meyer M, Grant K, Morlacchi P and Weckowska D (2014) Triple Helix Indicators as an Emergent Area of Enquiry: a Bibliometric Perspective. Scientometrics, 99(1): 151–174. DOI: 10.1007/s11192-11013-1103-1108.
Miller K, McAdam R and McAdam M (2016) A Systematic Literature Review of University Technology Transfer from a Quadruple Helix Perspective: Toward a Research Agenda. R&D Management 48(1): 7–24. https://doi.org/10.1111/radm.12228.
Mitchell R, Agle B and Wood D (1997) Toward a Theory of Stakeholder Identification and Salience: Defining the Principle of Who and What Really Counts. Academy of Management Review, 22(4), pp. 853–886. https://doi.org/10.5465/amr.1997.9711022105.
Mäenpää A (2020). The Challenges of Public Organisations in Coordinating Smart Specialisation and a Connectivity Model as One Solution, Dissertation, Regional Studies, University of Vaasa. Acta Wasaensis 438. http://urn.fi/URN:ISBN:978-952-476-898-6.
Mörcol G (2012) A Complexity Theory for Public Policy. Abingdon: Routledge.
Nordberg K, Mariussen Å and Virkkala S (2020) Community-driven Social Innovation and Quadruple Helix Coordination in Rural Development. Case study on LEADER Group Aktion Österbotten. Journal of Rural Studies, 79, pp. 157–168. https://doi.org/10.1016/j.jrurstud.2020.08.001.
Nygaard Tanner A (2018) Changing Locus of Innovation: a Micro-Process Approach on the Dynamics of Proximity. European Planning Studies, 26(12), pp. 2304–2322. DOI: 10.1080/09654313.2018.1529143.
Pinto H (2017) Connecting the triple helix space: actor network creation and institutionalisation of knowledge transfer offices. Triple Helix 4(2): 10.1186/s40604-40017-0045-0041.
Ranga M and Etzkowitz H (2013) Triple helix systems: an analytical framework for innovation policy and practice in the knowledge society. Industry and Higher Education 27(4): 237–262. https://doi.org/10.5367/ihe.2013.0165.
Ter Wal A and Boschma R (2009) Applying social network analysis in economic geography: framing some key analytic issues. Framing some key analytic issues. The Annals of Regional Science 43(3): 739–756. DOI: 10.1007/s00168-008-0258-3.
Teräs J and Ylinenpää H (2012) Regional dynamics in non-metropolitan hi-tech clusters: a longitudinal study of two Nordic regions. In: Rickne A, Laestadius S and Etzkowitz H (eds) Regional Innovation Systems: The Swedish Experience of Policy, Governance and Knowledge Dynamics. Abingdon: Routledge, 69–91.
Vilkė R, Gedminaitė-Raudonė Z and Vidickiene D (2020) Collaboration for the socially responsible development of rural regions: biogas production in Lithuanian farms. Social Responsibility Journal 16(6): 877–898. https://doi.org/10.1108/SRJ-07-2019-0235.
Virkkala S, Mäenpää A and Mariussen Å (2014) The Ostrobothnian model of smart specialisation. Proceedings of the University of Vaasa, Reports 196.
Virkkala S, Mäenpää A and Mariussen Å (2017) A connectivity model as a potential tool for smart specialization strategies. European Planning Studies 25(4): 661–679. https://doi.org/10.1080/09654313.2017.1283391.
Virkkala S and Mariussen Å (2019) Self-discovery enabling entrepreneurial discovery processes. In: Mariussen A, Virkkala S, Finne H and Aasen T (eds) The Entrepreneurial Discovery Process and Regional Development: New Knowledge Emergence, Conversion and Exploitation. Abingdon: Routledge. Routledge Series Regions and Cities, 11–34.
Virkkala S, Mariussen Å, Mäenpää A and TECH-ACC (2021) Connectivity and innovation potential in Pomorskie ICT and energy. Comparison across the Baltic Sea Region. LARS project report. https://www.lars-project.eu/assets/14/Uploads/Pomorskiereport04012021.pdf.
Wasserman S and Faust K (1994) Social Network Analysis: Methods and Applications. Cambridge: Cambridge University Press. https://doi.org/10.1017/CBO9780511815478.

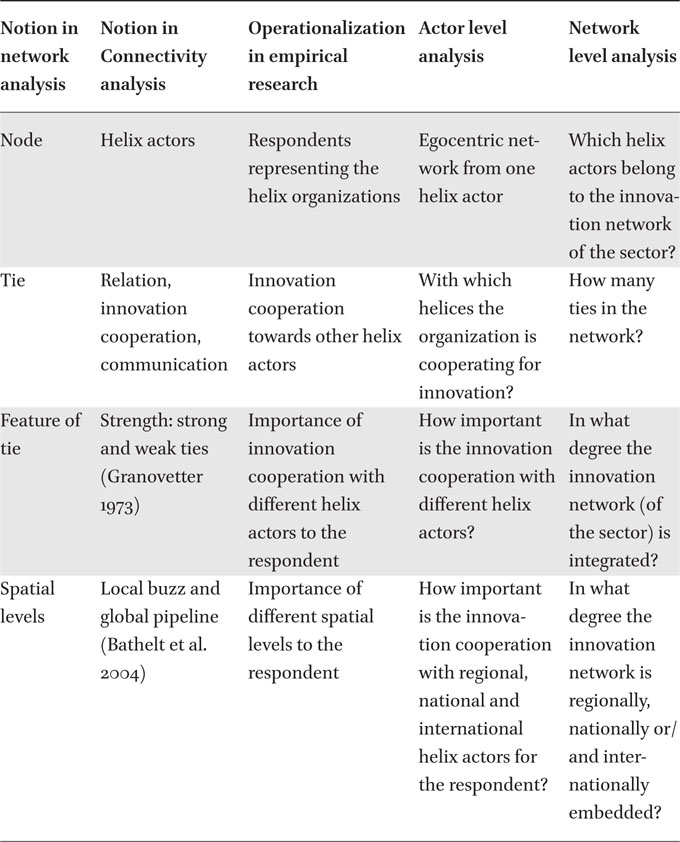
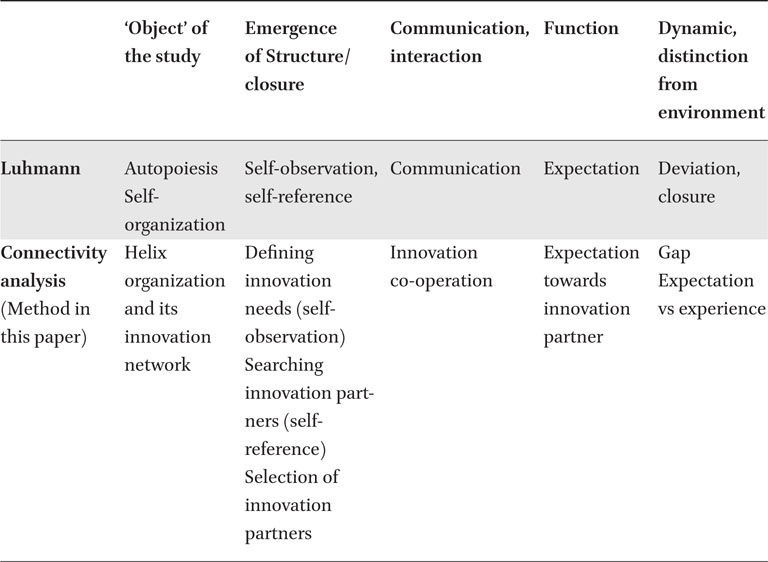

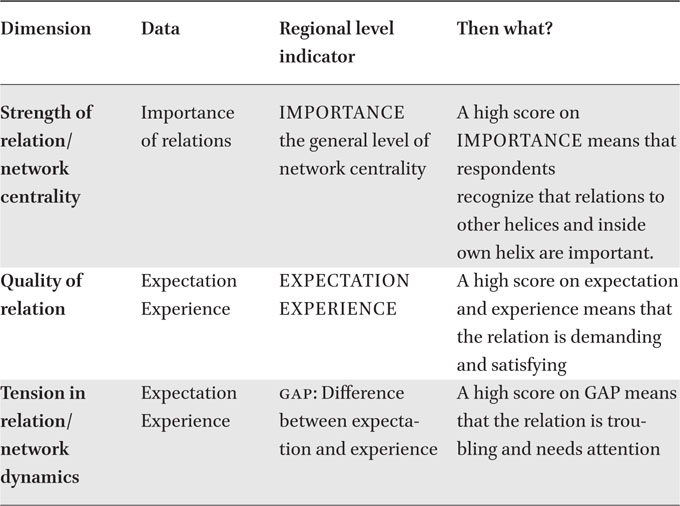
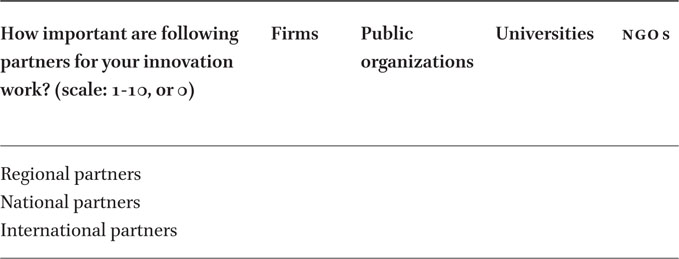
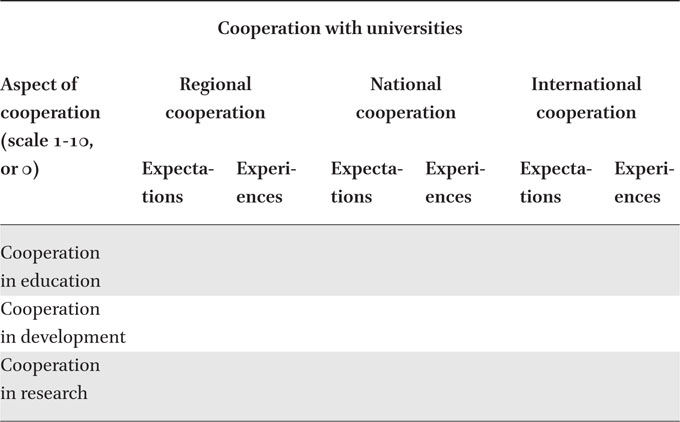
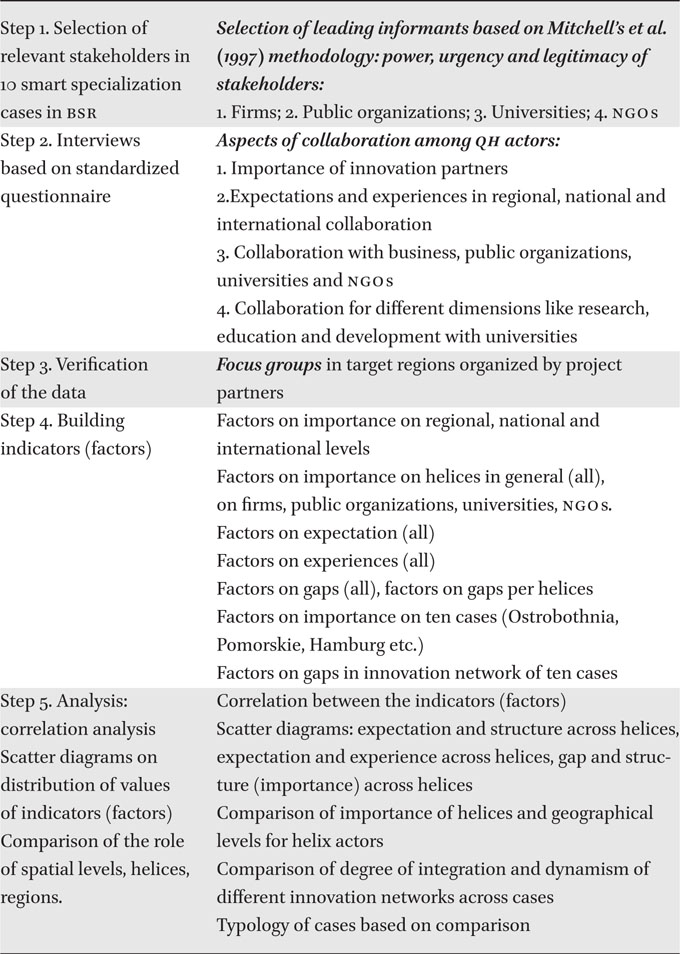
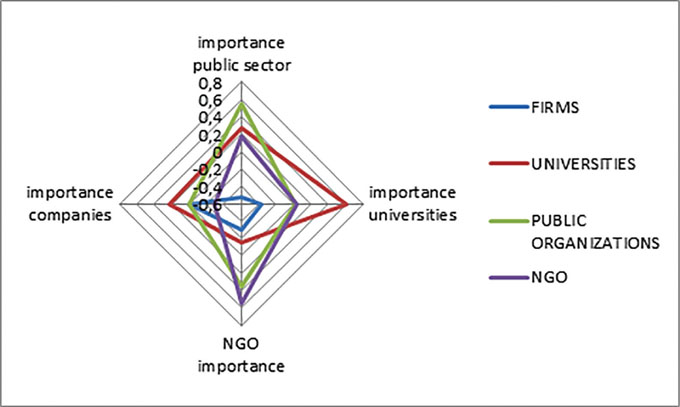

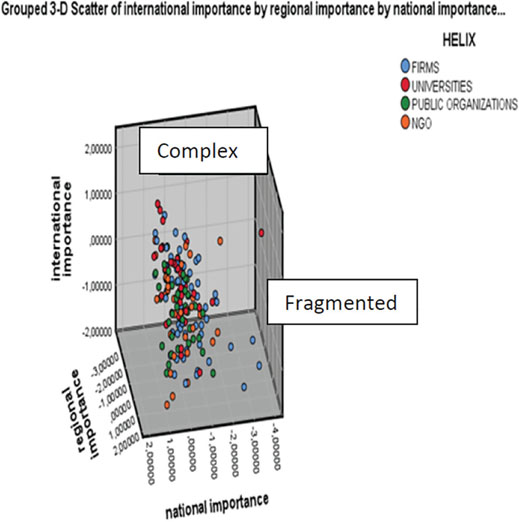
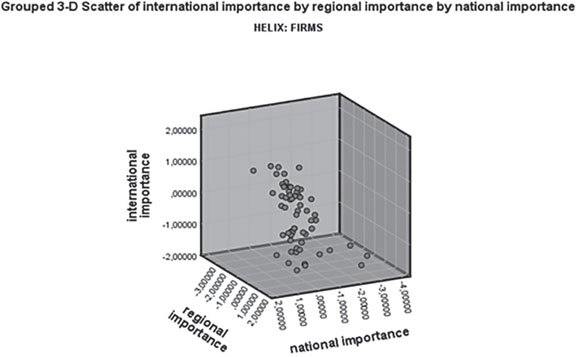

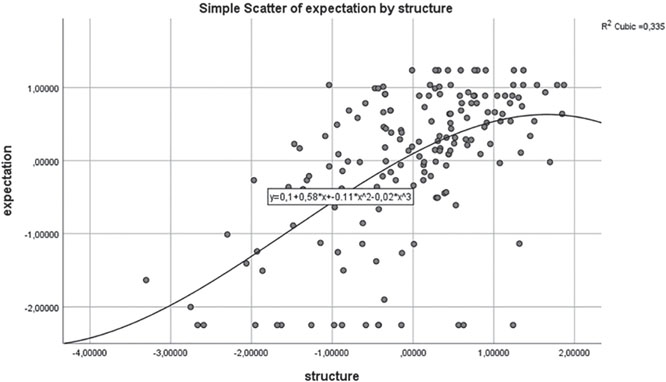
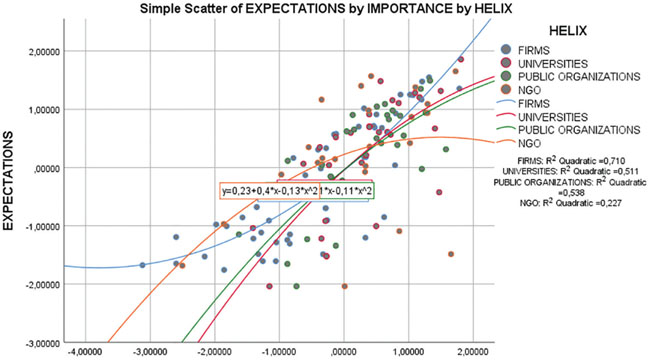
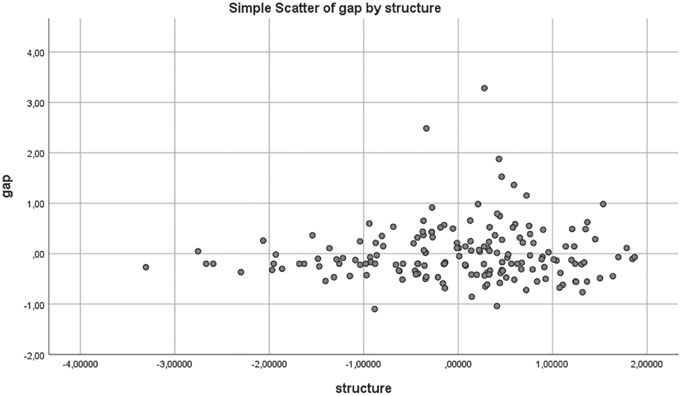
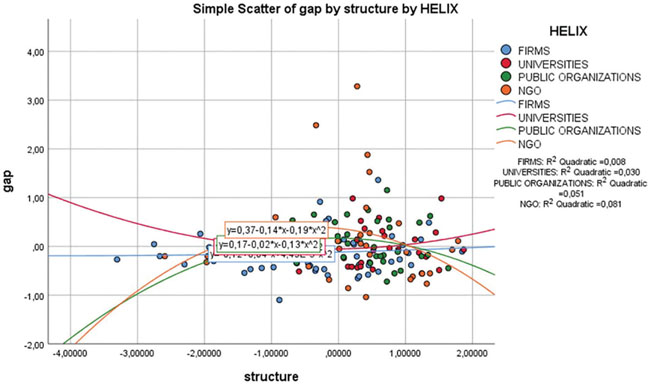
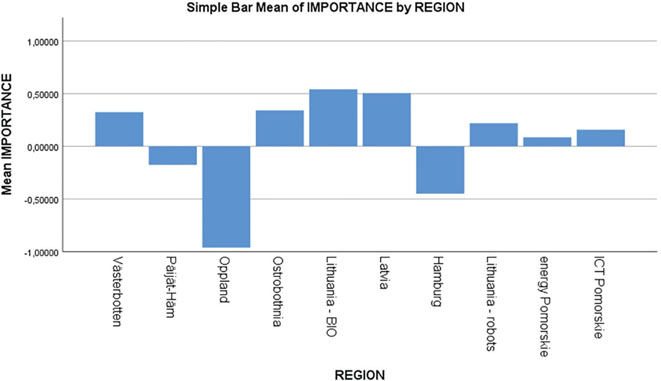
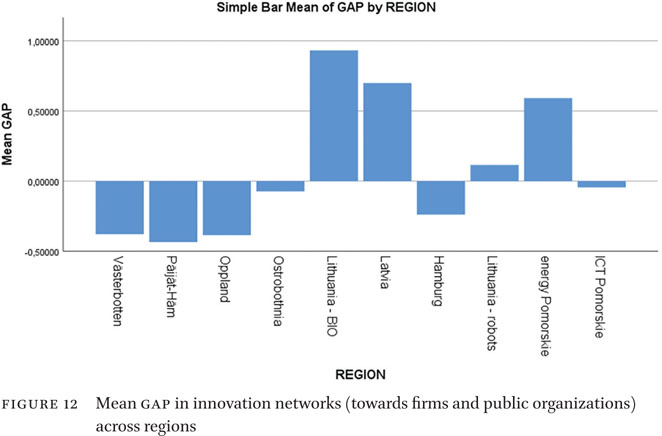
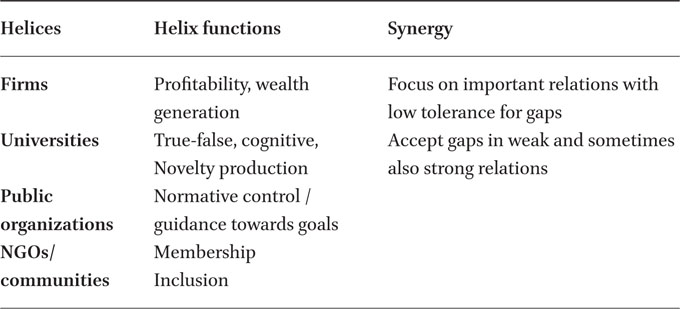
