Abstract
Global challenges demand more competitiveness from cities, calling for quick adaptation to changes brought about by the current knowledge economy. Innovation Districts (ID) stand out as the most favourable ecosystems to create economic, urban, social and governance solutions proactively and at the speed demanded by this rapid renewal of knowledge. Effective assessment is important in these areas to ensure efforts are guided to achieve the objectives set. Following validation by a panel of 17 experts through an international Fuzzy Delphi survey, and 15 experts in the DEMATEL multi-criteria decision-making approach, this study builds a conceptual framework in four dimensions (Urban, Economic, Social and Governance), with a set of 37 indicators identified as relevant to assess performance in ID and the power of influences among them. The resulting multidimensional innovation assessment framework is a powerful tool, being useful in determining the key impact indicators of existing innovation districts.
1 Introduction
Increasingly, from Marshallian industrial district conceptualisation, derived from the industrial revolution (Bellandi and De Propris, 2015), that focuses on industrial agglomerations, to the knowledge revolution (Chichilnisky, 1998) where human capital is the engine of development, urban development relies on a knowledge-based economy as the means to ensure sustainable growth through urban areas of innovation (Pareja-Eastaway and Pique, 2011) with a holistic perspective to address interrelated social, economic and environmental challenges. Innovation is one of the most important strategies for answering the need for a flexible and all-encompassing environment (Florida, 2002; Pancholi et al., 2015). The literature presents various frameworks used to describe and understand how contextual factors influence the agents’ interactions in the innovation process from National Innovation Systems (Lundvall, 1992; Lundvall, 2007; Nelson, 1993; Freeman, 1995) to Regional Innovation Systems (Cooke et al., 1997). Regarding the innovation process in the local dimension, the improvement in the development of a new economy in inner cities has aroused a strong interest (Hutton, 2000; Hutton, 2004), as well as the urban knowledge parks (Bugliarello, 2004) and creative and knowledge cities (Lever, 2002; Florida, 2002; Costa et al., 2008; Pratt, 2008) and knowledge- based urban developments (KBUD) (Carrillo et al., 2014). This last theory (KBUD) argues that cities may become more competitive by working to build their urban, economic, social, and governance pillars together. (Knight, 1995; Lönnqvist et al., 2014; Sarimin and Yigitcanlar, 2012; Nikina and Pique, 2016). In consequence, in the modern world, metropolitan areas are shaping this idea, where core locations are being supported and reorganized by the emergence of intellectual production that supports the creation of knowledge cities (Yigitcanlar, 2011). All of these tendencies revalue cities and urban environs for quality living, enjoyment and growth that stimulates bottom-up innovation (Esmaeilpoorarabi et al., 2020; Belussi and Caldari, 2009) as a recruitment and retention strategy for the vitally important qualified talent. Therefore, talent is the key resource of these ‘knowledge cities’, which creates value through innovation, technology and brainpower to advance social, economic and territorial prosperity (Carrillo, 2006).
Innovation Districts (ID), as urban areas of innovation, and their spatial impact on the status quo have been thoroughly studied as well. Researchers have explored how cities adapted to the global economy during the past two decades (Derqui et al., 2020). From general analyses of the development and organisation of inner cities (Sassen, 1991; Sassen, 1998; Sassen, 2002; Knight, 1995; Gospodini, 2006) to more specific topics such as sustainable development (Hall, 1997), health and urban ecosystem (McMichael, 2000), gentrification effects (Atkinson, 2004), competitiveness of cities (Jensen-Butler et al., 1997; Lever, 1999; Strambach, 2002), in addition to urban regeneration policies (Marcotullio, 2003; Atkinson, 2004; Morisson 2020).
Nowadays, ID are becoming increasingly relevant as a way to address these constantly evolving technological concerns. Targeting the development of these urban areas has become crucial for a territory to remain competitive in the innovation economy and achieve sustainable socioeconomic growth (Yigitcanlar et al., 2020). Moreover, ID play an important role as infrastructure for personal networking in the knowledge economy (Landry, 2000). The trends of urban planners to develop ID are balancing between working and living, since ID stimulate forms of knowledge that serve as knowledge centers and attract creative and highly skilled talent. Additionally, ID combine the clusterisation of activities related to science, technology and innovation in urban areas, operating as engines of economic development. Universities, industries and governments promote knowledge-based activities for urban development as innovation districts (Pareja-Eastaway and Pique, 2011). Cities like Barcelona, Melbourne and Singapore are examples of this development (Yigitcanlar, 2011). Furthermore, these kinds of districts are considered geographic areas where leading-edge anchor institutions and company clusters relate to start-ups, business incubators and accelerators. They are also physically compact, transit-accessible and technically wired and offer mixed-use housing, office and retail. ID are the manifestation of mega-trends altering the location preferences of people and firms and, in the process, re-conceiving the very link between economy shaping, place making and social networking (Katz and Wagner, 2014).
Finally, these multidimensional ID are comprised of a complex web of interconnected elements, including citizens, businesses, transportation, communications, services and other components of an innovation cluster (Engel, 2022), each with their own distinct strengths and weaknesses that must constantly adapt to new situations, posing the ongoing challenge of devising new strategies in accordance with the paradigm of Knowledge-based Urban Development (KBUD) (Yigitcanlar, 2014). Understanding how an ID can develop and improve based on these factors is the first step in achieving its vision and goals, and this can be accomplished by refining its most complex, yet vital link: its strategy. Defining the strategy can assist in determining where and when to invest, in deciding what integration and optimisation timeline across all components and operations is required, and in identifying new growth and development prospects.
Evaluating the primary components and activities of an ID is the first step in designing a strategy for sustainable success (Caird et al., 2016), and developing a set of associated indicators is the appropriate activity for this purpose. Indicators represent the changes and progress made by an ID towards accomplishing a particular goal activity (Dameri, 2017). Therefore, it is crucial that the elements analysed are closely related to the primary activities aimed at achieving particular objectives.
Previous research has been conducted on the concept of indicators in innovation districts. However, such research focuses on more initial aspects of the field such as: classification (Yigitcanlar et al., 2020; Adu-McVie et al., 2021), which proposes a set of conceptual attributes to classify ID through a three-prong framework that includes: classification by function, highlighting the key functions of ID; classification by feature, pointing out the common features of innovation districts; and classification by space-use, focusing on the plans, design and development of ID.
Another view is studied by (Esmaeilpoorarabi et al., 2018a; Esmaeilpoorarabi et al., 2018b), which analyses the most favourable aspects to guarantee assertive emplacement selection of the districts, and propose five areas of study: Context Indicators, Form Indicators, Function Indicators, Image Indicators and Ambience Indicators.
Complementary studies recommend investigation of a singular feature of performance such as well-being (Orii et al., 2020) or particular activities in the district development such as transport (Truong and Ta, 2020). But lacking to date in the research literature is a holistic framework for analysing the performance indicators in all the dimensions of an innovation district.
To answer the research question that analyses how ID can be assessed in their performance, the present research seeks first, to propose a validated and comprehensive framework to assess performance through indicators in innovation districts. Second, to find the level of influence between the indicators allowing this to have a broad vision of all the dimensions and actors required for the development of these areas, to facilitate the decision-making process. The set of indicators proposed is formed by four dimensions (Urban, Economic, Social and Governance) and three agents (Academia, Industry and Government), based on Knowledge Based Urban Development and Triple Helix theories; and drawing on key sources: first, the literature review in performance indicators in ID; second, completed with two case studies of innovation districts that are international references: 22@Barcelona in Spain and Porto Digital in Brazil; and finally, confronted by the IASP’s Global Survey 2018 to confirm that these measurable aspects are also valuable to practitioners. Then, a validation of the set of indicators that compound this framework is performed implementing the Fuzzy Delphi Method which is suitable for topics where there is little previous research or information, and consulting expert opinion is required to properly validate the hypotheses.
After the selection of the most relevant key performance indicators (KPIs), the DEMATEL approach is applied to this set, to identify the level of influence of one indicator over another. Similarly to the Fuzzy Delphi methodology, consulting expert opinion is required to properly set the level of power of one indicator over another.
Following on from the present introduction, section 2 presents the literature background and section 3 the two methodologies employed, and data required to validate the framework and to establish the relationships. Section 4 presents the findings obtained from the consultation of experts, the set of indicators selected and their influences. Section 5 discusses the main indicators that were accepted and the interaction between them established by the panels of experts for each dimension and the role of the Triple Helix Agents. Section 6 describes the main contributions of this work together with concluding remarks.
2 Literature Background
At the beginning of the 20th century, Alfred Marshall introduced the term ‘Industrial District’ in his article ‘The Principles of Economics’, seeking to describe some aspects of the industrial organisation of nations (Marshall, 1920). Then, Walter Isard conceptualised industrial complexes as potential building blocks for the industrialisation of post-war progress of nations (Isard, 1959; Isard, 1960). Later, Stan Czamanski began using the concept of industrial clusters (Czamanski and Augusto de Q. Ablas, 1979), and Giacomo Becattini, following Marshall’s concept of industrial districts, explained the industrialisation of the Italian region of Tuscany and offered the first formal articulation of the concept (Becattini, 1962). Finally, Michael Porter developed a comprehensive notion of industrial clusters to define the spatial concentrations of industries in a group of nations he examined.
In the 1990s, capitalist nations began their economic transition to post- Fordist or knowledge-based economies (Amin, 1994) (Drucker, 1998). In this transition, cities were identified as the platforms to generate technical innovation (Castells, 1989; Florida et al., 2017). In this context, the concept of an ID in cities is derived from territorial innovation models such as the regional innovation system (Cooke and Morgan, 1994; Cooke, 2001), learning region (Morgan, 1997), innovative milieu (Aydalot and Keeble, 1988; Camagni, 1995) (Maillat, 1991; Maillat, 1998), cluster (Porter, 1990; Porter, 1998), industrial district (Becattini, 2004), and knowledge-based urban economy (Knight, 1995), which all emphasise the significance of the spatial dimension of innovation.
Storper and Venables (2004) highlight the importance of face-to-face interactions, co-presence and co-location of individuals and enterprises within the same sector, locality or region, which facilitates knowledge spill-overs and the flow of tacit information in innovation ecosystems (Storper and Venables, 2004). Indeed, information may be exchanged through serendipitous interactions and cognitive heterogeneity, both of which are more prevalent in dense urban districts (Jacobs, 1961).
To remain relevant, urban strategies have had to adapt to new technology and socioeconomic models. Technological developments, particularly revolutionary and disruptive ones, have a substantial impact on urban planning and urban policies (Hall, 1997). Urban economic development best practices evolved in the late 1990s from suburban green-field initiatives to urban rehabilitation projects (Smith, 2002). The aims of urban planning in the knowledge economy are to promote variety of uses of the land, densification, new facilities, preservation of historic buildings and sustainable infrastructures, in order to increase the urban competitiveness while promoting quality of life (Pareja-Eastaway and Pique, 2011).
From the 1960s to the 1990s, local and regional governments developed technology parks in suburban areas, out of the cities, such as Sophia-Antipolis in France or the Research Triangle Park in North Carolina. However, since the 2000s, innovation-driven developments have been urban developments involving the Triple Helix Agents (government, universities and industry).
Since innovation is considered as one of the most crucial factors for competitiveness and success, urban plans increasingly involve initiatives to attract innovative companies and creative talent. Technological advancements launched the paradigm shift from mass production to knowledge-based production, which has profoundly altered socioeconomic systems. The transition to a knowledge-based economy is eliminating the barriers that formerly divided innovation from production, the laboratory from the factory, and is reorganising the whole production system. Alongside a technological paradigm shift that favours knowledge-based activities for economic growth, there is a preference shift from suburban working to urban working and living.
In order to enhance economic competitiveness, regional and municipal policymakers are developing measures to promote the shift from mass manufacturing to the knowledge economy and from the suburbs to the interior of the cities. Consequently, ID reflect how innovation is developed in urban areas.
Urban areas are the centres for economic and social development, and knowledge is a key factor driving city development. ID are the sites of one kind of knowledge precincts (Carrillo, 2006), that allow development of knowledge communities. The knowledge-based economy is decisive for urban spatial transformation like ID (Powell and Snellman, 2004). ID are the result of the contribution of Government, Industry and Universities to the urban, economic and social transformation (Pique et al., 2019) with different levels of leadership in the evolution of the ID. ID have become the localities of ‘knowledge community precincts’ (Carrillo, 2006), that is, spaces for knowledge generation and places for knowledge communities.
There are different types of innovation districts according to their purpose and the geographical context in which they are circumscribed. This study, following the analysis carried out by (Yigitcanlar et al., 2020), will include under the scope of “Innovation Districts”, terms such as “knowledge and innovation spaces”, ‘innovation clusters’ (Huggins, 2008), ‘innovation milieu’ (Evans and Hutton, 2009), “knowledge (community) precincts”, “innovation precincts” (Esmaeilpoorarabi et al., 2017), “Technopole” (Caves, 2013), and “Area of Innovation” (IASP, 2022) (International Association of Science Parks).
2.1 Knowledge-Based Urban Development
In 1995, Richard Knight argued the need for a new approach to explain the development of cities given the knowledge-based development of Innovation Districts. He defined Knowledge-Based Urban Development (KBUD) as “the transformation of knowledge resources into local development” (Knight, 1995: 225–226). Accordingly, (Sarimin and Yigitcanlar, 2012) included four dimensions in the KBUD: (1) Social and cultural development (e.g. housing, community facilities, education, social capital and knowledge workers); (2) economic development (e.g. RandD centres, knowledge-based companies and start-ups), (3) environment and urban development (e.g. green areas, green infrastructures – mobility, energy, waste, water – and green building); and (4) governance development (e.g. public and/or private bodies that manage urban transformation and the process of citizen participation).
Researchers have identified knowledge and creative talent, universities, IT infrastructures, real estate development and citizen decision-making as essential knowledge assets for cities of knowledge. Universities and research centres are critical assets for these knowledge cities as they are the backbone of a knowledge-based economy. In broader terms, knowledge assets in ID might also be considered the combination of both hard (tangible) and soft (intangible) assets.
In the urban development context, assets are defined as attributes of ID (Velibeyoglu and Yigitcanlar, 2010). Managing both the tangible (i.e., physical infrastructure and buildings such as transport, property and utilities) and intangible assets (i.e., knowledge, collaboration and creativity) contributes to the competitiveness of ID.
Pique et al. (2019) argue that ID need urban, economic and social transformation. Urban regeneration needs an integral approach, including (1) the infrastructure and urban dimension, (2) businesses and economic dimension, (3) talent and social dimension, and (4) governance dimension (Pique et al., 2019). For the Urban transformation each project needs: (1) an urban plan, (2) an infrastructure plan, and (3) a legal framework that allows the use of land for knowledge-based activities, and the attraction of real estate investors for retrofitting old buildings and creating new office and public spaces. As regards Economic transformation, ID need smart specialisations. This implies selecting (1) what sectors (clusters) to be developed and (2) what agenda range of technologies is needed for the value chains of innovation. For Social transformation: Talent is a key asset of the knowledge-based economy and society. Innovation districts must develop a strategy for talent (1) creation, (2) development, (3) attraction and (4) retention, and for providing enjoyable spaces in which to live and work. For Governance: The Triple Helix Agents play a key role in transformation and should create (1) hybrid organisations (public private partnership platforms) in order to (2) share the vision for the innovation district, and to (3) add actions to be developed across all dimensions of the project.
The present research focuses on urban areas. Urban area is here understood as a highly developed spatial form of cohesive cities. This phenomenon occurs when the associations of the Triple Helix Agents inside cities move from mainly competition to both competition and cooperation. Cities are highly integrated within an urban agglomeration, which renders the agglomeration one of the most important carriers for global economic development (Fang and Yu, 2017). The nature of cities as urbanised spaces can be traced back to the work of (Weber, 1958), whereby two aspects of the city are crucial, namely the economic and the political organisation. Economically defined, the “city is a settlement the inhabitants of which live primarily off trade and commerce rather than agriculture … the city is a marketplace” (Weber, 1958: 66–67). As regards the political dimension, “the city must … be considered to be a partially autonomous association, a community with special political and administrative arrangements” (1958: 74).
2.2 The Triple Helix Model
The Triple Helix model (Etzkowitz and Leydesdorff, 2000) describes that ecosystems of innovation are composed of three types of agents (1) Universities and Research Centres as a source of talent and technology for companies, (2) Industry combining mature companies with start-ups and investors, to create economic value, and (3) Government at different levels from local to regional and national developing legal frameworks, taxation and policy making, all of which stimulates research and innovation.
The university is a key infrastructure for innovation, providing trained talent, research results and knowledge to industry. Also, academia is a source of new ventures, founded on entrepreneurs and technologies originated at the university.
The role of each agent of the Triple Helix model (Government, Universities and Industry) is different depending on the dimension of the transformation (Pique et al., 2019). Government, at local, regional (state) and national (federal) levels plays a key role in transformation. Within the urban dimension, it defines the uses of land, the infrastructure plan, green spaces, and incentives for real-estate developers. Within the economic dimension it invests in research and technology, works to attract companies and promotes the creation of new start-ups and clusters, and creates conditions for pilots. Within the social dimension, it creates the conditions for living and working, including housing and schools. University is the key source of talent and technology and has far reaching impact across all dimensions. Within the urban dimension, universities develop land and buildings as anchor institutions (for research, teaching, incubation and residences). In the economic dimension, they provide science, technology, labs and entrepreneurs to the ecosystem. In the social dimension, they provide fresh talent to the district and experienced staff that will live in the district. Industry represents all the companies – of different sizes and sectors – in the area. In the urban dimension, the real estate companies develop and build new buildings and retrofit old ones for new proposals; utilities companies provide the key infrastructures; end users use the buildings and provide the return of investment. In the economic transformation dimension, large corporations, SMEs and new start-ups are clustered with universities and institutions, creating jobs and turnover. Lastly, in the social dimension, industry supplies the district with professionals and talent by means of internships and job creation. Thus, as noted by (Cai and Etzkowitz, 2020), despite positive progress in terms of theoretical underpinnings of the Triple Helix model, its explanatory power still has room for improvement through meso-level theories that have the capacity to connect both the macro and micro levels of analysis. When it comes to the coordination for developing the Triple Helix interactions, the core is to enable functional mechanisms mediating between top-down and bottom-up initiatives. In this way the innovation district development provides the context where we can examine these mechanisms.
The Quadruple Helix can add a fourth sphere, that is, the public and larger society (Carayannis and Campbell 2009). By acknowledging the role of the public in using, applying and generating knowledge, this formulation is conducive to the democratisation of knowledge production and innovation, as well as the impact of culture and creativity. Culture encompasses both diversity in terms of values, lifestyles and multiculturalism, and in terms of multilevel local, regional, national and global approaches. This diversity promotes creativity, a key component in spurring innovation and knowledge (Nikina and Pique, 2016).
As another driver of innovation, the Quintuple Helix adds the natural environment as a fifth sphere for knowledge and innovation models (Carayannis et al., 2012), thereby positioning sustainable development and social ecology as a component equivalent to the other four helices for knowledge production and innovation. Since socioecological concerns are incorporated as a key driver of innovation, this model is aimed at supporting the development of innovations and facilitating problem solving and sustainable development, while informed by multilateral interactions with the four other helices (Nikina and Pique, 2016).
In summary, the Triple Helix model of university-industry-government relations serves as both an illustration of and a roadmap for moving from linear knowledge flows to non-linear and interactive modes of innovation. The Quadruple Helix incorporates the viewpoints of civil society and media and culture-based publics while the ecologically sensitive Quintuple Helix adds the perspective of the natural environment.
The Triple Helix model has already been used for developing ecosystems of innovation. This paper aims to explore the role of the three agents in the performance indicators of urban, economic, social and governance factors of Innovation Districts. Accordingly, posit that a shared commitment to social responsibilities and sustainable goals helps align the interests and goals of Triple Helix actors. In doing so, civic engagement is crucial. The activation of a Triple Helix requires leadership by persons and organisations who have the respect of all the key players, with a recognition that the leadership role can move from one actor to another during their interaction.
Another approach of Triple Helix is proposed by (Ranga and Etzkowitz, 2013), defining the Triple Helix Spaces to characterise the proper areas of the Triple Helix actors to develop their functions: the knowledge space, innovation space and consensus space. It will help to understand the role of the Triple Helix Agent in the development of the innovation district.
3 Method and Data
This study starts with the multidimensional framework based on 4 dimensions (Table 1). The list of indicators is derived from:
-
A systematic review of scientific journal publications of the terms: ‘indicator’ and ‘performance assessment’. Developing the study with the keywords supplied in the theoretical framework section for innovation districts (‘Innovation Districts’, ‘District of Innovation’, ‘knowledge and innovation spaces’, ‘innovation clusters’, ‘innovation milieu’, ‘knowledge (community) precincts’, ‘innovation precincts’, ‘Technopole’, ‘Area of Innovation’).
-
Enriching this initial list with two articles that analyse two international case studies (22@Barcelona in Spain (Rapetti et al., 2022a) and Porto Digital in Brazil (Rapetti et al., 2022b)) that already provide indicators used in these cases.
This information was consolidated based on the above-mentioned sources and confronted by the IASP’s annual report (IASP Global Survey, 2018) to confirm that the measuring aspects proposed by research are also acknowledged as advantageous by practitioners.
Table 1 summarises the preliminary set of indicators.
The elements proposed in Table 1 are the potential main attributes for building a comprehensive framework to assess performance in Innovation Districts.

Multidimensional Performance Indicators Framework (Initial)
Citation: Triple Helix 10, 1 (2023) ; 10.1163/21971927-bja10040
A Fuzzy Delphi methodology was implemented to validate the relevance of the indicators proposed in Table 1. Seventeen experts in the field of Innovation Districts with multidisciplinary backgrounds from America, Europe, Asia and Africa were consulted to validate the most suitable attributes, represented by indicators, to define this framework.
The rationale for employing Fuzzy Delphi study as the corroboration method for the proposed performance attributes is as follows. First, there is limited empirical research on investigating and developing a holistic performance assessment framework for Innovation Districts. Second, the Fuzzy Delphi study is suitable for circumstances where there is limited resources and documents (Ruppert and Duncan, 2017). The Fuzzy Delphi method has proven to have accuracy levels comparable with the traditional Delphi method, even when rounds with experts are reduced to one by introducing the Fuzzy Set algorithm in the process.
After the selection of the best KPIs obtained by Fuzzy Delphi method, Multi-Criteria Decision Making (MCDM) DEMATEL was implemented to establish the level of influence among the indicators and to be able to predict how a measure taken in one indicator could affect another, helping the decision-making process. This methodology proposes one initial matrix, built up by the (n) indicators selected in the previous (Fuzzy Delphi) step and their relationships. And then facilitates the determination of the indicators that act as cause and the ones that are effect. Cause indicators directly influence effect indicators where the relationship established is strong.
The rationale for employing DEMATEL as the multi-criteria decision-making method is as follows. First, it effectively analyses the mutual influences (both direct and indirect effects) among different factors and understands the complex cause and effect relationships in the decision-making problem. Second, it can visualise the interrelationships between factors via an IRM (influential relationship map) and enable the decision maker to clearly understand which factors have mutual influences on one another. And third, the DEMATEL can be used not only to determine the ranking of alternatives, but also to find out critical evaluation criteria and measure the weights of evaluation criteria (Sheng-Li et al., 2018).
3.1 Fuzzy Delphi
3.1.1 Fuzzy Delphi Introduction
The Delphi method (DM) is a qualitative technique used to collect opinions of a panel of experts about a subject on which there is sparse scientific research to date. It was originally conceived in the 1950s by Olaf Helmer and Norman Dalkey of the Rand Corporation. This method allows forecasting by converging a possibility value through the feedback mechanism of questionnaire results, based on experts’ judgements. Some limitations of this methodology lie in: (1) Two or more repetitive surveys are likely to cause a decline in the response rate, which may produce negative effects in the ensuing analyses. (2) In general, as it is repeated, the survey becomes more costly and time-consuming (Ishikawa et al., 1993).
The Fuzzy Delphi Method (FDM) is the upgraded version of the classic DM. Improvement was made to rectify the limitation of the traditional DM that leads to low convergence in retrieving outcomes, and long progress of investigation (Saffie et al., 2016). Ishikawa and Bojadziev developed an algorithm whereby the introduction of Fuzzy Sets reduces the number of iterations to one, and the level of accuracy remains comparable with that obtained through traditional DM, which also reduces the time and cost of the process and the desertion of the experts in the survey, compared with those requiring more than one round (Ishikawa et al., 1993; Bojadziev and Bojadziev, 1999).
3.1.2 Fuzzy Delphi Description
The Fuzzy Delphi technique is based on the theory of fuzzy sets. Fuzzy sets theory is an extension of classical set theory that proposes that elements have varying degrees of membership. A logic based on two truth values is sometimes insufficient when describing human reasoning. Fuzzy Logic uses the whole interval between 0 (false) and 1 (true) to describe human reasoning. A Fuzzy Set is any set that allows its members to have different degrees of membership, called membership function, having an interval of [0,1].
If A is a universal set, then a fuzzy set of A is defined by triangular Membership Function ᶴ
Citation: Triple Helix 10, 1 (2023) ; 10.1163/21971927-bja10040
Where p, q and r are the triangular fuzzy numbers (TFNs) and represented as (p, q, r) (Singh and Sarkar, 2020).
The FDM proposes the definition of a linguistic scale for a better understanding of the scores assigned to every value analysed or question performed, and a set of three fuzzy numbers is associated with each linguistic option. The questionnaire with the linguistic options is then passed to the experts who provide their linguistic scale answers as shown in Table 2. The level of relevance of each indicator to assess performance in Innovation Districts is investigated by means of this linguistic scale.
Linguistic scale and Fuzzy Delphi number sets associated
Citation: Triple Helix 10, 1 (2023) ; 10.1163/21971927-bja10040
Source: (Singh and Sarkar, 2020)The processing of the linguistic responses and information gathered through consultation with experts is carried out in three stages:
Stage 1: Input of experts for each indicator is translated into fuzzy numbers. A fuzzy number related to the jth indicator provided by expert n is expressed as follow:
Citation: Triple Helix 10, 1 (2023) ; 10.1163/21971927-bja10040
Where n represents the number of the expert and m is the number of the indicator.
Stage 2: The fuzzy weights of indicator
Citation: Triple Helix 10, 1 (2023) ; 10.1163/21971927-bja10040
rj = max(rij) where i = 1, 2, 3, … n and j = 1, 2, 3, … m.
Stage 3: The mean method is implemented to defuzzificate the value Sj as follows:
Citation: Triple Helix 10, 1 (2023) ; 10.1163/21971927-bja10040
Finally, a cut off number is defined to indicate the point from which the indicators are accepted or rejected as relevant to assess performance in innovation areas.
A diagram of the complete methodological process is presented in Figure 1.
Fuzzy Delphi Methodological Process
Citation: Triple Helix 10, 1 (2023) ; 10.1163/21971927-bja10040
Fuzzy Delphi Panel of experts’ demographic information
Citation: Triple Helix 10, 1 (2023) ; 10.1163/21971927-bja10040
3.1.3 Fuzzy Delphi Experts Panel
A total of 30 experts in the field of Innovation Districts from Europe, America, Asia and Africa were contacted. Out of these 30 experts, 17 agreed to participate. All of them have or have had a leading role in Innovation Districts – leading role here being understood as Director, CEO or President, as well as having solid experience in the field. Backgrounds such as Innovation Systems, Urban and Economic Development, Engineering, Academia and Sociology were included among the experts consulted. Demographic information on the panel of experts is provided in Table 3.
3.2 DEMATEL
3.2.1 DEMATEL Introduction
The Geneva Research Centre of the Battelle Memorial Institute created the Decision-Making Trial and Evaluation Laboratory (DEMATEL) technique to depict the structure of complex causal interactions using matrices or digraphs (Sheng-Li et al., 2018). The DEMATEL technique can not only demonstrate the interaction between criteria, but also the direction of the relationship (Kumar and Dash, 2016).
This methodology has been used in a variety of settings, including marketing strategies, control systems, safety issues problems (Liou et al., 2008), the development of global managers’ competences, and group decision (Wu et al., 2010). Hybrid models that combine the DEMATEL and other methodologies have also been widely employed in a variety of domains, including e-learning evaluation (Tzeng et al., 2007), aviation safety measurement, and innovation policy portfolios (Hsuan-Shih et al., 2013). The advantages of the DEMATEL method are as follows: i) it is based on graph theory and simplifies the analysis of difficult problems through the use of a visualisation method; ii) it develops cause and effect relationships among different factors, making it easy to understand the mutual influence of the factors; and iii) this method can determine the strength of the relationships between or among the factors, which is not possible in other multi-criteria decision-making methods (Prashant et al., 2020).
3.2.2 DEMATEL Description
With an initial direct relation matrix, DEMATEL models the influences of system components. Influences from one component can spread to other components in a transitive manner, which is represented by elevating the initial direct relation matrix to powers. The overall influence is calculated by adding matrices of all powers and assuming that the matrix raised to the power of infinity will converge to zero.
The stages required in this method are described as follows:
Stage 1: The relationship matrices are built with the opinions of the experts. A panel of experts, with years of experience in the field of research, is consulted on the level of relationship between each indicator, using a linguistic scale presented in Table 4 to qualify the answers.
A non-negative matrix of the order of n x n as  where k indicates the number of experts with 1 ≤ k ≤ H, and n indicates the number of indicators.
Stage 2: The Average Matrix A is constructed with the inputs of all the experts and can be established as follow:
Citation: Triple Helix 10, 1 (2023) ; 10.1163/21971927-bja10040
Where k indicates the kth expert and H represents the total number of experts.
Stage 3: Matrix Average Matrix A is normalised to conform the matrix D:
Citation: Triple Helix 10, 1 (2023) ; 10.1163/21971927-bja10040
where
Citation: Triple Helix 10, 1 (2023) ; 10.1163/21971927-bja10040
And D must have the sum of each of its columns lower than 1 to be eligible for the DEMATEL technique (Kumar et al., 2017).
Stage 4: Calculate the Total Relationship Matrix (T)
Citation: Triple Helix 10, 1 (2023) ; 10.1163/21971927-bja10040
where I represents the Identity matrix.
Stage 5: Compute the factors r and c that will allow to establish cause and effect indicators as follows:
Citation: Triple Helix 10, 1 (2023) ; 10.1163/21971927-bja10040
Prominence = (r + c) and Relation = (r − c) for each indicator. Indicators that have a Relation number greater than 0 are considered cause factors, and indicators with a Relation number lower than 0 are considered effect factors. Cause indicators directly influence effect indicators where the relationship is strong.
Stage 6: A threshold number (
Citation: Triple Helix 10, 1 (2023) ; 10.1163/21971927-bja10040
Where N is the number of elements in matrix T.
The coefficients in the Total Relationship Matrix (T) which are higher than the threshold number compound a sub-matrix that represents the strongest relationships between indicators.
A diagram of the complete methodological processes is presented in Figure 2.
Fuzzy Delphi and DEMATEL Methodological Processes (Own Elaboration)
Citation: Triple Helix 10, 1 (2023) ; 10.1163/21971927-bja10040
3.2.3 DEMATEL Experts Panel
Out of the 17 experts who took part in the Fuzzy Delphi consultation, 8 were able to participate in the DEMATEL round. In addition, the invitation was extended to 7 more experts in the field of study, using the same criteria of selecting people with relevant backgrounds. All of them have or have had a leading role in Innovation Districts, leading role here being understood as Director, CEO or President, as well as having solid experience in the field. Backgrounds such as Innovation Management, Urban and Economic Development, Engineering, Academia, and Sociology were included among the experts that were consulted. Demographic information on the panel of experts is provided in Table 5.
DEMATEL Panel of experts’ demographic information
Citation: Triple Helix 10, 1 (2023) ; 10.1163/21971927-bja10040
4 Findings
4.1 Fuzzy Delphi
This research was built firstly to validate the relevance of 72 indicators identified to assess performance in Innovation Districts and to develop a comprehensive assessment framework. The Fuzzy Delphi method (discussed in Section 3) was implemented as an appropriate methodology to validate the level of relevance sought. The results of the FDM are presented in Table 6, where the ‘Defuzzification’ term represents the calculated mean of the scores assigned by the experts in relation to the degree of relevance to assess the performance of each indicator. The final assessment framework proposed to assess performance in Innovation Districts is presented in Table 7.
Fuzzy Delphi Results – Indicators accepted as relevant (Own Elaboration)
Citation: Triple Helix 10, 1 (2023) ; 10.1163/21971927-bja10040
DEMATEL Panel of experts’ demographic information
Citation: Triple Helix 10, 1 (2023) ; 10.1163/21971927-bja10040
The framework proposes 4 dimensions (Urban, Economic, Social and Governance) as fields to evaluate performance. The results show that the Governance and Economic spheres obtained the highest scores in relation to the mean average of their indicators.
37 indicators out of 72 were accepted. Out of these 37 indicators, 19 belong to the Economic dimension, 9 to the Urban dimension, and 6 and 3 indicators to the Social and Governance dimension respectively.
4.1.1 Economic Dimension
Within the Economic dimension, the indicators that measure the number of Jobs generated (E1) and the Investment in Start-ups (E18) in the area obtained the highest scores. Followed by the indicator measuring the number of Companies located in the district (E3), and within it, giving more importance to the visualisation of Knowledge-based Companies (E12). The number of Ventures Incubated (E17), Start-ups (E19) and Incubators (E16) also scored among the highest. (E31) Number of Clustered Companies, (E24) Innovation and Tech Events, (E30) Intellectual Property, (E32) Companies Clusterisation Type, (E9) Private Investment in Companies, (E23) Innovation Pilots, (E20) Turnover Start-ups, (E29) Publication in Scientific Journals, (E26) International Events, (E5) National Companies, (E7) Tax Exemptions and (E4) International Companies make up the final part of the list of accepted indicators, in descending order of score.
The indicators that did not receive a high enough score to be considered meaningful in the Economic dimension are summarised as follows: (E21) Co-working, (E14) Exporting Companies, (E15) Professional Events, (E2) Local Workers, (E8) Public Investment in Companies, (E10) Turnover All the District, (E28) Impact in Social Network, (E25) Local Events, (E11) Companies Using Digital Tools, (E22) Freelancers, (E6) Relocated Companies and (E27) Participation in Local Events.
4.1.2 Urban Dimension
Within the Urban dimension, the greatest importance was assigned to the indicators (U11) Available Floor Space and (U14) New Facilities, which measure the projected square metres for the development of facilities. (U2) Potential Floor, (U9) Constructed Buildings, (U1) Intervention Area, (U15) Degree of Occupancy, (U8) Real Estate Investment, (U12) New Locations and (U16) Construction Implementation Degree were also deemed relevant.
While the indicators Intervention Area (U1) and Potential Floor (U2) have been deemed relevant, the latter is of greater productivity and was thus assigned a slightly higher valuation compared to the indicator Intervention Area (U1).
The indicators: (U5) Fibre Optic, (U4) Connected Buildings, (U10) Renovated Buildings, (U13) Green Zones, (U7) Foreign Direct Investment, (U3) Urbanised Street and (U6) Wi-Fi Points were not considered as relevant enough to pass the threshold number.
4.1.3 Social Dimension
Within the Social dimension, the number of (S3) Universities and (S2) Research, Technology and Innovation Centres as well as the (S8) percentage of professionals in possession of a Higher Education Degree emerged as the indicators with the highest scores. Then, the (S20) number of people doing Internships, the (S9) percentage of International Workers in the district and (S13) the number of Social Activities and projects complete this set of selected indicators.
(S6) Students in District Universities, (S17) Professional Women in the District, (S18) Housing, (S4) Schools, (S10) Certified Professionals, (S11) Long-life Learning Programmes, (S15) Cultural Activities, (S1) Citizens, (S12) Students in Long-life Learning Programmes, (S7) Students of Primary and Secondary Schools, (S14) Persons in Social Events, (S5) Telecentres, (S19) Jobs Vocation, (S16) Cultural Venues have not reach the level set by experts.
4.1.4 Governance Dimension
Finally, within the Governance dimension, the (G2) District Management Team of Professionals indicator, which looks at the number of professionals on the district’s management team, had the highest score. This was followed by the quantification of (G1) the District Budget and (G5) the Indicators in Open Data.
The indicator District Management Team Professionals was among those rated with the highest score by all the experts.
4.2 DEMATEL Findings
After the Fuzzy Delphi method determined the 37 most relevant indicators, the DEMATEL method was applied, to establish the power of influence that one indicator has over another. The results obtained by the DEMATEL application are presented in the heat diagram in Table 8, where higher numbers (darker red on the graph) represent the indicators with a higher correlation.
Power of Influence among Indicators
Citation: Triple Helix 10, 1 (2023) ; 10.1163/21971927-bja10040
Table 9 shows the direction of the influences, specifying the indicators of cause and effect, and the threshold number to be considered a strong correlation.
Cause, Effect indicators & Threshold number
Citation: Triple Helix 10, 1 (2023) ; 10.1163/21971927-bja10040
Tables 9 shows that indicators in which the sum of their row coefficients is greater than the sum of their column are classified as mostly cause. Analogously, but in the opposite direction, indicators in which the sum of their column is greater than the sum of their row, are mostly influenced by others and for this reason they are mostly considered as an effect. In any case, the matrix information must be seen to determine the function (cause or effect) in relation to each indicator and its level of influence.
Following this idea, in the case of the main indicators of the economic sphere (Jobs (E1), Companies (E3) and Knowledge-based Companies (E12)), they are strongly influenced by each other, and by the urban sphere. Additionally, these indicators are identified as mostly effect indicators, this means, the indicator is a consequence of the others. The Universities indicator is shown to have a significant transversal influence, meaning it impacts significantly over several indicators in different spheres. All Governance indicators present a strong impact over the main economic ones (Jobs (E1), Companies (E3), Private Investment in Companies (E9), Knowledge-based Companies (E12), Start-ups (E19), Innovation Pilots (E23), Innovation and Tech Events (E24), International Events (E26), Publication in Scientific Journals (E29), Intellectual Property (E30)). Particularly, Knowledge-based Companies (E12) is sensitive to most of the indicators classified as cause indicators, this means it could be affected by a decision taken in many areas.
Additionally, Tax Exemptions (E7), Internships (S20) and Publications in Scientific Journals, although they are considered measures of relevance, show a certain autonomy in the results, since they do not have a strong influence on the other indicators, nor do they affect them significantly.
5 Discussion
Innovation Districts are metropolitan zones with a high concentration of technology enterprises, research institutes, specialised scientific organisations, and technology transfer support platforms. It is therefore critical that ID have a tool that not only assists them in directing their efforts and activities toward developing these urban innovation ecosystems, but also ensures that those actions lead the district to its goal over time.
The goal of this research is to first establish and test a complete framework for assessing performance in innovation districts using indicators. Second, to determine the level of influence between the indicators, allowing this to have a wide perspective of all the dimensions and actors essential to the growth of these regions, from the conception stage to the maturity of the district, and to assist decision making.
5.1 Indicators’ Relevance
5.1.1 Economic Dimension
When discussing the indicators of the Economic dimension, the four indicators with the highest scores were Jobs (E1), Investment in Start-ups (E18), Companies (E3) and Knowledge-based Companies (E12). As a consequence, it is possible to recognise an emerging need to identify and weigh those indicators that demonstrate the differential characteristics of these different types of districts. This means signs that shape the identity of these locations and provide them with a distinct value. For example, it is not only interesting to know the number of companies located in the district, but also to know how many of them are Knowledge-based (E12) (differential value). Even when private investment in firms is of interest in the investment industry, it is far more useful to know what type of companies are being encouraged, with a concentration on Start-ups (E19) (differential value). Consistent with the above, Innovation Pilots (E23) was deemed an essential indicator for understanding as it demonstrates: first, the actual activity of what an innovation area is; second, that innovation works; third, that it has an impact on the territory and that it produces exchanges. Additionally, the clustering of businesses (E31) was deemed a very effective technique for developing an innovation area, and as such it was given a high ranking. Furthermore, the existence of unique clusters (E32) is included into the district’s plan, guiding the district’s speciality (Differential Value).
On the other hand, although the impact on the specific territory is of interest, Local Worker (E2) was not valued with high criteria, since it could be considered relevant that employment be generated, but whether these jobs are occupied by local people or international people, it is not considered a relevant criterion to assess performance in Innovation Districts. Because a person from outside that comes to work in the area and stays for years or even settles there also generates an impact on the local territory. When discussing Relocated Companies (E6), they were not recognised as a meaningful indicator to evaluate performance, because whether new companies are generated or arrive from outside, the main element is the existence of companies, and what matters is the quality of the firm, whether it is generated or relocated. Moreover, it is also critical to distinguish between public and private investment because public money is required in the early stages of development to construct a quality innovation system for private investment in later stages of development. Infrastructure development is linked to public investment. As a result, private investment is attracted to create the service layer on the infrastructure layer.
In terms of Companies Using Digital Tools (E11), they are now considered basic, not as a differentiating value, because all competitive companies use them, so it was no longer a relevant indicator. This could be because organisations that do not employ digital tools are not directly involved in the innovation process.
When discussing the Companies with Quality Certification (E13), it can be said that they are viewed as a measure that is strongly dependent on national legislation and criteria. Despite the fact that there are international standards and that each company must adapt to what the market requires in its segment, it is not regarded as a differentiating factor for evaluating innovation performance.
On the other hand, although the results show that an indicator that measures the number of Incubators (E16) must exist, an additional study could be established to ensure that the products developed by them have commercial value. As a result, while this indicator was accepted, Ventures Incubated (E17) received a slightly higher score.
Additionally, the Investment in Start-ups (E18) was deemed extremely important since it is being invested in a business opportunity, and the mere existence of the investment ultimately determines whether the business would be successful or not. Moreover, keeping control of the number of Start-ups (E19), even if this was accepted, could only be regarded as essential if something productive is done with them. Considering a supplemental measure that governs their concurrent level of achievement could be subject to analysis in future research. Finally, in the field of start-ups, the Turnover of Start-ups (E20) was not considered relevant for understanding as, while it may not be high in the first stages, does not necessarily show a failing business.
5.1.2 Urban Dimension
Similar circumstances surround the Urban dimension’s indicators. Higher ratings were given to: Available Floor Space (U11), New Facilities (U14), Potential Floor (U2), Intervention Area (U1) and Degree of Occupancy (U15). It is relevant to note that while it is important to know how much space is available to build or use as an office in the district (Potential Floor and Available Floor Space, respectively), it is more important to identify how much of this space is dedicated to New Facilities, which are spaces dedicated to special activities such as business incubators and other functions that distinguish the district from others (Differential Value). The facilities are regarded as the primary source of productivity in these areas; hence their monitoring is crucial. In addition, the measurement of New Facilities, which is an indicator of future client and company potential, is seen as vital.
When discussing the indicator that measures the kilometres of Urbanised Streets (U3), the results showed that it is regarded as a basic means rather than an end, something that must be done from the ground up of every district, with no differential value to evaluate performance. Something analogous happened with the types of connections: the kilometres of Fibre Optic cables (U5) received a higher score than the Connected Buildings indicator (U4), although it is still considered basic and is not weighted to measure performance. A similar scenario occurs for the number of Wi-Fi Points indicator (U6), which was not accepted as relevant either, since these are basic features that must always be present, but do not confer a differential character.
In terms of investment, it can be said that it is relevant in general, not necessarily because it is foreign or local, and thus the kind of investment, Foreign Direct Investment (U7) is rated moderately in general, and it has not exceeded the cut-off level to differentiate between national and international investment, therefore these indicators were discarded.
When it comes to Constructed Buildings (U9), when this is done well and with a focus on the type of company or centre (client) planned in the area, it gains prominence because it represents well-equipped buildings.
In relation to the New Locations (U12) indicator, it was qualified or categorised as really relevant. Beyond the initial projection that can be made, given the long-term nature of these projects, a static forecast at the start is extremely difficult to get right. Purchasing these places for expansion too early (by locking in a current land value) risks robbing other investments of funds. However, running out of space, having a need to develop, and not planning for it is a costly mistake. As a result, the indicator New Locations is seen as complex, yet strategically important to account for.
Moreover, when analysing the results obtained by the Green Zones (U13) indicator, it can be said that they are extremely significant in any district. However, the concept has become naturalised, and depending on the location of the district, it may be more important. Nonetheless, this area has been fading as a measure of measuring performance in Innovation Districts, despite the fact that its creation is not excluded for this purpose and the validity of its value is maintained.
To conclude, the Degree of Occupancy (U15) shows the space available for future companies to come and the need for more investment in new building.
5.1.3 Social Dimension
The Social dimension exhibits or presupposes a similar situation; the difference in value of this type of district in the social field rests in the presence of Centres that enable the growth of technology and innovation, as well as the performance of qualified personnel in these surroundings. For this reason, the linked indicators, Universities (S3), Research, Technology and Innovation Centres (S2), as well as the percentage of professionals with advanced Degrees (S8) and Internships (S20), received the highest marks. Social Activities (S13), on the other hand, are weighted as long-term positive effect initiatives. Intangibles, which generate the most value, function better in a social activity than in a professional one, and their evaluation is regarded as a means of ensuring their development. It is also noteworthy to examine how various indicators that were included in Districts of Innovation like 22@Barcelona, such as Housing (S18), Students in the District’s Universities (S6), and Citizens (S1), were eliminated by experts after the FDM since they were deemed irrelevant to assess performance. As previously said, the social component (Number of dwellings) is crucial in these instances for the recruitment and retention of talent, but experts were divided as to whether the resources to serve these social demands should be located in the innovation area or nearby. Because there is agreement on the importance of these factors’ existence, their evaluation within the district can be considered as a way to ensure their continuous development.
5.1.4 Governance Dimension
The governance dimension has very few indicators (in comparison to the other dimensions), but with very high scores (impact). This may illustrate the significance of having a competent management group, but the effectiveness of its actions is judged in terms of benefits obtained rather than input. In other words, if measurement, control and monitoring are viewed as the first steps in ensuring that an activity works as expected, in terms of governance, it will be interesting to ensure first: that there is a governance (G2), second, that the number of human resources dedicated to governance is competent and sufficient (in quantity) to respond to the needs of the district (G2), and third, that the economic resources are adequate (G1). Other performance consequences of governance acts are measured in the previous dimensions’ indicators already mentioned.
To conclude, each type of innovation district may place a higher focus or value on specific measures than others. However, this is a comprehensive framework that strives to provide a broad foundation, and with this broad set, secondary decisions based on the district’s specific typology can be made. Likewise, the varying goals based on the physical or economic sizes of innovation districts are not differentiating criteria for the selection of indicators, because what matters here is the value of the data provided by the indicator.
5.2 Indicators’ Relationships
Concerning the level of impact between indicators in each dimension, it is crucial to consider how a modification to one indicator may affect (improve or deteriorate) the measurement of another, which may also be applied in reverse. This refers to using knowledge of interdependencies to decide on one action, knowing that it would ultimately benefit another.
5.2.1 Urban Dimension
When contemplating the urban dimension, it was possible to see that it contains mostly cause indicators. Real Estate Investment (U8) and Construction Implementation Degree (U16) are the biggest cause indicators in this dimension, notably influencing the indicators that measure the number of Jobs (E1) and the number of Knowledge-based Companies (E12), which have direct effects on economic activity. Beyond the role of real estate investment in stimulating the economy, it is important to note that since the focus in these Innovation Districts, in the urban dimension, is on the development of hard factors to attract Knowledge-based Companies (E12), new Ventures (E17), and trained individuals (S8), Real Estate Investment (U8) is directly linked to the attraction and retention of qualified talent. Following this pattern of cause indicators is the Potential Floor indicator (U2), which describes the area available for construction and is closely linked to the Constructed Buildings indicator (U4). In addition, the Available Floor Space (U11) may be seen as a result of the Constructed Buildings (U4) and New Locations (U12) and concurrently impact the Occupancy (U15).
5.2.2 Economic Dimension
The majority of economic dimension indicators are effect indicators. Jobs (E1), Private Investment (E9), and Knowledge-based Companies (E12) are the indicators most influenced by other metrics. In the case of Jobs, the creation of Start-ups (E19) and the number of Universities (S3) have the greatest impact. The number of Knowledge-based Companies (E12), Incubators (E16), Universities (S3) and Start-ups (E19) has a direct and strong relationship with Private Investment (E9). Indicating that private investment will increase if any of these variables is increased. Incubators (E16), Incubated Ventures (E17) and Start-ups Investment (E18) are the most commonly cited as causes of other indicators. This is because the greater the number of incubators, incubated ventures and start-ups funding, the greater the number of start-ups and private investment in the district’s enterprises. Alternatively, the Number of Clustered Companies (E31) and the Number of Cluster Types (E32) are determinants in the attractiveness of companies to the district; hence, if the cluster is already mature, the district will be more attractive to new corporations. According to the data, the Turnover of Start-ups (E20) can be considered a strong cause of other indicators such as Jobs (E1) and Investment in Start-ups (E18). This could be explained by the fact that the larger the return on investment of a business (start-ups), the bigger the number of jobs it could create, and these enterprises are therefore more appealing to investors.
5.2.3 Social Dimension
The bulk of social dimension indicators are effect indicators, with the exception of Universities (S3) and Higher Education Degrees indicator (S8), which influence employment (E1) as they are the source of educated people. In contrast, the Research, Technology, and Innovation Centres indicator (S2) has a greater level of both effect and cause factors, as it promotes Knowledge-based Companies (E12) and Intellectual Property (E30) and is the result of the number of Universities (S3) and International Companies (E4) locating their Innovation Centres in the district (S2).
5.2.4 Governance Dimension
Indicators of the governance dimension are predominantly cause indicators since they provide the necessary cash (G1) and staff (G2) for the district’s development. They primarily influence economic indicators such as Employment (E1), Companies (E3), Private Investment (E9) and Knowledge-Based Companies (E12). This is because the district management team determines the terms of engagement for these participants and directly encourages or discourages their development within the Innovation District.
5.3 Triple Helix Actors
5.3.1 The Role of Government
According to the majority of different actors in the development of an ID, it is observed that the government should play a leading role at the start of the district’s evolution, especially in urban planning, defining the Intervention Area (U1) and the Potential Floor (U2) and the development of infrastructures, facilitating the legal processes for Constructing Buildings (U9), and sending messages of transparency and legal stability to Real Estate developers (U8). In later phases, the government should investigate New Locations (U12) when there is a high level of Construction Implementation (U16) and the level of Occupancy (U15) satisfies the demand for buildings or other urban regeneration zones. In addition, the government promotes the development of the district with amenities to increase the area’s appeal. This illustrates that the government’s ability to take action is predominately urban. Student housing, hotels and residences are significant difficulties that did not pass the Fuzzy Delphi filter.
Government is also the primary agent for early-stage social development; hence, efforts should also focus on expanding and enhancing the number of Universities (S3) and Research, Tech and Innovation Centres (S2). Additionally, it provides New Facilities (U14) as hard variables for students with the number of Universities (S3) (differential value), schools and hospitals.
In terms of Governance, the government should allocate and mobilise resources for the District’s development (G1), forming organisations or units. Open Data (G5) strategies can support the formation of new businesses in the district.
5.3.2 The Role of Academia
Concerning the function of academic institutions, their initial contribution consisted mostly of supplying the appropriate talent and technology to make the location desirable.
Indicators pertaining to Universities (S3) are mirrored in the social dimension and quantified by a collection of indicators pertinent to providing talent from Internships (S20) to those with a Higher Education Degree (S8) (differential value). On the other hand, universities provide technology, originated from Research, Technology and Innovation Centres (S2) (differential value), Publications in Scientific Journals (E29) (differential value), and Patents and Intellectual Property (E30) to protect innovative ideas and businesses (differential value).
Universities play a crucial role, encouraging Innovation, Tech, and Entrepreneurial Events (E24) and offering facilities such as Incubators (E16) in order to develop Ventures Incubated (E17) and assist them in securing funding (E18) in order to grow (E20).
5.3.3 The Role of Industry
Industry is responsible for the Construction of Buildings (U9) and its Implementation Degree (U16) in the Urban dimension, operating as Real Estate Investors (U8).
Having a vital role in the economy, Companies (E3), National Companies (E5) or International Companies (E4) will fill offices with enterprises (U15) that create new Jobs (E1). Innovation Districts will be distinguished by their Knowledge-based Companies (E12) (differential value).
These companies participate in the entrepreneurial ecosystems, which stimulates the creation of Start-ups (E19) (differential value), attracts venture capital (E18) (differential value), and contributes to corporate innovation and the formalisation of the innovation ecosystem.
6 Conclusions
Innovation districts are becoming an increasingly favourable breeding ground in urban spaces for the development of technology and inventive solutions that address current concerns and enhance the economic ecosystem through knowledge. However, there is a dearth of research that contributes to the evaluation of the performance of these spaces, as a means of ensuring their development in the desired direction and within the allotted timeframe. Although various indicators at the conceptualisation stage, such as placement and innovation district classification, have been analysed, there is still a lack of comprehensive and holistic frameworks to assess innovation districts effectively. This study aimed to build and validate a complete framework to give researchers and decision-makers a valuable instrument.
After discussing the results, several conclusions can be drawn:
First, a framework was established with a multidimensional perspective constituted of four dimensions (‘Urban’, ‘Economic’, ‘Social’, and ‘Governance) and 37 indicators (9 belong to the Urban dimension, 19 to the Economic dimension and 6 and 3 to Social and Governance respectively). The Economic dimension proved to be the most helpful, both in terms of score and number of acceptable indicators, while the Governance dimension produced few accepted measures but high rated. The Urban and Social dimensions obtained intermediate values in terms of both the number of indicators and the scores, but they are intensively considered by experts at various stages of the district’s evolution (urban indicators) and as a means to attract and retain the qualified talent that is so crucial in this type of ecosystem (social indicators).
Second, the interdependencies between each dimension’s indicators can now be expressed. Highlighting the importance of determining how a change to one indicator may affect (increase or decrease) the value of another indicator. This refers to employing a knowledge of interdependencies to make a decision on an action in advance, knowing that it will ultimately benefit another party. Examining the Urban component revealed that it represented the majority of cause indicators. The majority of indicators of the Economic dimension are effect indicators. The remainder of the Social dimension indicators are effect indicators, with the exception of universities and higher education degrees, which impact employment as the source of educated individuals.
Third, it can be determined from this study that Triple Helix Agents function in each dimension from their perspective, but that all agents must activate the indicators to produce an urban, economic and social transformation:
The role of the Government is crucial in the Urban dimension, with the Intervention Area (U1) and the Potential Floor (U2), and allowing the Construction of Buildings (U9), for developers’ Real Estate Investment (U8). In the Economic dimension, the Government can use Tax Exemptions (E7), promote Urban Clusters (E31), activate the entrepreneurial ecosystem with Incubators (E16) incubating new Ventures (E17), and provide urban labs for Innovation Pilots (E23). The Government can act by promoting the establishment of Universities (S3) and Research, Tech and Innovation Centres (S2) in the ID and developing New Facilities (U14) in the Social dimension. Government also should allocate resources for the District (G1), create hybrid organisations for the Management of the District (G2) and develop strategies of Open Data (G4).
The role of Universities, and their primary contribution, is to provide the necessary talent and technology to make the area more attractive. The impact of Universities (S3) is measured through a set of indicators that are relevant for providing talent and, on the other hand, providing technology, also coming from Research, Technology and Innovation Centres (S2). Universities also play a key role in promoting Tech and Entrepreneurial Events (E24) and providing facilities like Incubators (E16) in order to incubate new Ventures (E17), helping them to find Investment (E18) and increasing Turnover (E20).
The role of Industry impacts all the dimensions. In the Urban dimension, Industry is responsible for the Construction of Buildings (U9) (U16) and infrastructure, acting as Real Estate Investors (U8). Moreover, as key players in the economy, Companies (E3), National Companies (E5) or International Companies (E4) will fill the offices with firms (U15), creating new Jobs (E1). Knowledge-based Companies (E12) will be the differentiating factor of Innovation Districts. These companies contribute to innovation ecosystems by interacting with Start-ups (E19) and venture capital Investment attraction (E18). In the case of Civil Society, its role focuses on cultural development and the organisation of extra-professional Social Activities (S13). Involving people, local and International Workers (S9), was seen as critical to ensuring success; therefore, their participation began to be measured and also used as a strategy to monitor if the planning of housing and services was sufficient or required further investment to meet demand.
Futures research lines can focus on understanding and evaluating the actions and activities of Triple Helix Agents for impacting performance indicators. Also, it could be interesting to analyse the System Dynamics of the components of an ID in order to simulate more accurately the impact of the indicators. Lastly, an analysis of the sources of data for performance indicators will be needed to understand how to implement a Performance Indicators Assessment.
Supplementary Material
A larger version of Table 8 is available online at: https://doi.org/10.6084/m9.figshare.23146064.
References
Adu-McVie, A., Yigitcanlar, T., Erol, I. and Xia, B., 2021. Classifying innovation districts: Delphi validation of a multidimensional framework. Land Use Policy 111.
Amin, A., 1994. Post-Fordism: A Reader. Oxford: Blackwell.
Atkinson, R., 2004. The evidence on impact of gentrification new lesson for urban renaissance. European Journal of Housing Policy 4(1): 107–131.
Aydalot, P. and Keeble, D., 1988. High Technology Industry and Innovative Environments: The European Experience. London: Routledge.
Becattini, G., 1962. Il sistema marshalliano. In Il Concetto di Industria e la Teoria del Valore. Turın: Boringhieri: G. Becattini, 88–125.
Becattini, G., 2004. From the Marshallian industrial district to contemporary ‘district theory’. A brief critical review. Investigaciones Regionales 1: 9–32.
Bellandi, M. and De Propris, L., 2015. Three Generations of Industrial districts. Journal of Regional Research 32: 75–87.
Belussi, F. and Caldari, K., 2009. At the origin of the industrial district: Alfred Marshall and the Cambridge school. Cambridge Journal of Economics 32(2): 335–355.
Bojadziev, G. and Bojadziev, M., 1999. Fuzzy Logic for Business, Finance and Management. Word Scientific Pub.
Bugliarello, G., 2004. Urban knowledge parks, knowledge cities and urban sustainability. International Journal of Technology Management 28(3–6): 338–394.
Cai, Y. and Etzkowitz, H., 2020. Theorizing the Triple Helix model: Past, present, and future. Triple Helix Journal 7: 1–38.
Caird, S., Hudson, L., and Kortuem, G. (2016). A Tale of Evaluation and Reporting in UK Smart Cities. Buckinghamshire, UK: The Open University.
Camagni, R., 1995. The concept of innovative milieu and its relevance for public policies in European lagging regions. Papers in Regional Science 74(4): 317–340.
Carayannis, E. and Campbell, D., 2009. Mode 3’ and ‘Quadruple Helix’: toward a 21st century fractal innovation ecosystem. International Journal of Technology Management 3–4(46): 201–234.
Carayannis, E., Barth, T. and Campbell, D., 2012. The Quintuple Helix innovation model: global warming as a challenge and driver for innovation. Journal of Innovation and Entrepreneurship 1(1): 1–12.
Carrillo, F., 2006. Knowledge cities: Approaches, experiences and perspectives. New York: Routledge.
Carrillo, J., Yigitcanlar, T., Garcia, B. and Lönnqvist, A., 2014. Knowledge and the City: Concepts, Applications and Trends of Knowledge-Based Urban Development. New York: Routledge.
Castells, M., 1989. The Informational City: Information Technology, Economic Restructuring, and the Urban-regional Process. Oxford: Blackwell.
Caves, R., 2013. Encyclopedia of the City. 1st ed. New York: Routledge.
Chichilnisky, G., 1998. The knowledge revolution. Journal of International Trade and Economic Development, 1(7): 39–54.
Cooke, P. and Morgan, K., 1994. The regional innovation system in Baden-Württemberg. International Journal of Technology Management 9: 394–429.
Cooke, P., Uranga, M. and Etxebarria, G., 1997. Regional innovation systems: Institutional and organisational dimensions. Research Policy 26(4–5): 475–491.
Cooke, P., 2001. Regional innovation systems, clusters, and the knowledge economy. Industrial and Corporate Change 10(4): 945–974.
Costa, P., Magalhaes, M., Vasconcelos, B. and Sugahara, G., 2008. On ‘creative cities’ governance models: a comparative approach. The Service Industries Journal 28(3): 393–413.
Czamanski, S. and Augusto de Q. Ablas, L., 1979. Identification of industrial clusters and complexes: A comparison of methods and findings. Urban Studies 16: 61–80.
Dameri, R. (2017). Smart City Definition, Goals and Performance. En Smart City Implementation. Switzerland: Springer International Publishing, 1–22.
Derqui, B., Grimaldi, D. and Fernandez, V., 2020. Building and managing sustainable schools: The case of food waste. Journal of Cleaner Production.
Drucker, P. F., 1998. The discipline of innovation. Harvard Business Review 76(6) 149– 157.
Engel, J. S., 2022. Global clusters of innovation: Entrepreneurial engines of economic growth around the world. Edward Elgar Publishing.
Esmaeilpoorarabi, N., Yigitcanlar, T. and Guaralda, M., 2017. Place quality in innovation clusters: An empirical analysis of global best practices from Singapore, Helsinki, New York, and Sydney. Cities.
Esmaeilpoorarabi, N., Yigitcanlar, T., Guaralda, M., Kamruzzaman, Md., 2018a. Does place quality matter for innovation districts? Determining the essential place characteristics from Brisbane’s knowledge precincts. Land Use Policy 79: 734–747.
Esmaeilpoorarabi, N. and Kamruzzaman, M., 2018b. Evaluating place quality in innovation districts: A Delphic hierarchy process approach. Land Use Policy 76: 471–486.
Esmaeilpoorarabi, N., Yigitcanlar, T., Kamruzzaman, M. and Guaralda, M., 2020. How can an enhanced community engagement with innovation districts be established? Evidence from Sydney, Melbourne and Brisbane. Cities 96(102430).
Etzkowitz, H. and Leydesdorff, L., 2000. The dynamics of innovation: from National Systems and “Mode 2” to a Triple Helix of university-industry-government relations. Research Policy 2(29): 109–123.
Evans, G. and Hutton, T., 2009. Creative cities, creative spaces and urban policy. Urban Studies 46: 1003–1040.
Fang, C. and Yu, D., 2017. Urban agglomeration: An evolving concept of an emerging phenomenon. Landscape and Urban Planning 162: 126–136.
Florida, R., 2002. The Rise of the Creative Class: And How It’s Transforming Work, Leisure, Community, and Everyday Life. New York: Basic Book.
Florida, R., Adler, P. and Mellander, C., 2017. The city as innovation machine. Regional Studies 51(1): 86–96.
Freeman, C., 1995. The ‘national system of innovation’ in historical perspective. Cambridge Journal of Economics 19(1): 5–24.
Gospodini, A., 2006. Portraying, classifying and understanding the emerging landscapes in the post-industrial city. Cities 23(5): 311–330.
Hall, P., 1997. The Future of the metropolis and its form. Regional Studies 31(3): 11–220.
Hsuan-Shih, Lee, Gwo-Hshiung, Tzeng, Weichung, Yeih, Yu-Jie, Wang, Shing-Chih, Yang. 2013. Revised DEMATEL: Resolving the Infeasibility of DEMATEL. Applied Mathematical Modelling 37: 6746–6757.
Huggins, R., 2008. The evolution of knowledge clusters: progress and policy. Economic Development Quarterly 22: 277–289.
Hutton, T., 2000. Reconstructed production landscapes in the postmodern city: applied design and creative services in the metropolitan core. Urban Geography 21(4): 85–317.
Hutton, T., 2004. The new economy of the inner city. Cities 21(2): 89–108.
IASP, 2022. International Association of Science Parks. Available at: http://www.iasp.ws (accessed 29 May 2022).
IASP, 2018. IASP General Survey 2018: Science and technology parks and areas of innovation throughout the world. Available at: https://www.iasp.ws/our-industry/knowledge-room/iasp-general-survey-2018--science-and-technology-parks-and-areas-of-innovation-throughout-the-world (accessed May 2022)
Isard, W., 1960. Methods of Regional Analysis: An Introduction to Regional Science. Cambridge: MA: MIT Press.
Isard, W. a. E. S., 1959. Industrial complex analysis, agglomeration economies and regional development. Journal of Regional Science 1(2): 19–33.
Ishikawa, A., Amagasa, M., Shiga, T., Tomizawa, G., Tatsuta, R., and Mieno, H., 1993. The max-min Delphi method and fuzzy Delphi method via fuzzy integration. Fuzzy Sets and Systems 55(3): 241–253.
Jacobs, J., 1961. The Death and Life of Great American Cities. New York: Random House.
Jensen-Butler, C., Sharchar, A. and Van Weesep, J., 1997. European Cities in Competition. Aldershot, Ashgate.
Katz, B. and Wagner, J., 2014. The Rise of Innovation Districts, Washington: Brookings Metropolitan Policy Program.
Knight, R., 1995. Knowledge-based development: policy and planning implications for cities. Urban Studies, 32(2): 225–260.
Kumar, A. and Dash, M., 2016. Using DEMATEL to construct influential network relation map of consumer decision-making in e-marketplace. Int. J. Bus. Inf. Syst 21(48).
Kumar, A., Kaviani, M., Hafezalkotob, A. and Zavadskas, E., 2017. Evaluating innovation capabilities OF real estate firms: a combined fuzzy delphi and DEMATEL approach. International Journal of Strategic Property Management. 21: 401–406.
Landry, C., 2000. The Creative City: A Toolkit for Urban Innovators. London: Earthscan.
Lever, W., 1999. Competitive cities in Europe. Urban Studies 36(5–6): 1029–1044.
Lever, W., 2002. Correlating the knowledge-base of cities with economic growth. Urban Studies 39(5–6).
Liou, J., Yen, L. and Tzeng, G., 2008. Building an effective safety management system for airlines. Air Transp. Manage. 14: 20–26.
Lönnqvist, A., Käpylä, J., Salonius, H. and Yigitcanlar, T., 2014. Knowledge that matters: identifying regional knowledge assets of the Tampere region. European Planning Studies 22(10): 2011–2029.
Lundvall, B., 1992. National Systems of Innovation: An Analytical Framework. London: Pinter.
Lundvall, B., 2007. National innovation systems – analytical concept and development tool. Industry and Innovation 14(1): 95–119.
Maillat, D., 1991. The innovation process and the role of the milieu. In: G. M. a. F. T. E. Bergman, eds. Regions Reconsidered: Economic Networks, Innovation, and Local Development in Industrialized Countries. London: Mansell, 103–117.
Maillat, D., 1998. Innovative milieux and new generations of regional policies. Entrepreneurship and Regional Development. 10(1): 1–16.
Marcotullio, P., 2003. Globalisation, urban form and environmental conditions in Asia-Pacific. Urban Studies 40(2): 219–247.
Marshall, A., 1920. Principles of Economics. London: Macmillan.
McMichael, A., 2000. The urban environment and health in a world of increasing globalization. Bulletin of the World Health Organization 78(9): 1117–1126.
Morgan, K., 1997. The learning region: institutions, innovation, and regional renewal. Regional Studies 41(S1): S147–S159.
Morisson, A., 2020. A framework for defining innovation districts: Case study from 22@ Barcelona. In Urban and Transit Planning: A Culmination of Selected Research Papers from IEREK Conferences on Urban Planning, Architecture and Green Urbanism, Italy and Netherlands (2017). Springer, 185–191.
Nelson, R. R., 1993. National Innovation Systems: A Comparative Analysis. New York: Oxford University Press.
Nikina, A. and Pique, J., 2016. Areas of Innovation in a Global World: Concept and Practice. Málaga (Spain): IASP – International Association of Science Parks and Areas of Innovation.
Orii, L., Alonso, L. and Larson, K., 2020. Methodology for establishing well-being urban indicators at the district level to be used on the cityscope platform. Sustainability 12(9458).
Pancholi, S., Yigitcanlar, T., and Guaralda, M. (2015). Place making facilitators of knowledge and innovation spaces: Insights from European best practices. International Journal of Knowledge-Based Development 6(3): 215–240.
Pareja-Eastaway, M. and Pique, J., 2011. Urban regeneration and the creative knowledge economy: The case of 22@ in Barcelona. Journal of Urban Regeneration and Renewal 4(4): 319–327.
Pique, J. M., Miralles, F., Teixeira, C. S., Gaspar, J. V., and Filho, J. R. B. R., 2019. Application of the triple helix model in the revitalisation of cities: the case of Brazil. International Journal of Knowledge-Based Development 10(1): 43–74.
Porter, M., 1990. The competitive advantage of nations. Harvard Business Review 68(2): 73–93.
Porter, M., 1998. Clusters and the new economics of competition. Harvard Business Review 76(6): 77–90.
Powell, W. and Snellman, K., 2004. The knowledge economy. Annual Review of Sociology 30: 199–220.
Prashant, Singh, K. and Prabir, S., 2020. A framework based on fuzzy Delphi and DEMATEL for sustainable product development: A case of Indian automotive industry. Journal of Cleaner Production 246.
Pratt, A., 2008. Creative cities: the cultural industries and the creative class. Geografiska Annaler, Series B: Human Geography 90(2): 107–117.
Ranga, M. and Etzkowitz, H., 2013. Triple Helix systems: an analytical framework for innovation policy and practice in the knowledge society. Industry and Higher Education 4(27): 237–262.
Rapetti, C., Pique, J., Pareja-Eastaway, M. and Grimaldi, D., 2022a. Understanding the development of innovations districts through indicators – 22@Barcelona Case. Journal of Evolutionary Studies in Business 7(2): 6–39.
Rapetti, C., Pique, J., Berbegal-Mirabent, J. and Figlioli, A., 2022b. Performance indicators for the evolution of areas of innovation – Porto digital case. Journal of Evolutionary Studies in Business. 7(2): 219–267.
Ruppert, J. and Duncan, R., 2017. Defining and characterising ecosystem services for education: a Delphi study. J. Res. Sci. Teach 54: 737–763.
Saffie, N., Shukor, N. and Rasmani, K., 2016. Fuzzy Delphi Method: Issues and Challenges. Sidney, IEEE – Institute of Electrical and Electronics Engineers.
Sarimin, M. and Yigitcanlar, T., 2012. Towards a comprehensive and integrated knowledge-based urban development model: status quo and directions. International Journal of Knowledge-Based 3(2): 175–192.
Sassen, S., 1991. The Global City: New York, London, Tokyo. Princeton, NJ: Princeton University Press.
Sassen, S., 1998. Globalization and its Discontents. New York: New Press.
Sassen, S., 2002. Cities in the World Economy. New York: Routledge.
Sheng-Li, S., Xiao-Yue, Y., Hu-Chen, L. and Ping, Z., 2018. DEMATEL Technique: A Systematic Review of the State-of-the-Art Literature on Methodologies and Applications. Hindawi – Mathematical Problems in Engineering.
Singh, K. and Sarkar, P., 2020. A framework based on fuzzy Delphi and DEMATEL for sustainable product development: A case of Indian automotive industry. Journal of Cleaner Production 246.
Smith, N., 2002. New globalism, new urbanism: gentrification as global urban strategy. Antipode 34(3): 427–450.
Storper, M. and Venables, A. J., 2004. Buzz: face-to-face contact and the urban economy. Journal of Economic Geographic 4(4): 351–370.
Strambach, S., 2002. Change in the innovation process: new knowledge production and competitive cities – the case of Stuttgart. European Planning Studies 10(2): 215–231.
Truong, T. and Ta, T., 2020. Critical factors affecting schedule performance of transportation infrastructure project in the eastern district of Ho Chi Minh City, Vietnam. IOP Conference Series. Materials Science and Engineering 869(6).
Tzeng, G., Chiang, C. and Li, C., 2007. Evaluating intertwined effects in e-learning programs: a novel hybrid MCDM model based on factor analysis and DEMATEL. Expert Syst. Appl. 32: 1028–1044.
Velibeyoglu, K. and Yigitcanlar, T., 2010. An evaluation methodology for the tangible and intangible assets of city-regions: The 6K1C framework. International Journal of Services, Technology and Management 14(4): 343–359.
Weber, M., 1958. The City. Chicago, IL: Free Press.
Wu, H., Chen, H. and Shieh, J., 2010. Evaluating performance criteria of employment service outreach program personnel by DEMATEL method. Expert Syst. Appl. 37(7): 5219–5223.
Yigitcanlar, T., 2011. Position paper: redefining knowledge-based urban development. International Journal of Knowledge-Based Development 4(2): 340–356.
Yigitcanlar, T., 2014. Position paper: Benchmarking the performance of global and emerging knowledge cities. Expert Systems with Applications 41: 5549–5559.
Yigitcanlar, T., Adu-McVie, R. and Erol, I., 2020. How can contemporary innovation districts be classified? A systematic review of the literature. Land Use Policy 95.
Zhao, J. and Bose, B., 2002. Evaluation of membership functions for fuzzy logic controlled induction motor drive. Sevilla; Spain, Annual IEEE Conference of the Industrial Electronics Society.
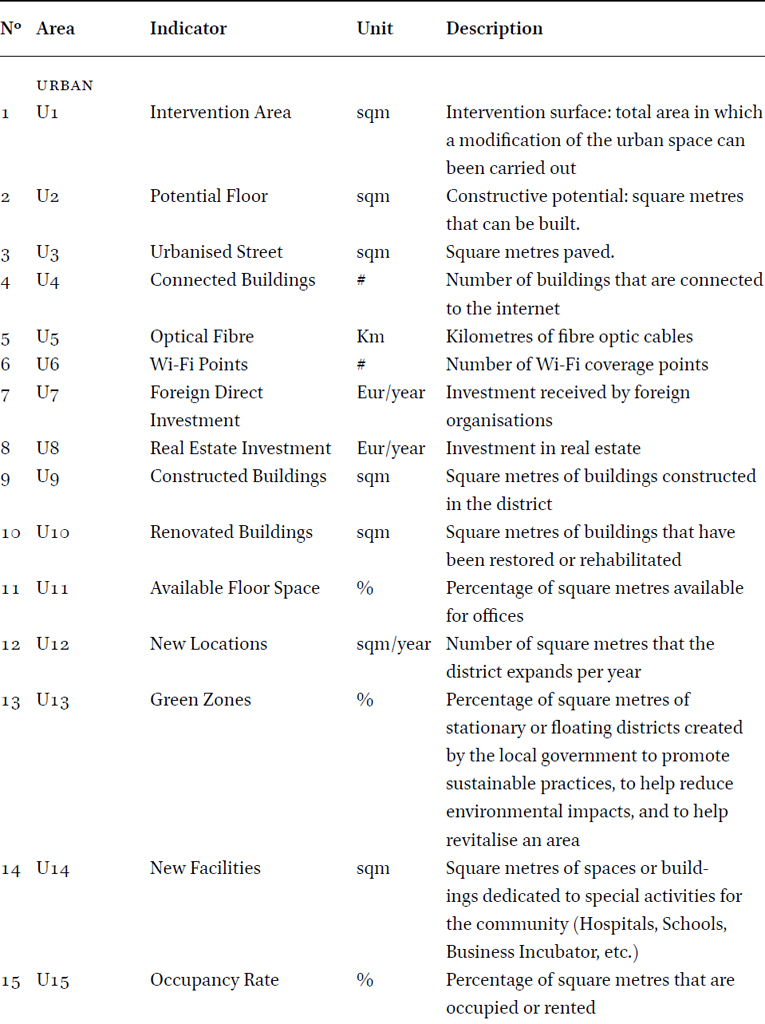

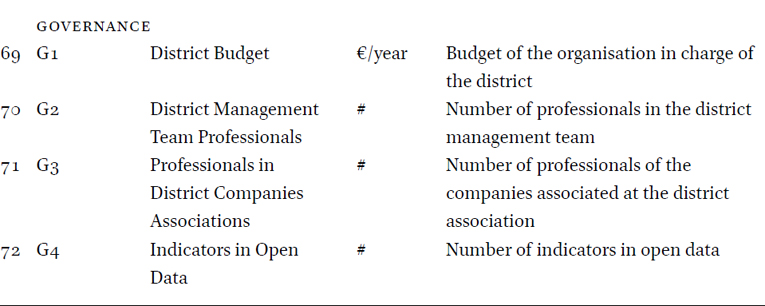
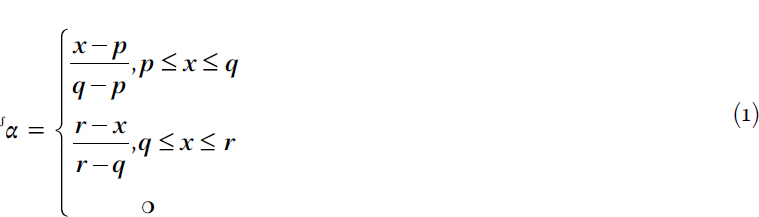
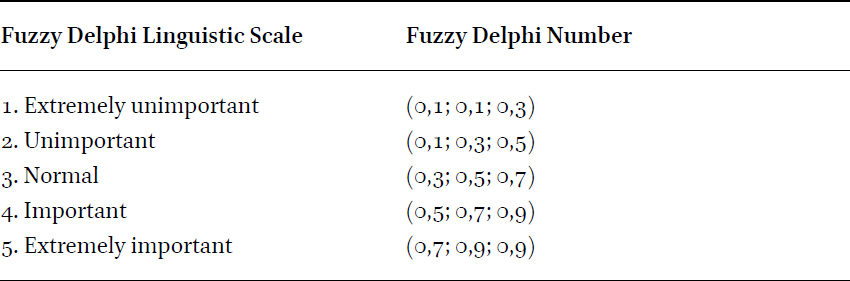

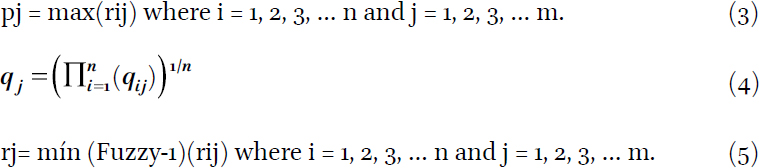

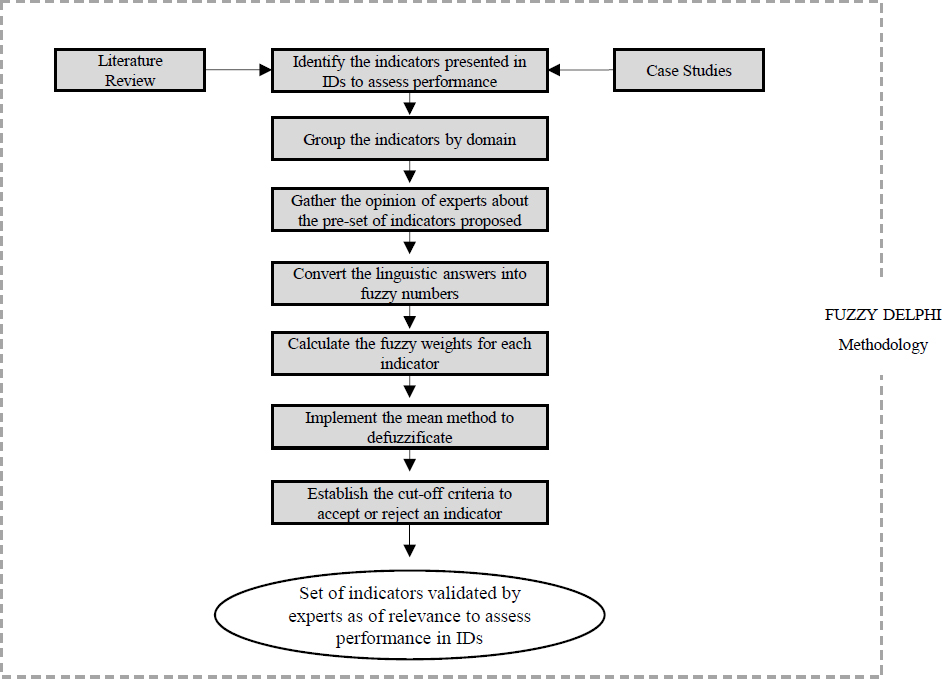
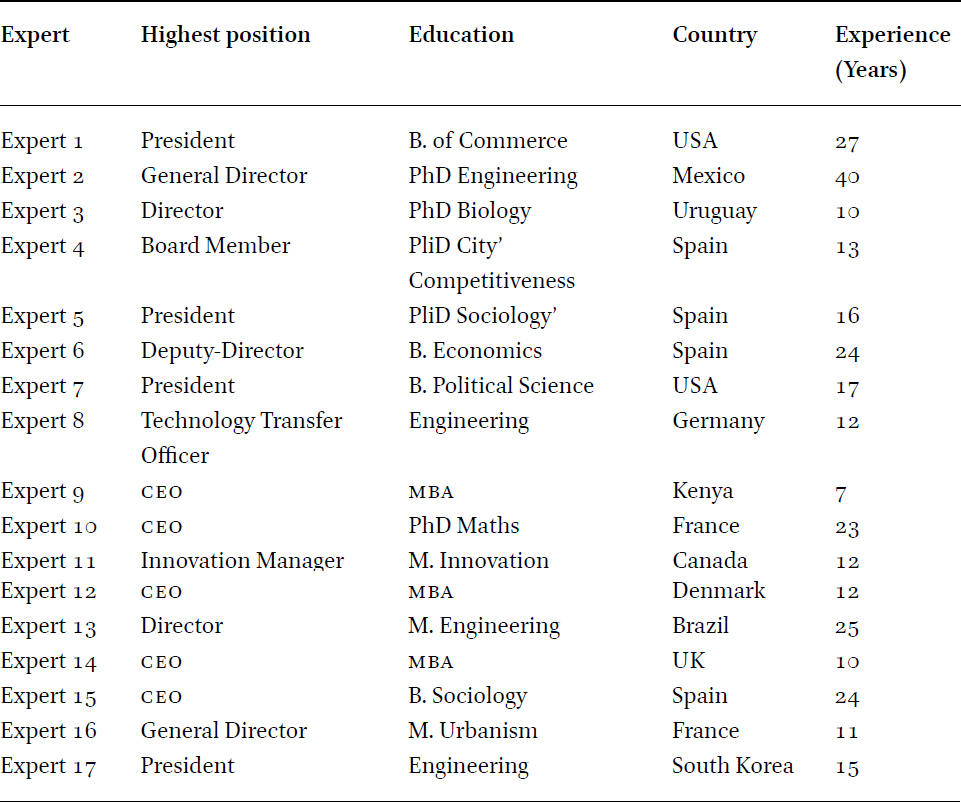
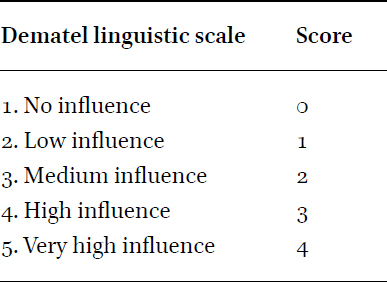


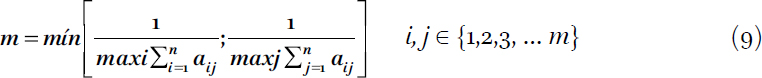

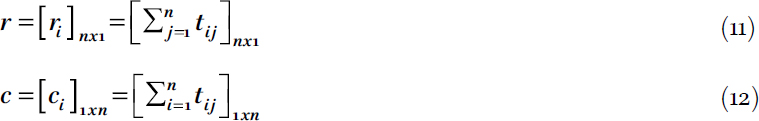
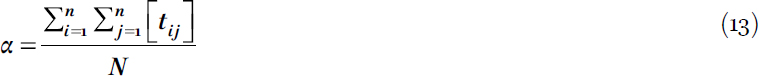
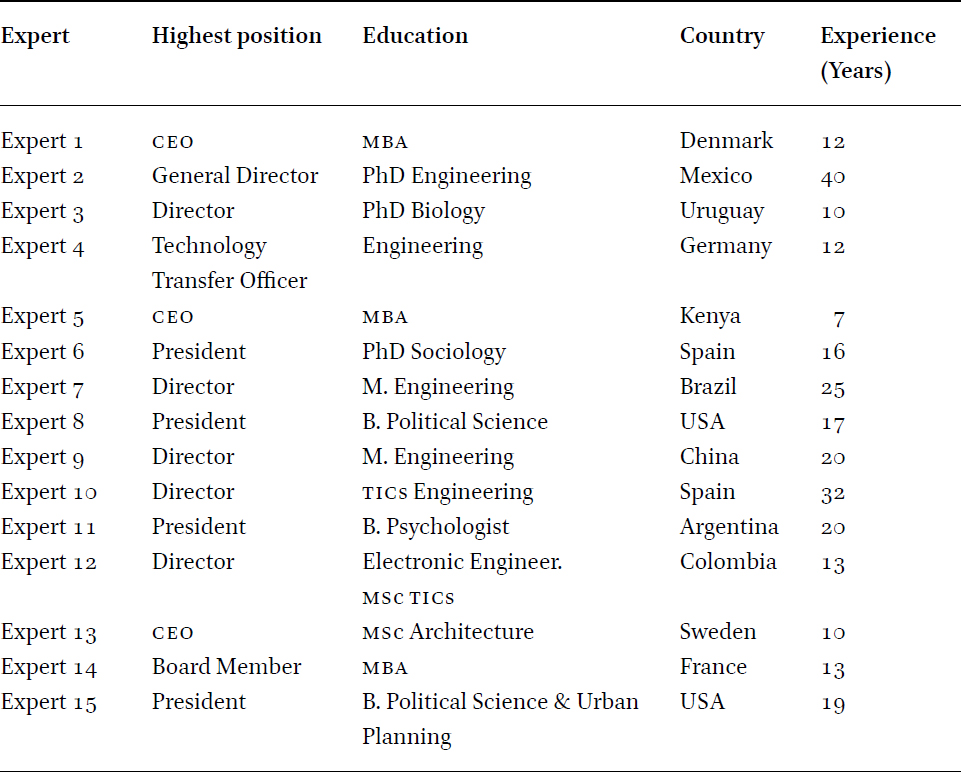

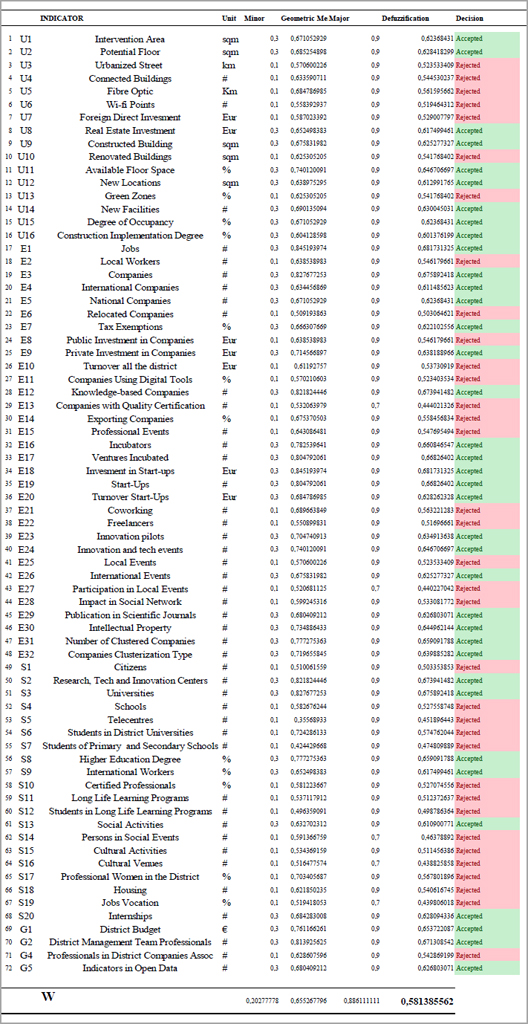

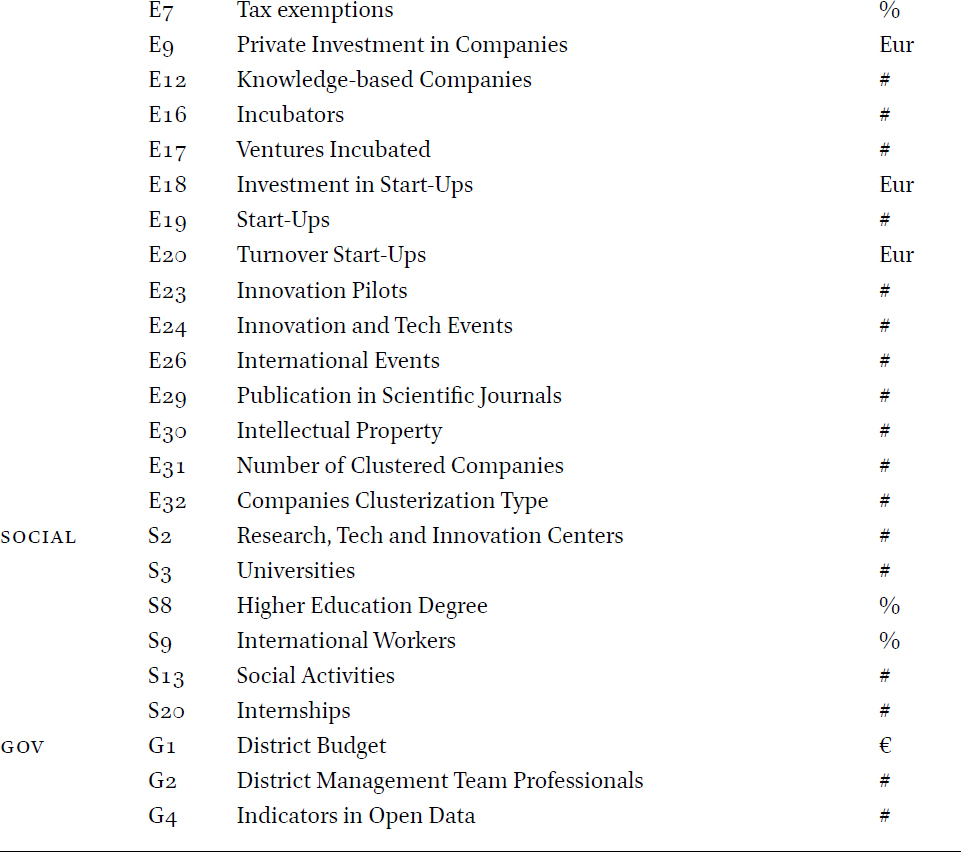
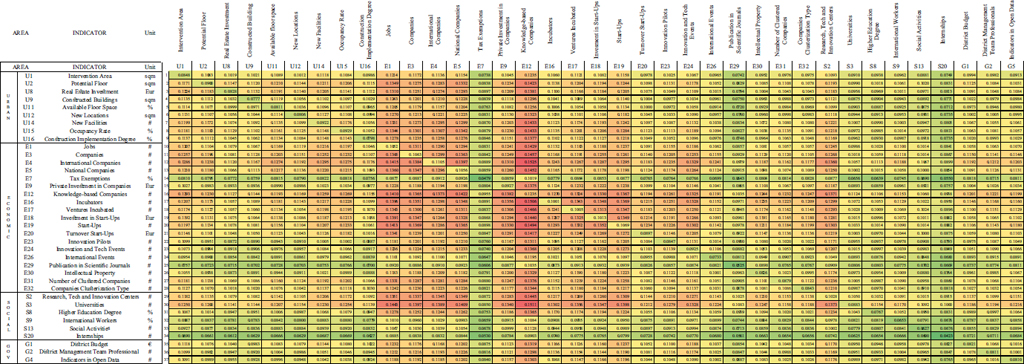
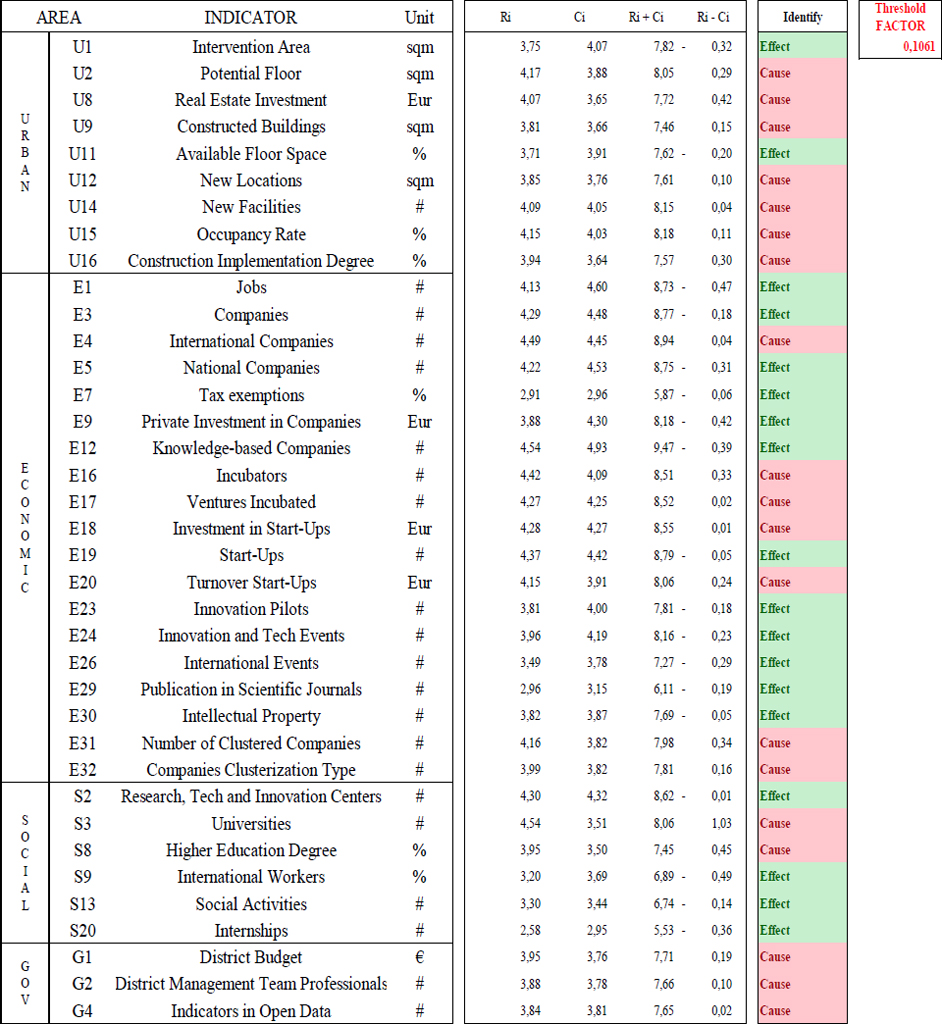
