Abstract
This article probes the performance and mechanisms of the Maoist economy from 1950 to 1980, a period commonly regarded as a turning point that ushered in a new path for Chinaâs industrialisation and modernisation. Commonly, however, the welfare effect of this new path has been overlooked. The present research aims to fill this gap.
Methodologically, this article re-conceptualises, re-examines, and re-assesses the Maoist economy with qualitative and quantitative evidence. This study applies a holistic two-pronged approach with (1) capital accumulation and re-investment, material production and consumption, and (2) mathematical conceptualisation and empirical modelling. The key findings suggest that the Maoist economy was a closed one with industrial dependence on agriculture in an urban-rural zero-sum game with inevitable constraints on workersâ incentives for growth to continue. In the end of the Maoâs era, agriculture declined, the size of industrial workforce stagnated, and the population was poor.
This was not the end of the story, however. This failed industrial transition was itself highly influential as a subsequent point of reference used to justify the post-Mao reforms and opening up as a radical game changer that put China on a very different trajectory of growth and development.
1 Introduction and Motivations
The period of economic Maoism from 1950 to 1980 has been debated ever since Maoâs death which ushered in Deng Xiaopingâs path-breaking economic reforms. The debate arose partly because of the static nature of the economy and opaqueness of the state affairs under Maoâs rule; partly due to the need for a different developmental model to generate growth and development that China was lacking.1
1.1 Debate and Motivation regarding âLate Developmentâ towards Modernity
The present study has been inspired by the ongoing debate on late development towards modernity, a topic that has frequently been discussed with reference to East Asia, with extensive analysis of both Meiji Japan before the First World War and the post-war growth successes of the âtigers:â South Korea, Taiwan, Hong Kong and Singapore.2
On the one hand, there seems to be some degree of inevitability for humanity to become âmodern;â3 and catching up growth and development needs to be encouraged.4 In this context of economic transition, Meiji Japan and the Asian tigers, once âlate developersâ in history, benefited from a âvisible handâ of the state in resource allocation as well as an open market for international trade and foreign direct investment.5 On the other hand, there has been the notion that late development may be subject to in a pyramid-shaped âworld systemâ dominated by a small number of technically and industrially advanced economiesâcalled the âcore,â currently the G7. âTraditional economies,â be they hunting, gathering, or farming, may opt for growth without development towards modernity, and still partake in the world market as a âvent for surplus,â6 riding on world commodity trade without radical changes in indigenous economic structures. This view has been widely accepted.
Moreover, there has been a debate on growth ceilings for late developers, e.g. âdevelopment dependency,â and, more recently, âmiddle income trap.â7 In this regard, Meiji Japan and the Asian tigers are considered exceptions as they have all managed to upgrade themselves to âsemi-periphery economies.â But the pyramid topâG7 plus Asian tigersâmay âkick away the ladderâ to prevent other late comers from climbing up,8 and hence giving the rise to the notion of the West versus the Rest.9
Furthermore, there is an auxiliary model for late development which is associated with âestablishing communism in one country.â It was put forward by the Russian revolutionary leader Vladimir Lenin (1870â1924) as a new communist doctrine.10 However, judging by its track record, the Soviet economy remained by and large open, both during the period of Leninâs âNew Economic Policyâ (NEP, 1921â28) which re-established the open market that had previously existed under the Tsar,11 and in the form of the âSoviet Blocâ with an elaborate international trading network under Joseph Stalin (1878â1953, r. 1924â53), known as the âCouncil for Mutual Economic Assistanceâ (COMECON, 1949â91) with ten member countries across East Europe, East Asia (Vietnam) and Central America (Cuba) plus 13 observers in the Middle East, Africa and South America.12 Inefficient it might have been but COMECON was nevertheless an international trading network headed by a modern superpowerâthe USSR.13
Against this backdrop, there was an international outlier: A country that withdrew from international trade but at the same time was committed to modernisation. This was Maoâs China. A peasant son, Mao was a shrewd politician and military commander who disliked the market economy all his life. During his early career in the communist movement, Mao was influenced by Li Dazhao (1888â1927), the founder of the Communist Movement in China who openly asserted that âfrom now on what people can see everywhere in the world will be the victorious banner of Bolshevism.â14 Mao went a step further from Li by saying that âonly socialism can rescue China.â15 However, in the 1920s to 1940s Maoâs economic project was on a much smaller scale than Leninâs by running a communist experiment in one province inside China instead of a vast country like Russia.16 Mao called his strategy âbuilding a separatist communist regime inside China by military forceâ (wuzhuang geju).17 Maoâs communist base was entirely rural in which neither trade nor industry was necessary. Despite the disapproval of the communist overlord Stalin, Maoâs peasantry-cum-power grabbing proved successful, as history would reveal.
After his military victory against his rival Republicans (or âNationalistsâ as commonly labelled), Mao committed to making China as a second Soviet Union with modern industries. By the terms of Maoâs 1956 âGeneral Guidelineâ (zong luxian) for his party and state, China opted for âmore, faster, better growth with less inputs [than the Soviets]â (duo kuai hao sheng).18 It is worth noting that at this moment, Mao now competed with Nikita Khrushchev (1894â1971, r. 1953â64) in the post-Stalin contest for the new leadership of the international communist movement. It was documented that, in August 1958 at Beidaihe,19 Mao set the target for his Politburo to multiply Chinaâs iron and steel outputs within a short space of time. His aim was to surpass Stalin:
On 7th May [1958], Chairman Mao delivered a speech again on how to surpass the Soviet Union. He commented that it took the Soviets 20 years and six months to increase their steel output from four million tons to 51 million tons. âIn my view,â he said, âit wonât take us so long to get 51 million tons.â20
An order was issued instructing officials who did not perform in the iron and steel campaign were to be severely disciplined.21
So came the âGreat Leap Forward.â From 1958 to 1962, 90 million rural labourers from 120 million households, or one worker per 1.3 households, were drafted for three years to run one million backyard furnaces,22 all according to the principle of self-reliance (zili gengsheng), a synonym for a closed economy.23
Meanwhile, on the eve of Maoâs 1949 takeover, China had been associated with âhigh-level equilibriumâ whose production factorsâcapital, land, labour and technologyâwere all geared towards agriculture.24 Therefore, in neo-classical economic terms, Chinaâs indigenous economy sits on the Production Possibility Frontier (PPF) as the starting point when Maoâs leap project began (Figure 1).25

Fixed production possibility frontier and malignant leap forward
Citation: Journal of the Economic and Social History of the Orient 67, 7 (2024) ; 10.1163/15685209-12341632
In Figure 1, prime facie, Chinaâs original equilibrium at Point
Flexible production possibility frontier and benign leap forward
Citation: Journal of the Economic and Social History of the Orient 67, 7 (2024) ; 10.1163/15685209-12341632
In the ideal world, a famine can be avoided by shifting PPF0 to PPF1. Point
Turning back to Figure 1, one wonders how the shift from Point
State takeover of the food market
Citation: Journal of the Economic and Social History of the Orient 67, 7 (2024) ; 10.1163/15685209-12341632
Before the takeover, Chinaâs fully functional market for food has its demand and supply equilibrium at Point
State take-over of the manufactures market
Citation: Journal of the Economic and Social History of the Orient 67, 7 (2024) ; 10.1163/15685209-12341632
In comparison, changes in the manufactures market are less complicated. Figure 4 begins also with a fully functional market for manufactures with an equilibrium at Point
The government manipulation manipulation manifests itself simultaneously in two directions. On the one hand, it artificially sets a monopolistic/discriminative price level for rural costumers (Pmnl) and consequently reduces the quantity (from Qmt to Qmnl) for the rural consumption. Here, the dominant postulations are that (1) supply of manufactures is always limited and that (2) mundane consumption of industrial goods by the general public is a deadweight to the economy, meaning that there will be no room for the afore-mentioned principle of âfrom each according to his ability, to each according to his needâ as far as manufactures are concerned. As a result, the rural population pays a higher price for a smaller quantity of manufactures as a control mechanism.
In Figure 4, the shaded area represents âconsumer lossâ which becomes monopolistic profit of the state. For this part, the state unilaterally shifts the supply curve to the right via state investment to provide more manufactures for domestic industrial growth. Now, the original market becomes sub-divided; and the two sub-markets behave differently. One is subject to monopolistic pricing (Pmnl); and the other follows a non-monopolistic âfair priceâ (from Pmt, to Pâmt and back to Pmt). Also, division appears between the amount ear-marked for rural costumers (Sub-Q1) and that ear-marked for industrial growth (Sub-Q2). The former is fixed; and the latter has room to grow.
Now, if one puts changes in food and manufacture markets together, the food price level declines and manufacturesâ price level for the rural population increases. Such opposite movements are captured by the notion of âscissors-pricing,â a point that is to be discussed later in detail.
Before we proceed further with our analysis, we should note that Maoâs approach was a major setback for China that had been an organic component of the world system for at least one century, if one counts the Treaty of Nanking (1842) as Chinaâs official opening up for freer trade with the outside world.30 As late as the 1930s, China played a major role in responding to the United Statesâ decision to increase in monetary silver to a quarter of its total monetary value as required by the âSilver Purchase Act of 1934.â31 China responded. By 1935 a total of 77 million Chinese silver dollars had been shipped to the United States.32
Stylised Quesnay-Mao closed economy
Citation: Journal of the Economic and Social History of the Orient 67, 7 (2024) ; 10.1163/15685209-12341632
We should also note that, despite certain similarities between the Chinese and the Soviet economies, the present study avoids reference to the Soviet Union as the dominant benchmark for China. This is because Maoist planning was far cruder thanks to Chinaâs excessive agricultural sector (which accommodated over 80 percent of Chinaâs total population until 1980) whose traditional technology and the mercy of climatic conditions were not plannable by a political centre. To conceptualise the behaviour of Maoâs economy, an appropriate theoretical framework seems to be Tableau Ãconomique by François Quesnay (1694â1774) associated with the school of French physiocracy for a closed and largely rural economy, and hence the âQuesnay-Mao Modelâ (Figure 5).33 However, there is a fundamental difference between Quesnay and Mao: The former explained an economy ex post with an idealised attitude; and the latter remoulded a living economy ex ante by force.
1.2 Maoist Top Priority after 1949
Although a closed economy suited Maoâs rule, by and large economic growth was not prioritised in government policies. First of all, despite the positive light shed by many authors on Maoist economic performance,34 overwhelming evidence indicates that Maoism was a political and ideological movement that did not prioritise economic growth and development in state affairs. Rather, it devoted most of time and energy âremoulding and purifying societyâ (gaizao shehui) with a notion of âcontinuous revolutionâ (jixu geming),35 which turned out to be Maoâs real commitment. One thus comes across a long list of political campaigns: (1) âthe 1950â3 Suppression of Anti-revolutionariesâ (zhenfan, sufan) under which 4.6 million citizens were accused and 710,000 executed;36 (2) âthe 1951â2 Three-Anti and Five-Anti Movementâ (sanfan wufan) that purged 1.2 million citizens;37 (3) âthe 1955 Purge of the Hu Feng Anti-Party Cliqueâ (hufeng fandang jituan) which began his open oppression of the intelligentsia, affecting thousands of intellectuals;38 (4) âthe 1957 Anti-Rightist Movementâ (fanyou) that persecuted over 500,000 (or 10 percent) of the educated;39 and finally (5) âthe 1966â76 Great Proletarian Cultural Revolutionâ (wuchan jieji wenhua dageming), designed to wipe out modern education, persecuted over 100 million (10 percent of Chinaâs total population of 1976).
Inside Maoâs own ruling party, the CCP, purges took place with the same intensity. These campaigns included (1) âthe 1959 Lushan Purge against the Party Right-Wingersâ associated with Marshall Peng Dehuai and his army comrades (lushan huiyi), (2) âthe 1964 Four Cleansingsâ (siqing) against officials below the provincial level,40 and (3) purges of Liu Shaoqi (in 1966), Lin Biao (in 1971), and Deng Xiaoping (in 1966 and 1975) during the Cultural Revolution.41 To accommodate victims of the purges, the Maoâs authorities copied the Soviet Gulag system.42 The only period in which no new political crusade was launched were five years (1958, 1960â63, and 1965), which together amounted merely to 18 percent of Maoâs active rule (1949â76).
Moreover, victims of Maoâs campaigns, often the best-educated minds and prime-aged workers in society, totalled 105.2 million; and over half (60 million) were estimated dead,43 including 40 million during the notorious Great Leap Famine when Mao decided to push for an iron-and-steel take-off.44 Such multitudes suggested inevitable human cost, economic cost, and opportunity cost, as well as negative externalities to the Chinaâs national economy. In the case of the Cultural Revolution, it was announced in 1978 by Premier Hua Guofeng (1921â2008) that âFrom 1974 to 1976, ..., we lost 100 billion yuan in industrial GDP, 28 million tons of steel, and 40 billion yuan worth fiscal revenue. Our entire economy was on the brink of collapse.â45 Also, it has been agreed that the Cultural Revolution cost China 800 billion yuan,46 equivalent to Chinaâs total state-owned capital stock in 1979.47 Ironically, such devastation was instructed in Maoâs own playbook, as he wrote âI achieve a total control over society (tianxia dazhi) after making a total pandemonium (tianxia daluan). I do this every seven to eight years.â48 The end result? According to John Pomfret, an American exchange student in China who travelled extensively in the country in the early 1980s when China was just re-opening to the outside world, âChina was as close as I could imagine to living on another planet. Though it had some of the elements of modern life, ⦠[it was] a nuclear-armed power whose people lived in unheated hovels.â49 Thus, the notion of âMao being pro-growthâ is still subject to debate today.50
Even after the mismanagement of the political life and economy was finally acknowledged at the end of the 1970s, the Chinese official line for assessing Mao has however been that Mao was 70 percent correct politically and economically.51 As a result, Mainland China has run an orchestrated campaign of praises on Maoist accumulations of capital (physical and human), construction of infrastructure and ambition for industrialisation/modernization.52 The devastation inflicted by Maoism has either been downsized, vindicated or overlooked with a few exceptions.53 Such an attitude has been infectious beyond Chinaâs borders. Many in the West have opted to highlight how central planning under Maoâs rule permitted âspeedy changesâ, be it total output (GDP), or economic structure, or mass education, or gender equality, and so forth.54
1.3 Official Self-Contradictions
Now that we have identified the undisputed priority of Maoâs rule, we begin to understand why authorities needed to air-brush economic growth and development as the state policy primacy. Prime facie, China seems to have become heavily industrialised, as the industrial GDP share appeared to be unusually high by international standards for a developing economy (see Table 1). One may take these numbers at face value for the time being.
Moreover, available official figures create the impression that Maoâs engine for growth was heavy industry (Table 2). It is also commonly agreed that the initial push came from an aid package of heavy industry from Stalinâs Soviet Union.55 As a result, the Maoist economy seems to have succeeded in achieving a structural change (in GDP shares), driven by heavy industry, which neatly fits in a story of modernisation under a new regime. Once again, we may take this argument at face value for the time being.
Sectoral shares compared, % of total
Citation: Journal of the Economic and Social History of the Orient 67, 7 (2024) ; 10.1163/15685209-12341632
Sources: R. K. Ray, Industrialization in India: Growth and Conflict in the Private Corporate Sector, 1914â47 (Oxford: Oxford University Press, 1979): 17; D. Lal, The Hindu Equilibrium, Cultural Stability and Economic Stagnation (Oxford: Clarendon, 1988): vol. 1, pp. 126â7; D. Rothermund, An Economic History of India, from Pre-Colonial Times to 1991 (London: Routledge, 1993): 177; P. R. Gregory, Before Command: An Economic History of Russia from Emancipation to the First Five-Year Plan (Princeton: Princeton University Press, 1994): 28, 30; Li Jingwen, âLun Woguo Chanye Jiegoude Biandong Qushiâ (Trend of Structural Change in Chinaâs Economy), Xinhua Wenzhai (Xinhua Compilation) 12 (1995): 46â8; Zhang Zhuoyuan, âZhongguo Jingji Tizhi Gaigede Zongti Huigu Yu Zhanwangâ (Review and Speculation of the Reform of Chinaâs Economic System), Xinhua Wenzhai (Xinhua Compilation) 7 (1998): 48â50; Xinhua News Agency, Peopleâs Republic of China Yearbook, 1996/97 (Hong Kong: NCN Ltd., 1997): 397; National Bureau of Statistics, Zhongguo Tongji Nianjian, 1983 (Chinaâs Statistical Yearbook, 1983) (Beijing: Economy Press, 1983): 24. C. D. Harris, âThe Urban and Industrial Transformation of Japan.â Geographical Review 72/1 (1982): 50â89; J. Colmer, âUrbanisation, Growth, and Development: Evidence from India,â online vide: https://urbanisation.econ.ox.ac.uk/materials/papers/24/urbanisationindia.pdf, accessed 1st December 2020Period capital investment, % of total, 1953â75
Citation: Journal of the Economic and Social History of the Orient 67, 7 (2024) ; 10.1163/15685209-12341632
Source: Based on Lan Xia, â1957â1976 Nian Woguo Jingji Jilei Yu Fenpei Zhuangkuangâ (Capital Accumulation and Distribution in the Chinese Economy, 1957â1976), Chengdu Daxue Xuebao (Bulletin of Chengdu University) 1 (2000): 21â3However, other criteria for determining economic growth and development challenge the idea that China under Maoâs rule established rapid industrialisation and modernisation. One may begin with capital accumulation and capital re-investment. âAchievementsâ displayed in Tables 1 and 2 were powered by an almighty state capable of re-investing a quarter of Chinaâs annual GDP with investment-to-GDP yielding ratio set at 1:1 (after 1957), meaning that one unit of new investment brought back one unit of new GDP.56
If this was indeed the case, after each round of re-investment Chinaâs GDP would increase a quarter, ceteris paribus. Hypothetically, therefore, the state-owned capital stock would have grown pro rata 26,470 percent from 1952 to 1977 from its humble start with 24.1 billion yuan to a total of 6,379.3 billion yuan (1952 constant price).57 In 1978, however, the registered state-owned fixed capital assets were 448.2 billion yuan (constant price),58 merely 7 percent of the expected total. The official explanation was capital waste: âA high rate of accumulation and large-scale capital construction alone cannot bring about sustained fast growth and good economic result.â59 Wasteful capital investment does explain to a great extent Maoâs industrial workforce whose growth was static. But the same capital waste will throw Chinaâs fast industrialisation story out of the window, as an economy cannot have both fast industrialisation and a stagnant industrial workforce at the same time.
Stagnation of industrial workforce, persons à 106, 1959â74
Citation: Journal of the Economic and Social History of the Orient 67, 7 (2024) ; 10.1163/15685209-12341632
Sources: Data for the industrial workforce are based National Bureau of Statistics, Zhongguo Laodong Tongji Nianjian, 1998 (Chinaâs Labour Statistical Yearbook, 1998) (Beijing: Chinaâs Statistics Press, 1998): 81. Data for Chinaâs population are based on National Bureau of Statistics, Zhongguo Tongji Nianjian, 1986 (Chinaâs Statistical Yearbook, 1986) (Beijing: Chinaâs Statistics Press, 1986): 91Secondly, Chinaâs employment structure based on simple arithmetic headcount also challenges Chinaâs fast industrialisation story. Table 3 shows industrial workforce number falling behind the countryâs population increase. This demographic pattern (an annual deficit of â0.27%) basically means that Chinaâs economy was in a process of âdeindustrialisation,â as disproportionately more people were employed in the non-industrial sector, mainly farming.
Thirdly, growth stagnation in the industrial workforce finds its match with the rural dominance in Chinaâs employment structure with which a rapid industrialisation was but a lip service (Table 4).
Employment shares, % of total population
Citation: Journal of the Economic and Social History of the Orient 67, 7 (2024) ; 10.1163/15685209-12341632
Sources: Li Jingwen, âLun Woguo Chanye Jiegoude Biandong Qushiâ (Trend of Structural Change in Chinaâs Economy), Xinhua Wenzhai (Xinhua Compilation) 12 (1995): 46â8; Zhang Zhuoyuan, âZhongguo Jingji Tizhi Gaigede Zongti Huigu Yu Zhanwangâ (Review and Speculation of the Reform of Chinaâs Economic System), Xinhua Wenzhai (Xinhua Compilation) 7 (1998): 48â50; N. Charlesworth, British Rule and the Indian Economy, 1800â1914 (London: MacMillan, 1982): 20; A. Feuerwerker, âThe State and the Economy in Late Imperial China.â Theory and Society 13/3 (1984): 299, 302, 312â13; K. Chao, Man and Land in Chinese History: An Economic Analysis (Stanford: Stanford University Press, 1986): ch. 3; R. Minami, The Economic Development of Japan (London: MacMillan, 1986): 24; S. G. Wheatcroft, R. W. Davies, and J. M. Cooper, âSoviet Industrialization Reconsidered: Some Preliminary Conclusions about Economic Development between 1926 and 1941.â Economic History Review 39/2 (1986): 273; P. Maitra, Indian Economic Development. Population Growth and Technical Change (New Delhi: Ashish, 1991): 101, 132; P. Francks, Japanese Economic Development: Theory and Practice (London: Routledge, 1992): 29; R. W. Davies, M. Harrison, and S. G. Wheatcroft, The Economic Transformation of the Soviet Union, 1913â1945 (Cambridge: Cambridge University Press, 1994): 112; P. R. Gregory, Before Command: An Economic History of Russia from Emancipation to the First Five-Year Plan (Princeton: Princeton University Press Gregory, 1994): 21, 42Moreover, if the data in Tables 3 and 4 are reliable, with town-dwellers constituting 16â18 percent of the total population, a countryâs industrial GDP is most likely to be around 20 percent of its total GDP by an international standard (see again Table 1). There is no reason to believe that Maoâs China should be an exception. Thus, the official industrial GDP figures for Maoâs China are likely to be exaggerated.
1.4 Hidden Engine of Growth under Maoâs Rule
This study hypothesizes an agricultural-industrial dichotomy for a closed economy. A hint comes from a zero-sum game between capital investment and consumption austerity, seen from a decline of consumption in GDP (Table 5).
New Capital Investment vs Consumption Austerity
Citation: Journal of the Economic and Social History of the Orient 67, 7 (2024) ; 10.1163/15685209-12341632
Source: Based on V. D. Lippit, The Economic Development of China (New York: M.E. Sharpe, 1987): 155Such consumption austerity is highly visible in Maoâs pro patria rural food-rationing. The official guideline in the mid-1950s for annual per capita ration for a rural adult was set at 180 kilograms for North China (360 jin, if in wheat, millet, maize, and sorghum) and 200 kilograms for South China (400 jin, if in rice). The following is a breakdown for South China as the upper bound:60
Citation: Journal of the Economic and Social History of the Orient 67, 7 (2024) ; 10.1163/15685209-12341632
These quantities were in raw grain. Weight loss of 20 (wheat) to 30 (rice) percent to milling and husking is normal.61 In real terms, therefore, an adult peasant would have received received 140 kilograms (rice) to 144 kilograms (wheat) per annum. This ration provided the recipient with merely 1,300 calories per day, about a half of energy needed to maintain an adult male. This amount qualifies a famine diet by any standard.
Glance at Chinaâs Scissors-Pricing, 1950â56
Citation: Journal of the Economic and Social History of the Orient 67, 7 (2024) ; 10.1163/15685209-12341632
Source: National Price Commission, Wujia Tongji Ziliao Jianbian (Price Statistics) (Beijing: Peopleâs Press, 1964): 21Of course, Maoâs imposition of consumption austerity was in service of a long-standing goalânamely, the building-up of industry. The vital interface was the âscissors-prising differentialsâ which inflated industrial outputs and at the same time discounted farming products, a repertoire policy copied from the Soviet Union.62 From the early 1950s onwards most agricultural products, as many as 230 items (or just about everything the peasantry produced), were controlled by state monopsony for scissors-prising.63 The state also monopolised industry outputs to make a complete circuit. In short, the state acted as the single dealer between sectors.64 There is no information transparency in this unfair and exploitative practice presumably due to its socio-political sensitiveness. Even so, one can piece together fragmented facts. Table 6 shows how a zero-sum game was played between industry and agriculture.
It was documented that Maoâs state compulsorily purchased privately-owned domestic animals such as pigs from rural households at half the market price.65 The same practice applied to grain, as stated in a State Council decree in 1965 that âCurrently, prices for grain and cooking oil at rural fairs are 120 percent and 90 percent higher than the state procurement prices, respectively.â66 This policy continued until the end of the 1970s: It was officially announced by Chinaâs People Congress in December 1978 that
In order to reduce the price differentials between industrial and agricultural products, this congress has requested the State Council to issue a decree to increase the state procurement prices for targeted grain quotas by 20 percent in the 1979 summer season and to increase another 50 percent in price thereafter. ⦠The wholesale and retail prices of agricultural machinery, chemical fertilizers, agricultural chemicals, and agricultural plastics should be reduced by 10 to 15 percent in 1979 and 1980.67
Based on such limited information, the compounded extra price for the peasantry to pay can be calculated as 115 percent.68 Incidentally, in Stalinâs Soviet Union, peasants also had to pay 75â200 percent above the market prices for industrial goods and services.69 Chinaâs scissors-pricing arbitrage ended only after Mao died.70
Consequently, both consumption austerity and scissors-pricing effectively removed incentives for the peasantry to produce. Chinaâs once productive agricultural sector was in a steady decline, leading to nation-wide food deficits. North China went under first and South China followed (Table 7).71
Food surpluses and deficits, in 104 tons, 1953â78
Citation: Journal of the Economic and Social History of the Orient 67, 7 (2024) ; 10.1163/15685209-12341632
Source: Rural Economy Institute, Ministry of Agriculture (ed.), Dangdai Zhongguo Nongye Biange Yu Fazhan Yanjiu (A Study of Agricultural Reforms and Development in Contemporary China) (Beijing: Chinaâs Agriculture Press, 1998): 251Decline in Agricultural Output Value, in Billion Yuan, 1957â77
Citation: Journal of the Economic and Social History of the Orient 67, 7 (2024) ; 10.1163/15685209-12341632
Source: National Bureau of Statistics, Zhongguo Nianjian (Chinaâs Statistical Yearbook, 1985) (Beijing: Economy Press, 1986): 239Inevitably, Chinaâs agricultural GDP declined (Table 8), something that ironically suited the government agenda rather well, in that it helped boosting Chinaâs nominal industrial GDP share.
After our step-by-step investigation, it becomes clear that savings made from inflated industrial outputs and discounted farming products functioned as the headwaters of Chinaâs closed economy under Maoâs rule. The hidden engine of growth was the humble and moribund agricultural sector.
By this point in our investigation, one begins to harbour serious doubts about the supposed existence of a perfect harmony between âself-relianceâ (zili gengsheng, literarily meaning âmaking life go-forever by own effortsâ) and âbalanced growthâ under Maoâs rule.72 In the Maoist economy, âself-relianceâ73 and a âbalanced growthâ74 were mutually exclusive.
1.5 Theoretic Approach
This study applies a holistic two-pronged approach with (1) capital accumulation and re-investment, material production and consumption, and (2) mathematical conceptualisation and empirical modelling. The starting point is the Quesnay-Mao zigzag links with which much of industrial growth comes from agriculture (Figure 5). The present task is essentially to measure the Quesnay-Mao zigzag links. The remaining article is made of three parts: mathematical conceptualisation, empirical modelling, and final conclusions.
2 Mathematical Conceptualisation of the Quesnay-Mao Economy
Our model is based on two pioneering works, one by Sah and Stiglitz and another by Lin and Yu.75 Given the nature of the Quesnay-Mao economy, the present study focuses on the âscissors-pricing arbitrageâ between agricultural and non-agricultural sector as the main engine for the Maoist growth.76 The objective of the Maoist economy was to transfer all surpluses produced by the agricultural sector to the industrial sector instead of maximizing the aggregate social welfare.77
If we suppose that in the 1950s to the 1970s Chinaâs agricultural sector had a population Nr, and the industrial or urban sector had a population Nu; Nr > Nu captures the agrarian nature of the economy.
Consumers across all sectors have the identical quasi-linear utility functions, as follows:78
Citation: Journal of the Economic and Social History of the Orient 67, 7 (2024) ; 10.1163/15685209-12341632
Where i = r, u
Prices of manufacturing goods are set as 1. Our rationale is that by treating the consumers iâs consumption of manufacturing goods as the numeraire, all surpluses of the Maoist economy will be sucked up by the industrial sector.
Meanwhile, to produce manufactures the industrial sector needs capital (K) and labour (Lu). To produce food the agricultural sector uses land (R) and labour (Lr). Technology is assumed to have constant returns to scale in both sectors.79 Labourers are immobile between the two sectors due to a household registration system (called hukou) which blocks rural residents to move to the urban sector during the Maoist period.
Then, scissors-pricingâa ratio of the agricultural price level to the industrial price levelâcan be set as p dictated exclusively by a political centre. The budget-constraint for a representative peasant with Utility Function (1) becomes:
Citation: Journal of the Economic and Social History of the Orient 67, 7 (2024) ; 10.1163/15685209-12341632
Where X is the peasantâs output. The capital to land ratio is  .
.
Combining Equations (1) and (2), we can define the indirect utility function for this representative peasant as:
Citation: Journal of the Economic and Social History of the Orient 67, 7 (2024) ; 10.1163/15685209-12341632
With the Envelope Theorem, the rural surplus belonging to a representative peasant could be found from a relative price level:
Citation: Journal of the Economic and Social History of the Orient 67, 7 (2024) ; 10.1163/15685209-12341632
Furthermore, a soft-budget constraint equation for a representative worker can be set as follows:80
Citation: Journal of the Economic and Social History of the Orient 67, 7 (2024) ; 10.1163/15685209-12341632
In addition, the state consumption rationing of agricultural goods for the urban population was imposed. Hence, a representative urban worker also faces the following constraint:
Citation: Journal of the Economic and Social History of the Orient 67, 7 (2024) ; 10.1163/15685209-12341632
Where x̱u is the state rationing of agricultural goods per urban worker;81 x̱u also measures the maximum surplus food supply per peasant.
Now, a representative aggregate surplus function for Maoist China can be constructed with two parts. The first part is the net aggregate utility of urban workers; the second part, the net aggregate utility of peasants. They are linked by scissors-pricing to satisfy the state objective of maximizing surpluses required for industrial growth in a closed-economy.82 The government surplus function aims to maximize as follows:83
Citation: Journal of the Economic and Social History of the Orient 67, 7 (2024) ; 10.1163/15685209-12341632
To derive Equation (7) with p and make it equal to 0, we obtain the following:
Citation: Journal of the Economic and Social History of the Orient 67, 7 (2024) ; 10.1163/15685209-12341632
From Equations (8), the optimal equilibrium condition could be expressed as follows:
Citation: Journal of the Economic and Social History of the Orient 67, 7 (2024) ; 10.1163/15685209-12341632
In addition, with x̱u = x̱r, under the equilibrium condition together with the state imposes food rationing, Equation (9) becomes
Citation: Journal of the Economic and Social History of the Orient 67, 7 (2024) ; 10.1163/15685209-12341632
Or,
Citation: Journal of the Economic and Social History of the Orient 67, 7 (2024) ; 10.1163/15685209-12341632
Based on Equation (10), the state imposes consumption level for urban workers also determines the number of workers for the industrial sector:
Citation: Journal of the Economic and Social History of the Orient 67, 7 (2024) ; 10.1163/15685209-12341632
And,
Citation: Journal of the Economic and Social History of the Orient 67, 7 (2024) ; 10.1163/15685209-12341632
With  , higher scissors-pricing will lead to a higher wage level in the industrial sector, which is to be verified by the empirical section. Thus, one could conclude
Citation: Journal of the Economic and Social History of the Orient 67, 7 (2024) ; 10.1163/15685209-12341632
So, the rural sector is sacrificed for the growth in the industrial sector. Therefore, we could propose the following main proposition:
Proposition 1. In a Quesnay-Mao closed economy, industry is agriculture-dependent whereby the growth in the urban industrial sector is at the expenses of that of the rural sector.
3 Empirical Modelling
In this section, empirical modelling is conducted with multiple linear regressions to test the zigzag flows in the Quesnay-Mao zero-sum game in China.
3.1 Data
Our data come from available official data published mainly by Chinaâs Statistics Press and Chinaâs Social Sciences Press. Our chosen period is from 1950 to 1980 which covers the whole era of Maoism until Chinaâs âreforms and opening-upâ (gaige kaifang). Table 9 lists our sources in detail.
Data sources
Citation: Journal of the Economic and Social History of the Orient 67, 7 (2024) ; 10.1163/15685209-12341632
Sources: (1) National Bureau of Statistics, Zhongguo Guding Zichan Tongji Ziliao, 1950â1985 (Statistics for Chinaâs Fixed Asset Investment, 1950â1985) (Beijing: Chinaâs Statistics Press, 1987); (2) Liu Xiangcheng (ed.), Zhongguo Guding Zichan Touzi Nianjian (Statistical Yearbook of the Chinaâs Investment in Fixed Assets, 1950â1995) (Beijing: Chinaâs Statistics Press, 1997); (3) National Bureau of Statistics, Zhongguo Tongji Nianjian, 1984 (Chinaâs Statistical Yearbook, 1984) (Beijing: Chinaâs Statistics Press, 1984); (4) and (4)â National Bureau of Statistics, Zhongguo Tongji Nianjian, 1987 (Chinaâs Statistical Yearbook, 1987) (Beijing: Chinaâs Statistics Press, 1987); (5) National Bureau of Statistics, Zhongguo Renko He Jiuye Tongji Nianjian, 2020 (Chinaâs Population and Employment Statistical Yearbook, 2020) (Beijing: Chinaâs Statistics Press, 2020); (6) Zhu Weisheng, Chen Yueyue, Zhu Jianhua, and Chen Wuchao (eds) Xin Zhongguo Wushinian, 1949â1999 (Fifty Years of New China, 1949â1999) (Beijing: Chinaâs Statistics Press, 1999); (7) National Bureau of Statistics, Zhongguo Tongji Nianjian, 1981 (Chinaâs Statistical Yearbook, 1981) (Beijing: Chinaâs Statistics Press, 1981); (8) National Bureau of Statistics, Xin Zhongguo Wushinian Tongji Ziliao Huibian, 1949â1998 (Comprehensive Statistical Data for Fifty Years of New China, 1949â1998) (Beijing: Chinaâs Statistics Press, 1999); (9) National Bureau of Statistics, Zhongguo Tongji Nianjian, 2001 (Chinaâs Statistical Yearbook, 2001) (Beijing: Chinaâs Statistics Press, 2001)Four variables need defining: (1) Total investment in industry is taken as a proxy for the dependent variable of industrial growth. (2) Rural consumption, an independent variable, is measured by rural food rationing based on quantities permitted by the Maoist government according to genders and ages to enforce artificial rural austerity.84 Since available data are only for censused years, for robustness we use the end-period value for missing data in-between censused years.85 (3) Disasters, another independent variable, are designed as a dummy to reflect farming conditions.86 Value 1 is for severe annual precipitation anomaly (including floods and droughts); otherwise, the value is 0.87 (4) The price ratio between the wholesale purchasing price index of farm products and the rural retail price index of industrial products is used as a proxy for scissors-pricing, again an independent variable.88 Table 10 contains a summary of statistics.
Summary Statistics
Citation: Journal of the Economic and Social History of the Orient 67, 7 (2024) ; 10.1163/15685209-12341632
Sources: See Table 9Our preliminary observations are demonstrated in Figure 6 in which agriculture takes the lead between the two sectors.
General Pattern: Agriculture vs Industry
Citation: Journal of the Economic and Social History of the Orient 67, 7 (2024) ; 10.1163/15685209-12341632
Sources: See Table 9Linear Relationships between Various Factors and Industrial Investment
Citation: Journal of the Economic and Social History of the Orient 67, 7 (2024) ; 10.1163/15685209-12341632
Sources: See Table 9Figure 7 contains scatter plots with fitted lines, suggesting a positive linear relationship between industrial investment and food output, agricultural exports and GDP, and a negative linear relationship between industrial investment and natural disasters. Such observations warrant further regression analyses.
3.2 Model Specification
Inspired by three works by Kitchens, Graddy, and de Zwart et al., respectively,89 we specify a multiple log-linear regression model with OLS as follows:
Citation: Journal of the Economic and Social History of the Orient 67, 7 (2024) ; 10.1163/15685209-12341632
Here, industrial investment (the dependent variable) is in the logarithm value for the year t. The independent variables are also in the logarithm values for food output, rural food rationing, agricultural export, and GDP. We also include scissors-pricing, disasters (a dummy for natural shocks), and Great Leap Famine (a dummy for political shocks).90 The item
3.3 Baseline Results
Table 11 contains baseline results of Formula 13. Column by column, more independent variables are added.
Baseline results
Citation: Journal of the Economic and Social History of the Orient 67, 7 (2024) ; 10.1163/15685209-12341632
Sources: See Table 9Column (1) shows that food output has significant influence on industrial capital accumulation (and hence industrial growth): one percent increase in food output results in a 4.014 percent increase in total industrial investment. In other words, a 2.15 billion-kilogram increase in food output is equivalent to 0.13 billion yuan industrial investments.91
Column (2) confirms that rural food rationing is negatively correlated to industrial growth, which reflects the practice of food being persistently extracted from the rural consumption baskets and shipped out to finance urban wages. One percent increase in food at rural dinner tables reduces Maoâs industrial investment by 2.2 percent with a deduction leverage. But the influence of rural food rationing is insignificant, a situation that changes later.
Column (3) adds agricultural exports on as an independent variable, as Maoâs regime at times exported food in exchange for foreign industrial equipment. Agricultural exports â agricultural surpluses by definition â are positively correlated to industrial investment although one percent increase in agricultural export brings about only 0.8 percent increase in industrial investment; and the impact of this variable on industrial investment is insignificant. Even so, with a value between 0.171 and 0.848, food export deserves a place in Maoâs economic system.92
Column (4) demonstrates that GDP growth is both significant and positively correlated to industrial investment. As an independent variable, GDP represents the overall level of development (e.g., industrial production capability discussed in the following Table 16) and accounts for many unobserved confounding factors that could influence the estimates. Also, as a predictor, GDPâs influence is not as strong as agricultural output, not to mention the large standard deviation for GDP (see Table 11).
Column (5) shows that scissors-pricing is significant but negatively correlated to the dependent variable. 0.01 unit decrease in scissors-pricing index (thus industrial goods becoming relatively more expensive) generates 1.7 percent growth in industrial investment. That is, a one percent decrease in scissors-pricing relative to the sample mean is associated with a 2.754 percent increase in industrial investment. Conditioning on GDP, scissors-pricing emerges as the most significant contributor to industrial investment.
Column (6) indicates that disasters are significant and negatively correlated to industrial investment: A severe precipitation anomaly could reduce industrial investment by 19.7 percent.
Finally, our coefficient determinator Adjusted R2 reaches 0.970 (Column 6), indicating that 97% of the variance of the outcome of industrial investment can be explained by our regression model. Moreover, our R2 value (0.977) is very close to Adjusted R2 (0.970), indicating that the explanatory power of our model is not substantially influenced by the added independent variables.93 Meanwhile, our F test (129.94) rejects the null hypothesis that all the regression coefficients are equal to zero. And the Durbin-Watson test (1.504) shows no autocorrelation in residuals.94
3.4 Robustness Checks
To test robustness, we include a placebo test, and checks with investment in light industry and other alternative measures, political shocks, confounding factors, and province-level estimations.
Adding a placebo test on the post-reform period. In circa 1980, the engine of Chinaâs industrial growth was switched from agriculture to the market in post-Mao âreforms and opening-up.â95 To reflect this ideological and policy shift, we run a placebo test for the period of 1981 to 2000 with Formula 15. Now, the influence of predictors becomes insignificant which in turn implies that our theoretical model holds for Maoism (Table 12).
Placebo test Results
Citation: Journal of the Economic and Social History of the Orient 67, 7 (2024) ; 10.1163/15685209-12341632
Comparison with estimates of investment in light industry. If we assume that heavy industry was the main beneficiary of Maoist investment strategy,96 we rerun the regression with the logarithm values of investments in heavy and light industries, respectively. Shown in Table 13, as expected, a balance overwhelmingly tilts towards heavy industry, as military-cum-heavy industry received special attention of the Maoist state.97 The influence of predictors on light industry is weaker and often insignificant.
Heavy industry vs light industry results
Citation: Journal of the Economic and Social History of the Orient 67, 7 (2024) ; 10.1163/15685209-12341632
Sources: See Table 9Adding alternative measures for the variables of interest. Admittedly, statistics for Maoâs China are very limited. Scholars may doubt the suitability of independent variables used in this study. To safeguard our approach, we replace some independent variables with other measures and rerun Formula 13. The results are presented in Table 14.
Alternative measuresâ results
Citation: Journal of the Economic and Social History of the Orient 67, 7 (2024) ; 10.1163/15685209-12341632
Sources: See Table 9Column (2) uses alternative value for ârural age groupsâ to eliminate possible bias between censused years. Column (3) substitutes rural food rationing with ârural populationâ proxying rural food consumption. Column (4) disentangles âscissors-pricingâ and uses âmonopsony price index of farming productsâ and ârural retail price index of industrial products.â Notwithstanding their weaker influence, monopsony price index and rural retail price index remain significant.98 Column (5) redefines the disaster dummy variable with area-averaged annual precipitation.99 Finally, Column (6) uses the logarithm of normalized annual precipitation anomaly as a disaster proxy.100 The alternative results are by and large compatible with the baseline, which further supports our analytical design.
Adding more political shocks. Meanwhile, as the Great Leap Famine was not the only negative shock to Chinaâs economy, two other major shocksâthe Korean War and the Cultural Revolution101âare introduced as dummies and the regression is again rerun. The results in Table 15 are consistent with the baseline, indicating that political shocks did not change the way the Quesnay-Mao economy behaved.
Extra shocksâ test results
Citation: Journal of the Economic and Social History of the Orient 67, 7 (2024) ; 10.1163/15685209-12341632
Sources: See Table 9Adding potential confounding factors. Another methodological challenge with this study pertains to potential confounding factors that might introduce bias into our baseline estimates. These factors include production capacity, technology, and industrial demand. Intuitively, a stronger production capacity would seem to imply the industryâs own ability to expand more efficiently. The development and adoption of new technology can enhance productivity within the industrial sector, while new industrial demand, such as urbanization, may contribute to the prosperity of the supply side of the industrial sector.
To address this concern, we have incorporated an additional set of proxies into the baseline regression separately, and the results are presented in Table 16 in which we use (1) industrial output value, machine output, iron output, and cement output to proxy industrial production capacity, (2) education expenditure and research expenditure to proxy technology, and (3) urban population to proxy industrial demand. These new variables do not yield a significant impact on the estimates of variables in the baseline regression. Notably, however, the estimates for scissors-pricing remain highly significant across all specifications.
Confoundersâ test results
Citation: Journal of the Economic and Social History of the Orient 67, 7 (2024) ; 10.1163/15685209-12341632
Sources: See Table 9 for variables in baseline estimates. Industrial output value is from National Bureau of Statistics, Comprehensive Statistical Data for Fifty Years of New China, 1949â1998: 21. Machine output, iron output and cement output are from Comprehensive Statistical Data for Fifty Years of New China, 1949â1998: 39â42. Education expenditure is from Comprehensive Statistical Data for Fifty Years of New China, 1949â1998: 13. Research expenditure is from Comprehensive Statistical Data for Fifty Years of New China, 1949â1998: 15. Urban population is from Comprehensive Statistical Data for Fifty Years of New China, 1949â1998: 1Furthermore, in Column (2), the logarithm of industrial output value renders GDP insignificant. In Column (3), the inclusion of specific industrial outputs makes only the logarithm of machine output significance. These findings suggest that GDP plays a role in controlling for industrial production. In Column (4), the positive correlation between both education expenditure and research expenditure with industrial investment is observed. However, neither urban population size nor urban population share demonstrates a significant role in influencing industrial investment. Importantly, our results exhibit robustness even after accounting for these potential confounding factors.
Conducting additional province-level estimations. Some readers may have concerns about our nation-level analysis based on a small sample size (31 observations). Indeed, several considerations led us to refrain from using province-level data. These considerations are the following: (1) Proxy availability. For the Maoist era, Chinaâs Statistical Yearbooks, the main official sources, contain some regional/provincial data. However, many key proxies are unavailable at the province level. (2) Data missing. While the quality of the extant data may be satisfactory,102 as discussed earlier,103 there is a high degree of uncertainty due to missing observations. (3) Inconsistency with the planning feature of the Maoist economy. Under Maoâs rule, scissors-pricing may be both intra-provincial and inter-provincial. In other words, the central authorities might employ scissors-pricing to transfer surpluses from an agricultural province, like Henan, to an industrial province such as Liaoning. Regression at the province level captures scissors-pricing within the province, but not necessarily between provinces.
Nevertheless, to further consolidate our analysis, following the study by Cheremukhin et al.,104 we construct a province-level dataset with 301 observations as the maximum available, and re-evaluate our main analysis. Although four out of seven variables used in our baseline regression are not available, we identify a set of alternative proxies for regressions (see Appendix Table A.2).105 Also, we include year fixed effects and province fixed effects. As shown in Appendix Table A.3, estimates for scissors-pricing remain significant, which provides additional support for our primary analysis.
4 Conclusions with Policy Implications
This study re-examines mechanisms and performance of the Maoist economy of 1950â80 in a new light. Our approach begins with preliminary observations of a mismatch between political instability (purges) and an inflated industrial GDP share on the one hand, and an unfavourable urban-rural employment divide, persistent austerity in food consumption, and perpetual arbitrage via rural-urban scissors-pricing on the other. After all, Maoâs China was predominantly rural with only a marginal amount of modern growth.
These observations lead to a hypothesis that the Maoist economy was operated in accordance with a Quesnay bi-sectoral model (hence the term âQuesnay-Mao Modelâ) whereby the industrial sector rode parasitically on its agricultural counterpart. This was a zero-sum game which discouraged incentives, sophistication, flexibility, opportunities, and momentum in the economy. This is a true revelation which challenges the conventional wisdom about the allegedly high performance of the Maoist economy.
To test this industry-riding-on-agriculture hypothesis, this study applies a holistic mathematical conceptualisation and empirical modelling. It reveals an urban-rural zero-sum game with high values among coefficient determinators.
With this Quesnay-Mao Model in place from 1950 to 1980, it was a tall order for Mao and his planners to improve living standards of the masses and make China modern at the same time. The closed nature of the Quesnay-Mao economy also explains why and how post-Mao China has been able substantially to outperform Maoâs track record in terms of scale, scope and speed.106
Based on this historical lesson, the policy implications from this study are in line in the practice of âreforms and opening-upâ (gaige kaifang) by abandoning state allocation of resources (thus reforms) and reviving the market both within China and beyond (thus opening-up). This has been a lesson that China has learnt in a hard way.
In this regard, the post-Mao reforms and opening-up was indeed a game changer that put China on a very different growth trajectory by unleashing Chinaâs un-tapped âabsolute advantageâ (Adam Smith) and âcomparative advantageâ (David Ricardo),107 both being historically tested and validated globally in the past two centuries. In other words, post-Mao China has merely followed an internationally proven norm for growth and development to take place. This being so, serious scepticism is warranted as to the alleged uniqueness of what has now been widely circulated as the âChina Model.â
Appendix
Stationary test
Citation: Journal of the Economic and Social History of the Orient 67, 7 (2024) ; 10.1163/15685209-12341632
Data availability at the provincial level
Citation: Journal of the Economic and Social History of the Orient 67, 7 (2024) ; 10.1163/15685209-12341632
Sources: (1) National Bureau of Statistics, Xin Zhongguo Liushinian Tongji Ziliao Huibian, 1949â2008 (New China Compendium of Statistics, 1949â1998) (Beijing: Chinaâs Statistics Press, 2010); (2) National Bureau of Statistics, Xin Zhongguo Wushinian Tongji Ziliao Huibian, 1949â1998 (Comprehensive Statistical Data for Fifty Years of New China, 1949â1998) (Beijing: Chinaâs Statistics Press, 1999)Provincial Level Regressions
Citation: Journal of the Economic and Social History of the Orient 67, 7 (2024) ; 10.1163/15685209-12341632
Bibliography
Amsden, A. H. 1989. Asiaâs Next Giant: South Korea and Late Industrialization. New York: Oxford University Press.
An Ziwen. 1952. Guanyu Jieshu Sanfan Yundong He Chuli Yiliu Wentide Baogao (Report on the Ending of the Three-Anti Movement and Its Residual Issues), 18th October, 1952. Beijing: Central Archives.
Anon. 1965. Wei Quanmiandi Tizao Wancheng He Chao-e Wancheng Wunian Jihua Er Fendou (Our Campaign for Comprehensively Over-fulfilling Our Five-year Plan Ahead of the Schedule. Renmin Ribao (Peopleâs Daily), 1st January, 1965, p. 1.
Anon. 1965. Zhonggong Zhongyang Guowuyuan Guanyu Tiaozheng Dangqian Shichang Wujiade Jueding (Decree of the Chinese Communist Party Central Committee and the State Council on Re-adjustment of Current Market Prices, 1965), online vide: http://news.xinhuanet.com/ziliao/2005-02/02/content_2539275.htm, accessed 20th September 2020.
Anon. 1969. Mao Zedong Sixiang Wansui (Long Live Mao Zedongâs Thought). Beijing: Peking University (SOAS Library Copy).
Anon. 1978. Zhongguo Gongchandang Dishiyijie Zhongyangweiyuanhui Disanci Quanti Huiyi Gongbao (Communiqué on the Third Plenary Meeting of the Eleventh Central Committee of Chinese Communist Party). Renmin Ribao (Peopleâs Daily), 24th December, 1978, p. 1.
Ashton, B. K., H. A. Piazza, and R. Zeitz. 1984. Famine in China, 1958â61. Population and Development Review 10/4: 613â645.
Bai Xi. 2006. Kaiguo Da Zhenfan (Sweeping Suppression of Anti-revolutionaries in the Early Days of the Peopleâs Republic). Beijing: Chinese Communist Party History Press.
Bandera, V. N. 1963. The New Economic Policy (NEP) as an Economic System. Journal of Political Economy 71/3: 265â279.
Bank of China. 1933â1935. Shijie Yinshi Julie Dongdang, Zhonghang Lizu Baiyin Wailiu, 1933 Nianâ1935 Nian (Extreme Volatility in the World Silver Market and Bank of Chinaâs Curbing Silver Outflow, 1933â1935), online vide: https://www.boc.cn/aboutboc/ab7/200809/t20080926_6918.html, accessed 2nd January, 2024.
Bárány, Z. L. and C. Siegel. 2018. Job Polarization and Structural Change. American Economic Journal: Macroeconomics 10/1: 57â89.
Becker, J. 1996. Hungry Ghost, Chinaâs Secret Famine. London: John Murray. (Checked. this is the original title).
Bellino, E. and S. M. Fratini. 2022. Absolute Advantages and Capital Mobility in International Trade Theory. The European Journal of the History of Economic Thought 29/2: 271â293.
Bernstein, T. P. 1984. Stalinism, Famine and Chinese Peasants: Grain Procurements during the Great Leap Forward. Theory and Society 13/3: 339â377.
Bideleaux, R. 1985. Communism and Development. London: Methuen.
Bodrova, V. and R. Anker. 1985. Working Women in Socialist Countries: the Fertility Connection. Geneva: International Labour Office.
Bornstein, M. (ed.) 1981. The Soviet Economy. New York: Routledge Press.
Bose, D. K. 1989. Market and Plan in Soviet Union. Economic and Political Weekly 24/2: 95â99.
Bramall, C. 2000. Inequality, Land Reform and Agricultural Growth in China, a Preliminary Treatment, 1952â54. Journal of Peasant Studies 27/3: 30â54.
Brecher, R. A., Z. Chen, and E. U. Choudhri. 2002. Absolute and Comparative Advantage, Reconsidered: The Pattern of International Trade with Optimal Saving. Review of International Economics 10/4: 645â656.
Cao Shuji. 2005. Da Jihuang, 1959â1961 Niande Zhongguo Renkou (Great Famine and Chinaâs Population in 1959â1961). Hong Kong: Times International Publishing Co.
Cardoso, F. H. and E. Faletto. 1979. Dependency and Development in Latin America. Berkeley: University of California Press.
Central Liaison Department of the Chinese Communist Party (ed.). 1972. Dangnei Shici Luxian Douzheng Ziliao (Materials of Ten Two-Line Struggles within the Chinese Communist Party). Beijing: The Central Liaison Ministry of the Chinese Communist Party.
Chang, D. W. 1988. China Under Deng Xiaoping: Political and Economic Reform. New York: Palgrave Macmillan.
Chang, H.-J. 2002. Kicking Away the Ladder: Development Strategy in Historical Perspective. London: Anthem Press.
Chang, J. and J. Halliday. 2005. Mao, the Unknown Story. London: Vintage Books.
Chao, K. 1986. Man and Land in Chinese History: An Economic Analysis. Stanford: Stanford University Press.
Charlesworth, N. 1982. British Rule and the Indian Economy, 1800â1914. London: MacMillan.
Chen, N-R. and W. Galenson. 1969. The Chinese Economy under Communism. Chicago: Aldine Press.
Cheng, Chu-yuan. 1982. Chinaâs Economic Development, Growth and Structural Change. London: Routledge Press.
Cheremukhin, A., M. Golosov, S. Guriev, and A. Tsyvinski. 2024. The Political Development Cycle: The Right and the Left in Peopleâs Republic of China from 1953. American Economic Review 114/4: 1107â1139.
Colmer, J. 2020. Urbanisation, Growth, and Development: Evidence from India, online vide:âhttps://urbanisation.econ.ox.ac.uk/materials/papers/24/urbanisationindia.pdf, accessed 1st December 2020.
Cong Jin. 1989. Quzhe Fazhande Suiyue (Period of Tortuous Development). Zhengzhou: Henan Peopleâs Press.
Croll, E. 1983. The Family Rice Bowl: Food and the Domestic Economy in China. Geneva: UNRISD.
Crump, L. and S. Godard. 2018. Reassessing Communist International Organisations. Contemporary European History 27/1: 85â109.
Davies, R. W., M. Harrison, and S. G. Wheatcroft. 1994. The Economic Transformation of the Soviet Union, 1913â1945. Cambridge: Cambridge University Press.
Davies, R. W. 1991. From Tsarism to the New Economic Policy: Continuity and Change in the Economy of the USSR. Ithaca, NY: Cornell University Press.
De Zwart, P., D. Gallardo-Albarrán, and A. Rijpma. 2022. The Demographic Effects of Colonialism: Forced Labor and Mortality in Java, 1834â1879. Journal of Economic History 82/1: 211â249.
Deng K. and J. Du. 2017. To Get the Prices Right for Food: The State versus the Market in Reforming China, 1979â2006. European Review of Economic History 21/3: 302â325.
Deng, K. 2011. Chinaâs Political Economy in Modern Times: Changes and Economic Consequences, 1800â2000. London: Routledge Press.
Deng, K. 2015. Mapping Chinaâs Growth and Development in the Long Run, 221 BC to 2020. London: World Scientific Press and Imperial College Press.
Di Ren and Mai Dao. 1993. Mao Zedong He Tade Junshi Gaocan (Mao Zedong and His Military Aide). Beijing: Red Flag Press.
Dikötter, F. 2010. Maoâs Great Famine: The History of Chinaâs Most Devastating Catastrophe, 1958â62. London: Bloomsbury Press.
Dillon, M. 2015. Deng Xiaoping: The Man who Made Modern China. London: I. B. Tauris.
Dittrich, S. R. and R. H. Myers. 1971. Resource Allocation in Traditional Agriculture. Journal of Political Economy 79/4: 887â896.
Dong Zhikai and Wu Li. 2011. Zhonghua Renmin Gongheguo Jingjishi, 1953â1957 (An Economic History of the Peopleâs Republic of China, 1953â1957). Beijing: Social Science Literature Press.
Dong Zhikai. 1995. Xinzhonghua Gongye Jingjishi, 1958â1965 (An Economic History of Industry of New China, 1958â1965). Beijing: Economic Management Press.
Eagly, R. V. 1969. A Physiocratic Model of Dynamic Equilibrium. Journal of Political Economy 77/1: 66â84.
Eckstein, A. 1977. Chinese Economic Revolution. Cambridge: Cambridge University Press.
Eckstein, A., W. Galenson, and T. Liu (eds). 1968. Economic Trends in Communist China. Chicago: Aldine Pub. Co.
Ellman, M. 1973. Planning Problems in the USSR. Cambridge: Cambridge University Press.
Elvin, M. 1973. The Pattern of the Chinese Past. Stanford: Stanford University Press.
Evans, R. 1993. Deng Xiaoping and the Making of Modern China. London: Hamish Hamilton.
Feigenbaum, E. A. 1999. Soldiers, Weapons and Chinese Development Strategy: The Mao Era Military in Chinaâs Economic and Institutional Debate. China Quarterly 158: 285â313.
Ferguson, N. 2011. Civilization: The West and the Rest. London: Penguin.
Feuerwerker, A. 1984. The State and the Economy in Late Imperial China. Theory and Society 13/3: 297â326.
Frank, A. G. 1978. Development of Underdevelopment or Underdevelopment of Development in China. Symposium on Chinaâs Economic History 4/3: 341â350.
Francks, P. 1992. Japanese Economic Development: Theory and Practice. London: Routledge.
Gao Wangling. 2006. Zhongguo Nongmin Fanxingwei Diaocha (Investigation into a Quiet Rebellion of the Chinese Peasantry against Maoism). Beijing: Central Party History Press.
Gerschenkron, A. 1962. Economic Backwardness in Historical Perspective. Cambridge [MA]: Harvard University Press.
Graddy, K. 2013. Taste Endures! The Rankings of Roger de Piles (â 1709) and Three Centuries of Art Prices. Journal of Economic History 73/3: 766â791.
Gray, J. 1974. Mao Tse-Tungâs Strategy for the Collectivization of Chinese Agriculture: An Important Phase in the Development of Maoism. In Sociology and Development, eds. E. De Kadt and G. Williams. London: Tavistock Press: 39â108.
Gregory, P. R. and R. C. Stuart. 1994. Soviet and Post-Soviet Economic Structure and Performance. New York: HarperCollins.
Gregory, P. R. 1994. Before Command: An Economic History of Russia from Emancipation to the First Five-Year Plan. Princeton: Princeton University Press.
Hall, S. 1992. The West and the Rest: Discourse and Power. Durham, North Carolina: Duke University Press.
Harris, C. D. 1982. The Urban and Industrial Transformation of Japan. Geographical Review 72/1: 50â89.
He Bochuan. 1994. 2000 Nian Zhongguo Mubiao Xitongde 20 Ge Cuiruodian (Twenty Weak Points in Chinaâs Targets for the Year 2000), Xinhua Wenzhai (Xinhua Compilation) 5: 7â8.
He Fengming. 2001. JingliâWode 1957 Nian (The Year 1957 When A Disaster Struck on Me). Lanzhou: Dunhuang Literature and Art Press.
Heilmann S. and E. J. Perry (eds). 2011. Maoâs Invisible Hand. Cambridge [MA]: Harvard University East Asian Center.
Hoffmann, C. 1971. The Maoist Economic Model. Journal of Economic Issues 3/5: 12â27.
Holz, C. A. 2003. âFast, Clear and Accurateâ: How Reliable Are Chinese Output and Economic Growth Statistics? China Quarterly 173: 122â163.
Howe, Christopher. 1983. Growth, Public Policy and Hong Kongâs Economic Relationship with China. China Quarterly 95: 512â533.
Hsüeh, Li-min, Chen-kuo Hsu, and D. H. Perkins. 2001. Industrialization and the State: The Changing role of the Taiwan Government in the Economy, 1945â1988. Cambridge [MA]: Harvard Institute for International Development.
Hsueh, T-T. and T-O. Woo. 1986. The Political Economy of the Heavy Industry Sector in the Peopleâs Republic of China. China Journal 15/1: 57â82.
Hua Guofeng. 1978. Tuanjie Qilai, Wei Jianshe Shehuizhuyide Xiandaihua Qianguo Er Fendou (United to Build a Socialist Modern Power). Renmin Ribao (Peopleâs Daily), 27th February, 1978, p. 1.
Jiang Yuanming. 1998. Wangshi 1966 Xiezhen (Memory of 1966). Tianjin: Hundred-Flower Art Press.
Jin Hui. 1993. Sannian Ziyanzaihai Beiwanglu (Memorandum on the Alleged Three Years of Natural Disasters, 1959â62), Shehui (Society) 4â5: 13â22.
Jobst, A. A., and H. X. Wu. 2008. Measuring Chinaâs Economic Performance. World Economics 9/2: 13â44.
Kaser, M. 1967. Comecon: Integration Problems of the Planned Economies. Oxford University Press.
Kau, M. Y. and S. H. Marsh. 1993. China in the Era of Deng Xiaoping: A Decade of Reform. New York: Routledge.
Kenez, P. 2006. A History of the Soviet Union from the Beginning to the End. Cambridge: Cambridge University Press.
Kitchens, C. 2013. A Dam Problem: TVAâs Fight Against Malaria, 1926â1951. Journal of Economic History 73/3: 694â724.
Kueh, Y. Y. 2006. Mao and Agriculture in Chinaâs Industrialization: Three Antitheses in a 50-Year Perspective. China Quarterly 187: 700â723.
Kueh, Y. Y. 2008. Chinaâs New Industrialization Strategy: Was Chairman Mao Really Necessary? Cheltenham: Edward Elgar.
Kung, J. K. and J. Y. Lin. 2003. The Causes of Chinaâs Great Leap Famine, 1959â1961. Economic Development and Cultural Change 51/2: 51â73.
Lal, D. 1988. The Hindu Equilibrium, Cultural Stability and Economic Stagnation. Oxford: Clarendon.
Lan Xia. 2000. 1957â1976 Nian Woguo Jingji Jilei Yu Fenpei Zhuangkuang (Capital Accumulation and Distribution in the Chinese Economy, 1957â1976), Chengdu Daxue Xuebao (Bulletin of Chengdu University) 1: 21â3.
Lányi, K. 1993. The Collapse of the COMECON Market. Russian & East European Finance and Trade 29/1: 68â86.
Lardy, N. 1978. Economic Growth and Distribution in China. Cambridge: Cambridge University Press.
Lardy, N. 1983. Agriculture in Chinaâs Modern Economic Development. New York: Cambridge University Press.
Lee, K. 2013. Schumpeterian Analysis of Economic Catch-up: Knowledge, Path-Creation, and the Middle-Income Trap. Cambridge: Cambridge University Press.
Lee, Yeon-ho. 1997. The State, Society, and Big Business in South Korea. London: Routledge.
Li Dazhao. 1984. Bu-ershiweike de Shengli (Victory of Bolshevism). In Li Dazhao Wenji (Collected Works of Li Dazhao). Beijing: Peopleâs Press, 1984): vol. 1, p. 600.
Li Hui. 2003. Hu Feng Jituan Yuan-a Shimo (A History of the Fabrication of the âHu Feng Cliqueâ). Wuhan: Hubei Peopleâs Press.
Li Jingwen. 1995 . Lun Woguo Chanye Jiegoude Biandong Qushi (Trend of Structural Change in Chinaâs Economy). Xinhua Wenzhai (Xinhua Compilation) 12: 46â48.
Li Jingwen. 1997. Zhongguo Jingji Tizhi Zhuanxing Guochengzhongde Hongguan Tiaokong (Macro Control in the Process of Switching Chinaâs Economic System). Xinhua Wenzhai (Xinhua Compilation) 4: 49â51.
Li Rui. 1989. Lushan Huiyi Shilu (Records of the 1959 Lushan Conference. Beijing: Spring-Autumn Press.
Li Rui. 2005. Li Rui Tan Mao Zedong (Li Ruiâs Memoir on Mao Zedong). Hong Kong: Time International Publishing Co.
Li, B. 1998. Agricultural Development in Jiangnan, 1620â1850. London: Macmillan.
Li, H.-Y. 2006. Mao and the Economic Stalinization of China, 1948â1953. New York: Rowman & Littlefield.
Liao Luyan. 1952. Guanyu Jieshu Wufan Yundong He Chuli Yiliu Wentide Baogao (Report on the Ending of the Five-Anti Movement and Its Residual Issues), 17th October, 1952. Beijing: Central Archives.
Lin, Manhong. 2006. China Upside Down: Currency, Society, and Ideologies, 1808â1856. Cambridge [MA]: Harvard University Asia Center.
Lin, Justin and Yu Miaojie. 2008. The Economics of Price Scissors: An Empirical Investigation for China. Social Science Research Network, 2008, online vide: https://papers.ssrn.com/sol3/papers.cfm?abstract_id=1032404, accessed 27th December 2023.
Lin, Justin and Yu Miaojie. 2009. The Political Economy of Price Scissors in China: Theoretical Model and Empirical Evidence. Economic Research Journal 1: 42â56.
Ling Zhijun. 1997. Lishi Buzi Paihuai (History, No More Hesitation). Beijing: Peopleâs Press.
Lippit, V. D. 1987. The Economic Development of China. New York: M. E. Sharpe.
Liu Xiangcheng (ed.). 1997. Zhongguo Guding Zichan Touzi Nianjian (Statistical Yearbook of the Chinaâs Investment in Fixed Assets, 1950â1995). Beijing: Chinaâs Statistics Press.
Liu Zhongli. 1999. DianjiâXinzhongguo Jingji 50 Nian (Laying the Foundationâ 50 Years of the Economy of New China). Beijing: Chinaâs Financial Economics Press.
Maitra, P. 1991. Indian Economic Development. Population Growth and Technical Change. New Delhi: Ashish.
Malafeev, A. N. 1964. Istoriia Tsenoobrazovaniia v SSSR (The History of Price Formation in the USSR). Moscow: Mysl.
Malerba, F. and K. Lee. 2021. An Evolutionary Perspective on Economic Catch-Up by Latecomers. Industrial and Corporate Change 30/4: 986â1010.
Maneschi, A. 1998. Comparative Advantage in International Trade: A Historical Perspective. Cheltenham: Edward Elgar.
Mao Zedong. 1992. Gei Jian Qingde Xin, 1966 Nian 7 Yue 8 Ri (A Letter to Wife Jiang Qing on 8th July 1966). In Zhonghua Renmin Gongheguo Chunqiu Shilu (Records of Changes of the Peopleâs Republic of China), ed. Anon. Beijing: The Peopleâs University Press: 691.
Mao Zedong. 1992. Gongzou Fangfa Liushi Tiao (Sixty Methods of the Party Work). In Mao Zedong Wenji (Selected Works of Mao Zedong), ed. Institute of Documents of the Chinese Communist Party Central Committee. Beijing: Central Archives: vol. 8, pp. 51â52.
Mao Zedong. 1999. Guanyu Zhengque Chuli Remin Neibu Madunde Wenti (On the Correct Handling of Contradictions Among the People). In Mao Zedong Wenxuan (Collected Works of Mao Zedong), ed. Institute of Documents of the Chinese Communist Party Central Committee. Beijing: Peopleâs Press: vol. 7, p. 214.
Mao, Haijian. 2016. The Qing Empire and the Opium War: The Collapse of the Heavenly Dynasty. Cambridge: Cambridge University Press.
Marx, K. and F. Engels. 1963. Communist Manifesto. New York: Russell and Russell.
Meek, R. L. 1963. The Economics of Physiocracy. London: Allen & Unwin.
Meyskens, C. F. 2020. Maoâs Third Front, the Militarization of Cold War China. Cambridge: Cambridge University Press.
Minami, R. 1986. The Economic Development of Japan. London: MacMillan.
Ministry of Finance. 1997. Zhongguo Caizheng Nianjian, 1997 (Chinaâs Financial Yearbook, 1997). Beijing: Chinaâs Finance Magazine Press.
Müller, A. L. 1978. Quesnayâs Theory of Growth: A Comment. Oxford Economic Papers, New Series 30/1: 150â156.
Myint, H. 1958. The âClassical Theoryâ of International Trade and the Underdeveloped Countries. Economic Journal 68/270: 317â337.
National Bureau of Statistics. 1981. Zhongguo Tongji Nianjian, 1981 (Chinaâs Statistical Yearbook, 1981). Beijing: Chinaâs Statistics Press.
National Bureau of Statistics. 1983. Zhongguo Tongji Nianjian, 1983 (Chinaâs Statistical Yearbook, 1983). Beijing: Economy Press.
National Bureau of Statistics. 1984. Zhongguo Tongji Nianjian, 1984 (Chinaâs Statistical Yearbook, 1984). Beijing: Chinaâs Statistics Press.
National Bureau of Statistics. 1986. Zhongguo Nianjian, 1985 (Chinaâs Statistical Yearbook, 1985). Beijing: Economy Press.
National Bureau of Statistics. 1986. Zhongguo Tongji Nianjian, 1986 (Chinaâs Statistical Yearbook, 1986). Beijing: Chinaâs Statistics Press.
National Bureau of Statistics. 1987. Zhongguo Tongji Nianjian, 1987 (Chinaâs Statistical Yearbook, 1987). Beijing: Chinaâs Statistics Press.
National Bureau of Statistics. 1987. Zongguo Guding Zichan Tongji Ziliao, 1950â1985 (Statistics for Chinaâs Fixed Asset Investment, 1950â1985). Beijing: Chinaâs Statistics Press.
National Bureau of Statistics. 1998. Zhongguo Laodong Tongji Nianjian, 1998 (Chinaâs Labour Statistical Yearbook, 1998). Beijing: Chinaâs Statistics Press.
National Bureau of Statistics. 1999. Xin Zhongguo Wushinian Tongji Ziliao Huibian, 1949â1998 (Comprehensive Statistical Data for Fifty Years of New China, 1949â1998). Beijing: Chinaâs Statistics Press.
National Bureau of Statistics. 2001. Zhongguo Tongji Nianjian, 2001 (Chinaâs Statistical Yearbook, 2001). Beijing: Chinaâs Statistics Press.
National Bureau of Statistics. 2002. Zhongguo Tongji Nianjian, 2002 (Chinaâs Statistical Yearbook, 2002). Beijing: Chinaâs Statistics Press.
National Bureau of Statistics. 2010. Xin Zhongguo Liushinian Tongji Ziliao Huibian, 1949â2008 (New China Compendium of Statistics, 1949â1998). Beijing: Chinaâs Statistics Press.
National Bureau of Statistics. 2020. Zhongguo Renko He Jiuye Tongji Nianjian, 2020 (Chinaâs Population and Employment Statistical Yearbook, 2020). Beijing: Chinaâs Statistics Press.
National Price Commission. 1964. Wujia Tongji Ziliao Jianbian (Price Statistics). Beijing: Peopleâs Press.
Naughton, B. 1993. Deng Xiaoping: The Economist. China Quarterly 135: 491â514.
Naughton, B. 2006. The Chinese Economy: Transitions and Growth. Cambridge [MA]: MIT Press.
Paine, S. 1976. Balanced Development: Maoist Conception and Chinese Practice. World Development 4/4: 277â304.
Parrinello, S. 2006. National Competitiveness and Absolute Advantage in a Global Economy. Working Paper of Dipartimento di Economia Pubblica 95: 1â23.
Perdue, P. C. 2011. The First Opium War. Cambridge [MA]: MIT Press.
Perkins, D. 1966. Market Control and Planning in Communist China. Cambridge [MA]: Harvard University Press.
Perkins, D. H. 1969. Agricultural Development in China, 1368â1968. Edinburgh: Edinburgh University Press.
Pierre-Richard, A. 2016. Caught in the Middle? The Economics of Middle-income Traps. Journal of Economic Surveys 31/3: 771â791.
Pomeranz, K. 2000. The Great Divergence: Europe, China and The Making of the Modern World Economy. Princeton: Princeton University Press.
Pomfret, J. 2007. Chinese Lessons. New York: Henry Holt.
Pruchnik, K. and J. Zowczak. 2017. Middle-income Trap: Review of the Conceptual Framework. Asian Development Bank Institute Working Paper No. 760 (Tokyo).
Puntigliano, A. R. and Ã. Appelqvist. 2011. Prebisch and Myrdal: Development Economics in the Core and on the Periphery. Journal of Global History 6/1: 29â52.
Rawski, T. G. 1979. Economic Growth and Employment in China. London: Oxford University Press.
Rawski, T. G. 2001. What Is Happening to Chinaâs GDP Statistics? China Economic Review 12/4: 347â354.
Ray, R. K. 1979. Industrialization in India: Growth and Conflict in the Private Corporate Sector, 1914â47. Oxford: Oxford University Press.
Rodan, G. 1989. The Political Economy of Singaporeâs Industrialisation: National State and International Capital. Basingstoke: MacMillan.
Rostow, W. W. 1966. The Stages of Economic Growth, a Non-Communist Manifesto. Cambridge: Cambridge University Press.
Rothbard, M. N. 1991. The End of Socialism and the Calculation Debate Revisited. Review of Austrian Economics 5/2: 51â76.
Rothermund, D. 1993. An Economic History of India, from Pre-Colonial Times to 1991. London: Routledge.
Ruffin, R. 2002. David Ricardoâs Discovery of Comparative Advantage. History of Political Economy 34/4: 727â748.
Rural Economy Institute, Ministry of Agriculture (ed.). 1998. Dangdai Zhongguo Nongye Biange Yu Fazhan Yanjiu (A Study of Agricultural Reforms and Development in Contemporary China). Beijing: Chinaâs Agriculture Press.
Sah, R. K. and J. E. Stiglitz. 1984. The Economics of Price Scissors. American Economic Review 74/1: 125â138.
Schmidt-Glintzer, H. 2017. 70 Per Cent Good, 30 Per Cent Bad - China Has Found A Simple Formula to Assess Mao Zedongâs Legacy. Politics of Memory, 10.08.2017, online vide: https://www.ips-journal.eu/in-focus/the-politics-of-memory/70-per-cent-good-30-per-cent-bad-2216/, accessed 2nd August 2022.
Selden, M. 1988. Mao Zedong and the Political Economy of Chinese Development. China Report 24/2: 125â139.
Sen, A. 1982. Poverty and Famines: An Essay on Entitlement and Deprivation. Oxford and New York: Oxford University Press.
Service, R. 1997. A History of Twentieth-Century Russia. Cambridge [MA]: Harvard University Press.
Sheng Guofan. 2007. Wo Suo Qinlide Hu Feng An, Faguan Wang Wenzheng Koushu (My Personal Experience of the Hu Feng Clique, Memoir of Judge Wang Wenzheng). Beijing: Chinese Communist Party History Press.
Sinha, R. P. 1975. Chinese Agriculture: A Quantitative Look. Journal of Development Studies 11/3: 202â223.
Song Haiqing. 2000. Renmin Gongshe Xingwang Lu (Rise and Fall of the Peopleâs Commune). Urumqi: Xinjiang Youth Press.
The 73rd Congress of the United States. 1943. Silver Purchase Act of 1943, online vide: https://en.wikisource.org/wiki/Silver_Purchase_Act_of_1934, accessed 2nd January 2024.
Tisdell, C. 2009. Economic Reform and Openness in China: Chinaâs Development Policies in the Last 30 Years. Economic Analysis and Policy 39/2: 271â294.
Van Dyke, P. A. 2005. The Canton Trade: Life and Enterprise on the China Coast, 1700â1845. Hong Kong: Hong Kong University Press.
Van Ree, E. 2010. Leninâs Conception of Socialism in One Country, 1915â17. Revolutionary Russia 23/2: 159â181.
Vernengo, M. and D. Fields. 2016. DisORIENT: Money, Technological Development and the Rise of the West. Review of Radical Political Economics 48/4: 562â568.
Vogel, E. F. 2013. Deng Xiaoping and the Transformation of China. Cambridge [MA]: Harvard University Press.
Wade, R. 1990. Governing the Market: Economic Theory and the Role of Government in East Asian Industrialisation. Princeton: Princeton University Press.
Wallerstein, I. 2011. The Modern World-System. Berkley: University of California Press.
Wang, Z., P. Zhai, and H. Zhang. 2003. Variation of Drought over Northern China during 1950â2000. Journal of Geographical Sciences 13/4: 480â487.
Warren, B. 1980. Imperialism: Pioneer of Capitalism. London: Verso.
Wemheuer, F. 2019. A Social History of Maoist China: Conflict and Change, 1949â1976. Cambridge: Cambridge University Press.
Wheatcroft, S. G., R. W. Davies, and J. M. Cooper. 1986. Soviet Industrialization Reconsidered: Some Preliminary Conclusions about Economic Development between 1926 and 1941. Economic History Review 39/2: 264â294.
Wheelwright, E. L. and B. McFarlane. 1970. The Chinese Road to Socialism. New York: Monthly Review Press.
Wilhelm, J. 1979. Does the Soviet Union Have a Planned Economy? Soviet Studies 31/2: 268â274.
World Bank. 1993. The East Asian Miracle. New York: Oxford University Press.
Xi Xuan and Jin Chunming. 1996. Wenhua Dagemin Jianshi (A Short History of the Great Cultural Revolution). Beijing: Central Party History Press.
Xinhua News Agency. 1997. Peopleâs Republic of China Yearbook, 1996/97. Hong Kong: NCN Ltd.
Xue Muqiao. 1996. Xue Muqiao Huiyilu (Memoir of Xue Muqiao). Tianjin: Tianjin Peopleâs Press.
Yang Jisheng. 2008. MubeiâZhongguo Liushi Niandai Dajihuang Jishi (Gravestone for the Great Leap Famine Victims, Evidence from History). Hong Kong: Tiandi Books.
Yang Peixin. 1995. Dui Guoyou Qiye Gaige Wentide Tantao (State-owned Enterprises and Reform). Xinhua Wenzhai (Xinhua Compilation) 10: 43â45.
Yang Xianhui. 2003. Jiabian Gou Jishi (Diary in the Narrow Valley). Shanghai: Shanghai Literature and Art Press.
Yu, M., Q. Li, M. J. Hayes, M. D. Svoboda, and R. R. Heim. 2014. Are Droughts Becoming More Frequent or Severe in China Based on the Standardized Precipitation Evapotranspiration Index: 1951â2010? International Journal of Climatology 34/3: 545â558.
Yuan Xiaolun. 2008. Jibuzeshide Yuedu Jiyi (Readings during the Cultural Revolution), Yanhuang Chunqiu (History of Chinese Nation and People) 11: 68â69.
Zhai, P., X. Zhang, H. Wan, and X. Pan. 2005. Trends in Total Precipitation and Frequency of Daily Precipitation Extremes over China. Journal of Climate 18/7: 1096â1108.
Zhang Hua and Su Caiqing (eds). 2000. Huizhou Wedge, Zhongguo Simian Wedge Benxi Yu Fans (Recollection of the Decade of Cultural Revolution, Analyses and Soul-Researching). Beijing: Chinese Communist Party History Press.
Zhang Xianwen (ed.). 2005. Zhonghua Minguo Shi (A History of the Republic of China). Nanjing: The University of Nanjing Press: vol. 2, p. 236.
Zhang Zhuoyuan. 1998. Zhongguo Jingji Tizhi Gaigede Zongti Huigu Yu Zhanwang (Review and Speculation of the Reform of Chinaâs Economic System). Xinhua Wenzhai (Xinhua Compilation) 7: 48â50.
Zheng Yougui. 2019. Zhonghua Renmin Gongheguo Jingjishi, 1949â2019 (An Economic History of the Peopleâs Republic of China, 1949â2019). Beijing: Contemporary China Press.
K. Deng, Chinaâs Political Economy in Modern Times: Changes and Economic Consequences, 1800â2000 (London: Routledge Press, 2011): chs. 9â10.
E.g. World Bank, The East Asian Miracle (New York: Oxford University Press, 1993); R. Wade, Governing the Market: Economic Theory and the Role of Government in East Asian Industrialisation (Princeton: Princeton University Press, 1990). For country cases, see e.g. G. Rodan, The Political Economy of Singaporeâs Industrialisation: National State and International Capital. Basingstoke: MacMillan, 1989); A. H. Amsden, Asiaâs Next Giant: South Korea and Late Industrialization (New York: Oxford University Press, 1989); Yeon-ho Lee, The State, Society, and Big Business in South Korea (London: Routledge, 1997); Li-min Hsüeh, Chen-kuo Hsu, and D. H. Perkins, Industrialization and the State: The Changing role of the Taiwan Government in the Economy, 1945â1988 (Cambridge [MA]: Harvard Institute for International Development, 2001).
K. Marx and F. Engels, Communist Manifesto (New York: Russell and Russell, 1963); B. Warren, Imperialism: Pioneer of Capitalism (London: Verso, 1980); W. W. Rostow, The Stages of Economic Growth, a Non-Communist Manifesto (Cambridge: Cambridge University Press, 1966).
A. Gerschenkron, Economic Backwardness in Historical Perspective (Cambridge [MA]: Harvard University Press, 1962); K. Lee, Schumpeterian Analysis of Economic Catch-up: Knowledge, Path-Creation, and the Middle-Income Trap. (Cambridge: Cambridge University Press, 2013); F. Malerba and K. Lee, âAn Evolutionary Perspective on Economic Catch-Up by Latecomers.â Industrial and Corporate Change 30/4 (2021): 986â1010.
The state role was obvious in Hong Kong as well, considering Hong Kongâs heavy dependence on fresh water and staple food from Mainland China with artificially set prices well below the free market levels. In particular, for decades fresh water from the mainland was free of charge. See C. Howe, âGrowth, Public Policy and Hong Kongâs Economic Relationship with China.â China Quarterly 95 (1983): 512â33.
H. Myint, âThe âClassical Theoryâ of International Trade and the Underdeveloped Countries.â The Economic Journal 68/270 (1958): 317â37.
A. G. Frank, âDevelopment of Underdevelopment or Underdevelopment of Development in China.â Symposium on Chinaâs Economic History 4/3 (1978): 341â350; F. H. Cardoso and E. Faletto, Dependency and Development in Latin America (Berkeley: University of California Press, 1979); A. R. Puntigliano and Ãrjan Appelqvist, âPrebisch and Myrdal: Development Economics in the Core and on the Periphery.â Journal of Global History 6/1 (2011): 29â52; Immanuel Wallerstein, The Modern World-System (Berkley: University of California Press, 2011); A. Pierre-Richard, âCaught in the Middle? The Economics of Middle-income Traps.â Journal of Economic Surveys 31/3 (2016): 771â91; K. Pruchnik and J. Zowczak, âMiddle-income Trap: Review of the Conceptual Framework.â Asian Development Bank Institute Working Paper No. 760 (2017, Tokyo).
H.-J. Chang, Kicking Away the Ladder: Development Strategy in Historical Perspective (London: Anthem Press, 2002).
S. Hall, The West and the Rest: Discourse and Power (Durham, North Carolina: Duke University Press, 1992); N. Ferguson, Civilization: The West and the Rest (London: Penguin, 2011); M. Vernengo and D. Fields, âDisORIENT: Money, Technological Development and the Rise of the West.â Review of Radical Political Economics 48/4 (2016): 562â68.
E. van Ree, âLeninâs Conception of Socialism in One Country, 1915â17.â Revolutionary Russia 23/2 (2010): 159â81.
R. W. Davies, From Tsarism to the New Economic Policy: Continuity and Change in the Economy of the USSR (Ithaca, NY: Cornell University Press, 1991); R. Service, A History of Twentieth-Century Russia (Cambridge [MA]: Harvard University Press, 1997): 124â12; P. Kenez, A History of the Soviet Union from the Beginning to the End (Cambridge: Cambridge University Press, 2006): 47â8; V. N. Bandera, âThe New Economic Policy (NEP) as An Economic System.â Journal of Political Economy 71/3 (1963): 265â79.
M. Kaser, Comecon: Integration Problems of the Planned Economies (Oxford University Press, 1967); L. Crump and S. Godard, âReassessing Communist International Organisations.â Contemporary European History 27/1 (2018): 85â109.
K. Lányi, âThe Collapse of the COMECON Market.â Russian & East European Finance and Trade 29/1 (1993): 68â86.
Li Dazhao, âBu-ershiweike de Shengliâ (Victory of Bolshevism), in Li Dazhao, Li Dazhao Wenji (Collected Works of Li Dazhao) (Beijing: Peopleâs Press, 1984): vol. 1, p. 600.
Mao Zedong, âGuanyu Zhengque Chuli Remin Neibu Madunde Wentiâ (On the Correct Handling of Contradictions Among the People). In Mao Zedong Wenxuan (Collected Works of Mao Zedong), ed. Institute of Documents of the Chinese Communist Party Central Committee (Beijing: Peopleâs Press, 1999): vol. 7, p. 214. And, Mao Zedong. 1992. Gongzou Fangfa Liushi Tiao (Sixty Methods of the Party Work). In Mao Zedong Wenji (Selected Works of Mao Zedong), ed. Institute of Documents of the Chinese Communist Party Central Committee (Beijing: Central Archives): vol. 8, pp. 51â52.
Maoâs base camp in Jiangxi in 1929â1934 had a total of 42,000 square kilometres and a population of five million. This was merely 0.4 percent of Chinaâs total territory and 1.1 percent of Chinaâs total population. See Zhang Xianwen (ed.), Zhonghua Minguo Shi (A History of the Republic of China) (Nanjing: The University of Nanjing Press, 2005): vol. 2, p. 236.
Zhou Enlai, âGuanyu Dangde Liudade Yanjiuâ (Assessment of the Sixth National Congress of the Communist Party). In Cong Yida Dao Shiliuda (Memoirs of Participants in the First to Sixteenth Congress of the Chinese Communist Party), ed. Li Ying (Beijing: Central Documents Press, 2003): vol. 1, p. 316.
Anon., âWei Quanmiandi Tizao Wancheng He Chao-e Wancheng Wunian Jihua Er Fendouâ (Our Campaign for Comprehensively Over-fulfilling Our Five-year Plan Ahead of the Schedule) Renmin Ribao (Peopleâs Daily), 1st January, 1965, p. 1.
Beidaihe, or the Beidai River, has been an exclusive beach resort for top ranking communist officials.
Song Haiqing, Renmin Gongshe Xingwang Lu (Rise and Fall of the Peopleâs Commune) (Urumqi: Xinjiang Youth Press, 2000): vol. 2, pp. 403â4.
Li Rui, Lushan Huiyi Shilu (Records of the 1959 Lushan Conference) (Beijing: Spring-Autumn Press, 1989): 63.
Song, Rise and Fall: vol. 2, pp. 406, 409; Xue Muqiao, Xue Muqiao Huiyilu (Memoir of Xue Muqiao) (Tianjin: Tianjin Peopleâs Press, 1996): 255â6. If we assume that 80 percent of Chinese were rural and one-third of the rural population were able-bodied workers, about 50 percent of the rural workforce was fraughted to produce iron and steel.
An external reason was double embargoes imposed on China in the 1950s throughout the 1970s from the West due to Chinaâs role in the Korean War and from the Soviet Union thanks to Maoâs challenge to the Soviet leadership in the wake of Stalinâs death.
For the concept, see Mark Elvin, The Pattern of the Chinese Past (Stanford: Stanford University Press, 1973): 313.
Admittedly, the neo-classic model has limited explanatory power to fit a traditional economy in.
Here, the reader is reminded of the debate on âentitlementâ which puts society-wide food availability ahead of political leadersâ egocentric economic growth and development. See Amartya Sen, Poverty and Famines: An Essay on Entitlement and Deprivation (Oxford and New York: Oxford University Press, 1982).
See J. Becker, Hungry Ghost, Chinaâs Secret Famine (London: John Murray, 1996): ch. 18; Jin Hui, âSannian Ziyanzaihai Beiwangluâ (Memorandum on the Alleged Three Years of Natural Disasters, 1959â62), Shehui (Society) 4â5 (1993): 13â22; Cao Shuji, Da Jihuang, 1959â1961 Niande Zhongguo Renkou (Great Famine and Chinaâs Population in 1959â1961) (Hong Kong: Times International Publishing Co., 2005); Yang Jisheng, MubeiâZhongguo Liushi Niandai Dajihuang Jishi (Gravestone for the Great Leap Famine Victims, Evidence from History) (Hong Kong: Tiandi Books, 2008).
Admittedly again, the neo-classic model has limited explanatory power to fit in a transition from a market to a non-market economy.
The German phrase: âJeder nach seinen Fähigkeiten, jedem nach seinen Bedürfnissen;â see https://en.wikipedia.org/wiki/From_each_according_to_his_ability,_to_each_accord ing_to_his_needs, accessed 8th January 2024.
P. A. van Dyke, The Canton Trade: Life and Enterprise on the China Coast, 1700â1845 (Hong Kong: Hong Kong University Press, 2005); Manhong Lin, China Upside Down: Currency, Society, and Ideologies, 1808â1856 (Cambridge [MA]: Harvard University Asia Center, 2006); P. C. Perdue, The First Opium War (Cambridge [Mass.]: Massachusetts Institute of Technology Press, 2011); Haijian Mao, The Qing Empire and the Opium War: The Collapse of the Heavenly Dynast (Cambridge: Cambridge University Press, 2016).
The 73rd Congress of the United States, âSilver Purchase Act of 1943,â online vide: https://en.wikisource.org/wiki/Silver_Purchase_Act_of_1934, accessed 2nd January 2024.
Bank of China, âShijie Yinshi Julie Dongdang, Zhonghang Lizu Baiyin Wailiu, 1933 Nianâ1935 Nianâ (Extreme Volatility in the World Silver Market and Bank of Chinaâs Curbing Silver Outflow, 1933â1935), online vide: https://www.boc.cn/aboutboc/ab7/200809/t20080926_6918.html, accessed 2nd January, 2024. A Chinese silver dollar of the time weighed 26.6â26.9 grams with a silver content of 86 percent. Thus, 77 million silver dollars equaled 60.2â60.9 million ounces of pure silver.
E.g. R. L. Meek, The Economics of Physiocracy (London: Allen & Unwin, 1963): Pt. 3. Quesnayâs system accommodates the role of the state and limited industrial growth, see R. V. Eagly, âA Physiocratic Model of Dynamic Equilibrium.â Journal of Political Economy 77/1 (1969): 66â84; and A. L. Müller, âQuesnayâs Theory of Growth: A Comment.â Oxford Economic Papers, New Series 30/1 (1978): 150â6.
As summarized neatly by Mark Selden as (1) a self-sufficient economy free from foreign control, (2) the elimination of capitalist exploitation and the creation of a highly egalitarian society, (3) the feeding of one billion people and the provision of basic welfare for all, (4) rapid industrialisation, (5) the solution to the peasantry problem of unemployment and social marginalization; see his âMao Zedong and the Political Economy of Chinese Development.â China Report 24/2 (1988): 125â39. See also, S. Heilmann and E. J. Perry (eds), Maoâs Invisible Hand (Cambridge [MA]: Harvard University East Asian Center, 2011).
Mao Zedong. 1992. Gongzou Fangfa Liushi Tiao (Sixty Methods of the Party Work). In Mao Zedong Wenji (Selected Works of Mao Zedong), ed. Institute of Documents of the Chinese Communist Party Central Committee. Beijing: Central Archives: vol. 8, pp. 51â52.
Anon., Mao Zedong Sixiang Wansui (Long Live Mao Zedongâs Thought) (Beijing: Peking University, August 1969, SOAS Library Copy): 15; Bai Xi, Kaiguo Da Zhenfan (Sweeping Suppression of Anti-revolutionaries in the Early Days of the Peopleâs Republic) (Beijing: Chinese Communist Party History Press, 2006): 494.
Allegedly against embezzlement, waste, and bureaucracy among officials; and against bribery of the government officials, tax evasion, stealing from the state, cutting corners in state-contracted works, and spying on state economic secret by the private sector. For the data, see Liao Luyan, âGuanyu Jieshu Wufan Yundong He Chuli Yiliu Wentide Baogaoâ (Report on the Ending of the Five-Anti Movement and Its Residual Issues), 17th October, 1952 (Beijing: Central Archives); An Ziwen, âGuanyu Jieshu Sanfan Yundong He Chuli Yiliu Wentide Baogaoâ (Report on the Ending of the Three-Anti Movement and Its Residual Issues), 18th October, 1952 (Beijing: Central Archives).
âThe 1955 Hu Feng Pureâ was a total fabrication from start to finish, a sinister dry run for much wider purges. It was the first time when the Maoist secret police flexed their muscles. It set up the model for the following purges. It victimised 2,100 well-educated intellectuals of whom majority were in fact communist party members and communist supporter. None had their freedom back until 1980 (if they were still alive). See Li Hui, Hu Feng Jituan Yuan-a Shimo (A History of the Fabrication of the âHu Feng Cliqueâ) (Wuhan: Hubei Peopleâs Press, 2003); Sheng Guofan, Wo Suo Qinlide Hu Feng An, Faguan Wang Wenzheng Koushu (My Personal Experience of the Hu Feng Clique, Memoir of Judge Wang Wenzheng) (Beijing: Chinese Communist Party History Press, 2007).
Official figures, see Cong Jin, Quzhe Fazhande Suiyue (Period of Tortuous Development) (Zhengzhou: Henan Peopleâs Press, 1989): 61; see also Li Rui, Li Rui Tan Mao Zedong (Li Ruiâs Memoir on Mao Zedong) (Hong Kong: Time International Publishing Co., 2005): 2. See also Di Ren and Mai Dao, Mao Zedong He Tade Junshi Gaocan (Mao Zedong and His Military Aide) (Beijing: Red Flag Press, 1993): 132.
Li, Memoir on Mao: 147â8.
See Central Liaison Department of the Chinese Communist Party (ed.), Dangnei Shici Luxian Douzheng Ziliao (Materials of Ten Two-Line Struggles within the Chinese Communist Party) (Beijing: The Central Liaison Ministry of the Chinese Communist Party, 1972). Gao Gang was seen by Mao as a treat because Gaoâs close link with Stalin; see Zhang Hua and Su Caiqing (eds), Huizhou Wedge, Zhongguo Simian Wedge Benxi Yu Fans (Recollection of the Decade of Cultural Revolution, Analyses and Soul-Researching) (Beijing: Chinese Communist Party History Press, 2000): vol. 2, p. 605.
For a case called âThe Narrow Valleyâ (Jiabian Gou) in the Gobi Desert in remote Gansu, see survivalsâ accounts: He Fengming, JingliâWode 1957 Nian (The Year 1957 When A Disaster Struck on Me) (Lanzhou: Dunhuang Literature and Art Press, 2001); Yang Xianhui, Jiabian Gou Jishi (Diary in the Narrow Valley) (Shanghai: Shanghai Literature and Art Press, 2003).
Estimates, see Li, Memoir on Mao: 2; Hu Ping, âPing Mao Zedong Reâ (The âMao Zedong Feverâ). In Cultural Revolution, ed. Song: vol. 2, p. 951. See also J. Chang and J. Halliday, Mao, the Unknown Story (London: Vintage Books, 2005): 3.
J. Becker, Hungry Ghost, Chinaâs Secret Famine (London: John Murray, 1996): ch. 18; Jin Hui, âSannian Ziyanzaihai Beiwangluâ (Memorandum on the Alleged Three Years of Natural Disasters, 1959â62), Shehui (Society) 4â5 (1993): 13â22; J. K. Kung and J. Y. Lin, âThe Causes of Chinaâs Great Leap Famine, 1959â1961.â Economic Development and Cultural Change, 51/2 (2003): 51â73; Cao Shuji, Da Jihuang, 1959â1961 Niande Zhongguo Renkou (Great Famine and Chinaâs Population in 1959â1961) (Hong Kong: Times International Publishing Co., 2005). By far, the best works have been (1) Yang Jisheng, MubeiâZhongguo Liushi Niandai Dajihuang Jishi (Gravestone for the Great Leap Famine Victims, Evidence from History) (Hong Kong: Tiandi Books, 2008), and (2) F. Dikötter, Maoâs Great Famine: The History of Chinaâs Most Devastating Catastrophe, 1958â62 (London: Bloomsbury, 2010).
Hua Guofeng, âTuanjie Qilai, Wei Jianshe Shehuizhuyide Xiandaihua Qianguo Er Fendouâ (United to Build a Socialist Modern Power), Renmin Ribao (Peopleâs Daily), 27th February, 1978, p. 1.
Jiang Yuanming, Wangshi 1966 Xiezhen (Memory of 1966) (Tianjin: Hundred-Flower Art Press, 1998): 3.
For Chinaâs 1953 GDP, see National Bureau of Statistics, Zhongguo Tongji Nianjian, 2002 (Chinaâs Statistical Year Book, 2002) (Beijing: Chinaâs Statistics Press, 2002): 51. For the state assets, see Xi Xuan and Jin Chunming, Wenhua Dagemin Jianshi (A Short History of the Great Cultural Revolution) (Beijing: Central Party History Press, 1996): 349, 352.
Mao Zedong, âGei Jian Qingde Xin, 1966 Nian 7 Yue 8 Riâ (A Letter to Wife Jiang Qing on 8th July 1966), in Anon., Zhonghua Renmin Gongheguo Chunqiu Shilu (Records of Changes of the Peopleâs Republic of China) (Beijing: The Peopleâs University Press, 1992): 691.
J. Pomfret, Chinese Lessons (New York: Henry Holt, 2007): 13.
K. Deng, Mapping Chinaâs Growth and Development in the Long Run, 221 BC to 2020 (London: World Scientific Press and Imperial College Press): ch. 7.
E.g. H. Schmidt-Glintzer, â70 Per Cent Good, 30 Per Cent BadâChina Has Found A Simple Formula to Assess Mao Zedongâs Legacy.â Politics of Memory 10.08.2017, online vide: https://www.ips-journal.eu/in-focus/the-politics-of-memory/70-per-cent-good-30-per-cent-bad-2216/, accessed 2nd August 2022.
E.g. Dong Zhikai, Xinzhonghua Gongye Jingjishi, 1958â1965 (An Economic History of Industry of New China, 1958â1965) (Beijing: Economic Management Press, 1995); Liu Zhongli, DianjiâXinzhongguo Jingji 50 Nian (Laying the Foundationâ50 Years of the Economy of New China) (Beijing: Chinaâs Financial Economics Press, 1999); Dong Zhikai and Wu Li, Zhonghua Renmin Gongheguo Jingjishi, 1953â1957 (An Economic History of the Peopleâs Republic of China, 1953â1957) (Beijing: Social Science Literature Press, 2011); Zheng Yougui, Zhonghua Renmin Gongheguo Jingjishi, 1949â2019 (An Economic History of the Peopleâs Republic of China, 1949â2019) (Beijing: Contemporary China Press, 2019).
Yang, Gravestone. For early works that opened the discussion, see B. K. Ashton, H. A. Piazza and R. Zeitz, âFamine in China, 1958â61.â Population and Development Review 10/4 (1984): 613â45; T. P. Bernstein, âStalinism, Famine and Chinese Peasants: Grain Procurements during the Great Leap Forward.â Theory and Society 13/3 (1984): 339â77.
A string of early samples includes D. Perkins, Market Control and Planning in Communist China (Cambridge [MA]: Harvard University Press, 1966); A. Eckstein, W. Galenson, and T. Liu (eds), Economic Trends in Communist China (Chicago: Aldine Pub. Co, 1968); N-R. Chen and W. Galenson, The Chinese Economy under Communism (Chicago: Aldine Press, 1969); E. L. Wheelwright and B. McFarlane, The Chinese Road to Socialism (New York: Monthly Review Press, 1970); C. Hoffmann, âThe Maoist Economic Model.â Journal of Economic Issues 3/5 (1971): 12â27; J. Gray, âMao Tse-Tungâs Strategy for the Collectivization of Chinese Agriculture: An Important Phase in the Development of Maoism.â In Sociology and Development, eds E. De Kadt and G. Williams (London: Tavistock Press, 1974): 39â108; A. Eckstein, Chinese Economic Revolution (Cambridge: Cambridge University Press, 1977); T. G. Rawski, Economic Growth and Employment in China (London: Oxford University Press); Chu-yuan Cheng, Chinaâs Economic Development, Growth and Structural Change (London: Routledge Press, 1982); N. Lardy, Agriculture in Chinaâs Modern Economic Development (New York: Cambridge University Press, 1983); R. Bideleaux, Communism and Development (London: Methuen, 1985); V. Bodrova and R. Anker, Working Women in Socialist Countries: the Fertility Connection (Geneva: International Labour Office, 1985); C. Bramall, âInequality, Land Reform and Agricultural Growth in China, a Preliminary Treatment, 1952â55.â Journal of Peasant Studies 27/3 (2000): 30â54; B. Naughton, The Chinese Economy: Transitions and Growth (Cambridge [MA]: MIT Press, 2006): ch. 3; Y. Y. Kueh, Chinaâs New Industrialization Strategy: Was Chairman Mao Really Necessary? (Cheltenham: Edward Elgar, 2008): ch. 2.
H.-Y. Li, Mao and the Economic Stalinization of China, 1948â1953 (New York: Rowman & Littlefield, 2006).
Ministry of Finance, Zhongguo Caizheng Nianjian, 1997 (Chinaâs Financial Yearbook, 1997) (Beijing: Chinaâs Finance Magazine Press, 1997): 479; National Bureau of Statistics, Zhongguo Tongji Nianjian, 2002 (Chinaâs Statistical Yearbook, 2002) (Beijing: Chinaâs Statistics Press, 2002): 51.
National Bureau of Statistics, Statistical Yearbook, 2002: 51.
Ministry of Finance, Financial Yearbook, 1997: 479.
Yu Guangyuan (ed.), Chinaâs Socialist Modernization (Beijing: Foreign Language Press, 1984): 458.
E. Croll, The Family Rice Bowl: Food and the Domestic Economy in China (Geneva: UNRISD, 1983): 80.
Gao Wangling, Zhongguo Nongmin Fanxingwei Diaocha (Investigation into a Quiet Rebellion of the Chinese Peasantry against Maoism) (Beijing: Central Party History Press, 2006): 5.
A. N. Malafeev, Istoriia Tsenoobrazovaniia v SSSR (The History of Price Formation in the USSR) (Moscow: Mysl, 1964): 286; P. R. Gregory and R. C. Stuart, Soviet and Post-Soviet Economic Structure and Performance (New York: HarperCollins, 1994): 62.
Ling Zhijun, Lishi Buzi Paihuai (History, No More Hesitation) (Beijing: Peopleâs Press, 1997): 137.
In the West, the only place where a similar game can perpetuate is a prison where a prison shop has a monopolistic power over the captured population behind bars.
Yuan Xiaolun, âJibuzeshide Yuedu Jiyiâ (Readings during the Cultural Revolution), Yanhuang Chunqiu (History of Chinese Nation and People), 11 (2008): 68â9.
Anon., Zhonggong Zhongyang Guowuyuan Guanyu Tiaozheng Dangqian Shichang Wujiade Jueding (Decree of the Chinese Communist Party Central Committee and the State Council on Re-adjustment of Current Market Prices, 1965), online vide: http://news.xinhuanet.com/ziliao/2005-02/02/content_2539275.htm, accessed 20th September 2020.
Anon., âZhongguo Gongchandang Dishiyijie Zhongyangweiyuanhui Disanci Quanti Huiyi Gongbaoâ (Communiqué on the Third Plenary Meeting of the Eleventh Central Committee of Chinese Communist Party), Renmin Ribao (Peopleâs Daily), 24th December, 1978, p. 1.
A simple formula is Pext = (1 â 1/0.5pgr) + 0.15 pgi, where Pext is extra price; pgr, government rural price mark-down; pgi, government industrial price mark-up.
Malafeev, History of Price Formation: 286; Gregory and Stuart, Structure and Performance: 62.
K. Deng and J. Du, âTo Get the Prices Right for Food: The State versus the Market in Reforming China, 1979â2006.â European Review of Economic History 21/3 (2017): 302â25.
M. Elvin, The Pattern of the Chinese Past (Stanford: Stanford University Press, 1973); D. H. Perkins, Agricultural Development in China, 1368â1968 (Edinburgh: Edinburgh University Press, 1969); S. R. Dittrich and R. H. Myers, âResource Allocation in Traditional Agriculture.â Journal of Political Economy 79/4 (1971): 887â96; B. Li, Agricultural Development in Jiangnan, 1620â1850 (London: Macmillan, 1998); K. Pomeranz, The Great Divergence: Europe, China and The Making of the Modern World Economy (Princeton: Princeton University Press, 2000): Pt 1.
S. Paine, âBalanced Development: Maoist Conception and Chinese Practice.â World Development 4/4 (1976): 277â304; N. Lardy, Economic Growth and Distribution in China (Cambridge: Cambridge University Press, 1978); Y. Y. Kueh, âMao and Agriculture in Chinaâs Industrialization: Three Antitheses in a 50-Year Perspective.â China Quarterly 187 (2006): 700â23.
See F. Wemheuer, A Social History of Maoist China: Conflict and Change, 1949â1976 (Cambridge: Cambridge University Press, 2019).
It should be noted, however, that the achievability of a planned âbalance growthâ with millions of demand-supply equations all settled in a Walrasian general equilibrium has been seriously doubted; see e.g. M. Ellman, Planning Problems in the USSR (Cambridge: Cambridge University Press, 1973); J. Wilhelm, âDoes the Soviet Union Have a Planned Economy?â Soviet Studies 31/2 (1979): 268â74; M. Bornstein (ed.), The Soviet Economy (New York: Routledge Press, 1981), chs 1â3; D. K. Bose, âMarket and Plan in Soviet Union.â Economic and Political Weekly 24/2 (1989): 95â99; M. N. Rothbard, âThe End of Socialism and the Calculation Debate Revisited.â Review of Austrian Economics 5/2 (1991): 51â76.
R. K. Sah and J. E. Stiglitz, âThe Economics of Price Scissors.â American Economic Review 74/1, (1984): 125â138; Justin Lin and Yu Miaojie, âThe Economics of Price Scissors: An Empirical Investigation for China, Social Science Research Network, 2008, online vide: https://papers.ssrn.com/sol3/papers.cfm?abstract_id=1032404, accessed 27th December 2023.
In the later empirical parts of the paper, agricultural exports are added on. But the magnitude of such experts does not change the general conclusions of this study.
See Sah and Stiglitz, âEconomics of Price Scissors,â and Lin and Yu, âEconomics of Price Scissors.â
The assumption of an identical consumption function for the entire population across all sectors is based on the fact that institutionalized food rationing was strictly imposed upon the entire population during the Maoist period, thus leading to an identical demand structure for the entire population throughout the period in question.
See Lin and Yu, âEconomics of Price Scissors.â
In line with Lin and Yu, âEconomics of Price Scissors.â
This implies  .
.
Since the Quesnay-Maoist economy is a closed one, there is little room for trade in the model. This is where our model differs from those developed by Sah and Stiglitz as well as Lin and Yu.
Different from the Sah-Stiglitz model (Sah and Stiglitz, âEconomics of Price Scissorsâ) here, Maoist state was not to maximize social welfare. Rather, it aimed to catch up the West and the Soviet Union in industrialisation and modernization in a closed economy.
To be specific, food rationing of each group = the proportion of an age group in population à food rationing per head of the same age group. Due to limited data, we divide the total population into a childrenâs group (aged 0â15 years) and an adult group (aged 16 and over).
If the adult share in Chinaâs total population were 60.26% (1950), 59.30% (1953) and 58.34% (1956), for the data-missing years, we fill 1951 and 1952 with 59.30%, and 1954 and 1955 with 58.34%.
See relevant discussions in Z. Wang, P. Zhai, and H. Zhang, âVariation of Drought over Northern China during 1950â2000.â Journal of Geographical Sciences 13/4 (2003): 480â7; and M. Yu, Q. Li, M. J. Hayes, M. D. Svoboda, and R. R. Heim, âAre Droughts Becoming More Frequent or Severe in China Based on the Standardized Precipitation Evapotranspiration Index: 1951â2010?â International Journal of Climatology 34/3 (2014): 545â58. The precipitation anomaly data are collected from P. Zhai, X. Zhang, H. Wan, and X. Pan, âTrends in Total Precipitation and Frequency of Daily Precipitation Extremes over China.â Journal of Climate 18/7 (2005): 1096â1108.
Specifically, the disaster variable equals 1 if the normalized annual precipitation anomaly (percentage) is over 7.9 percentage points (Quartile 4), which includes 5 flood years (1953, 1954, 1959, 1964, 1973) and 2 drought years (1965, 1978).
We first fix the 1950 price as the base level for both the wholesale purchasing price index of farm products and the rural retail price index of industrial products. We then divide the (fixed-base) wholesale purchasing price index of farm products by the (fixed-base) rural retail price index of industrial products as scissors-pricing:
Also, scissors-pricing equals one in 1950 and then fluctuates across years depending on the change of both two prices. This is consistent with Justin Y. Lin, and Miaojie Yu, âThe Political Economy of Price Scissors in China: Theoretical Model and Empirical Evidence.â Economic Research Journal 1 (2009): 42â56.
C. Kitchens, âA Dam Problem: TVAâs Fight Against Malaria, 1926â1951.â Journal of Economic History 73/3 (2013): 694â724; K. Graddy, âTaste Endures! The Rankings of Roger de Piles (â 1709) and Three Centuries of Art Prices.â Journal of Economic History 73/3 (2013): 766â91; P. de Zwart, D. Gallardo-Albarrán, and A. Rijpma, âThe Demographic Effects of Colonialism: Forced Labor and Mortality in Java, 1834â1879.â Journal of Economic History 82/1 (2022): 211â49.
In Figure 6, the Great Leap Forward (1958â1962) can be seen to have caused an abnormal increase in industrial investment at the expense of agricultural output and hence the Great Leap Famine. We include the famine as additional control variable, which equals 1 if the year is between 1959 and 1961, otherwise 0.
Noted here, food output is no longer significant. This may be reasonable because grain output cannot always easily and directly be turned into industrial capital. The government either exports food for foreign exchange and imported equipment, or extracts funds from peasants (e.g. taxes and scissors-pricing) to finance investment in industry. Therefore, adding agricultural export and scissors-pricing decreases the influence of food outputs.
These results may be reasonable because during the sample period, the average of agricultural export was only 5.46 billion yuan, or 2.8% of Chinaâs total GDP (189.03 billion yuan). This suggests a thin margin of agricultural surplus left after the main extraction. Even so, agricultural export still contributes positively to industrial investment.
Noted, our high r (0.988), R2 and Adjusted R2 are as good as empirical analyses achieved in natural sciences.
We conduct two more statistical tests: Multicollinearity test and stationary test. The variance inflation factor multicollinearity test (VIF test) is 15.16 in our preferred estimation. Given the small sample size, it indicates limited multicollinearity in our regression, arising from the correlation between food output and other dependent variables (e.g., GDP). By removing the logarithm of food output, VIF test is 9.90, implying no multicollinearity problem at all. Additionally, Appendix Table A.1 presents the results of Dickey-Fuller stationary test (DF test). As all the non-binary variables in our preferred specification are stationary time series, such results indicate joint stationarity between outcome variable and dependent variables. These tests further validate our specification.
E.g. D. W. Chang, China Under Deng Xiaoping: Political and Economic Reform (New York: Palgrave Macmillan, 1988); B. Naughton, âDeng Xiaoping: The Economist.â China Quarterly 135 (1993): 491â514; M. Y. Kau and S. H. Marsh, China in the Era of Deng Xiaoping: A Decade of Reform (New York: Routledge, 1993); C. Tisdell, âEconomic Reform and Openness in China: Chinaâs Development Policies in the Last 30 Years.â Economic Analysis and Policy 39/2 (2009): 271â94; M. Dillon, Deng Xiaoping: The Man Who Made Modern China (London: I. B. Tauris, 2015).
On average, light industry only accounts for around 10 percent of the total industrial investment (1.38/12.79, see Table 10).
E.g. T-T. Hsueh and T-O. Woo, âThe Political Economy of the Heavy Industry Sector in the Peopleâs Republic of China.â China Journal 15/1 (1986): 57â82; E. A. Feigenbaum, âSoldiers, Weapons and Chinese Development Strategy: The Mao Era Military in Chinaâs Economic and Institutional Debate.â China Quarterly 158 (1999): 285â313; C. F. Meyskens, Maoâs Third Front, the Militarization of Cold War China (Cambridge: Cambridge University Press, 2020).
Even so, it becomes clear that the influence of âmonopsony price index of farming productsâ moves in the opposite direction of ârural retail price index of industrial products.â The former is negatively correlated to industrial investment; and the latter is positively correlated to it.
Previously, the disaster dummy equals 1 if the normalized annual precipitation anomaly (percentage land hit by disasters) is over 7.9 percentage points (Quartile 4), which includes 5 flood years (1953, 1954, 1959, 1964, 1973) and 2 drought years (1965, 1978). For robustness, we now define the disaster dummy as 1 if the area-averaged annual precipitation anomaly (mm) is over 43 millimeters (Quartile 4). This approach includes 11 flood years (1951, 1952, 1953, 1954, 1959, 1961, 1964, 1973, 1983, 1990, 1998) and 2 drought years (1978, 1986).
We now replace the dummy variable with the logarithm of normalized annual precipitation anomaly. It turns out that one percent increase of normalized annual precipitation anomaly would reduce the total industrial investment by 0.07 percent.
The Korean War is a dummy that equals 1 for 1950â53. And the Cultural Revolution is a dummy that equals 1 for 1966â76.
C. A. Holz, â âFast, Clear and Accurateâ: How Reliable Are Chinese Output and Economic Growth Statistics?â China Quarterly 173 (2003): 122â63.
R. P. Sinha, âChinese Agriculture: A Quantitative Look.â Journal of Development Studies 11/3 (1975): 202â23; T. G. Rawski, âWhat Is Happening to Chinaâs GDP Statistics?â China Economic Review 12/4 (2001): 347â54.
A. Cheremukhin, M. Golosov, S. Guriev, and A. Tsyvinski, âThe Political Development Cycle: The Right and the Left in Peopleâs Republic of China from 1953.â American Economic Review 114/4 (2024): 1107â1139.
To be specific, we use (1) total investment in fixed assets as a proxy for total industrial investment, (2) total rural population as a proxy for rural food rationing, (3) total export as a proxy for agricultural export, and (4) absorb disasters with year fixed effects.
E.g. D. W. Chang, China Under Deng Xiaoping: Political and Economic Reform (New York: Palgrave Macmillan, 1988); R. Evans, Deng Xiaoping and the Making of Modern China (London: Hamish Hamilton, 1993); E. F. Vogel, Deng Xiaoping and the Transformation of China (Cambridge [MA]: Harvard University Press, 2013); M. Dillon, Deng Xiaoping: The Man who Made Modern China (London: I. B. Tauris, 2015).
E.g. A. Maneschi, Comparative Advantage in International Trade: A Historical Perspective (Cheltenham: Edward Elgar, 1998); R. Ruffin, âDavid Ricardoâs Discovery of Comparative Advantage.â History of Political Economy 34/4 (2002): 727â48; R. A. Brecher, Z. Chen and, E. U. Choudhri, âAbsolute and Comparative Advantage, Reconsidered: The Pattern of International Trade with Optimal Saving.â Review of International Economics 10/4 (2002): 645â56; S. Parrinello, âNational Competitiveness and Absolute Advantage in a Global Economy.â Working Paper Dipartimento di Economia Pubblica 95 (2006): 1â23; E. Bellino and S. M. Fratini, âAbsolute Advantage and Capital Mobility in International Trade Theory.â European Journal of the History of Economic Thought 29/2 (2022): 271â93.


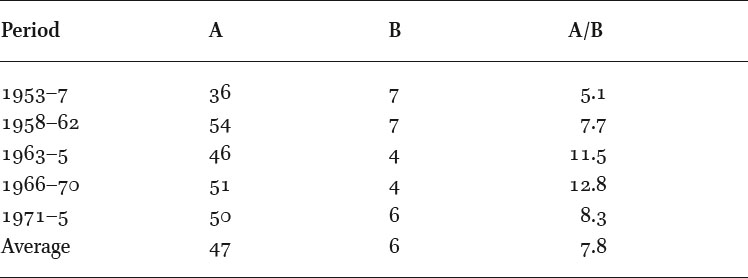

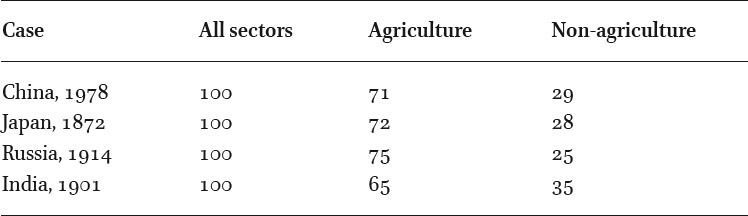


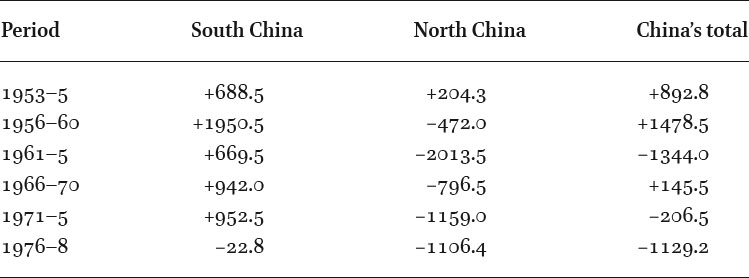
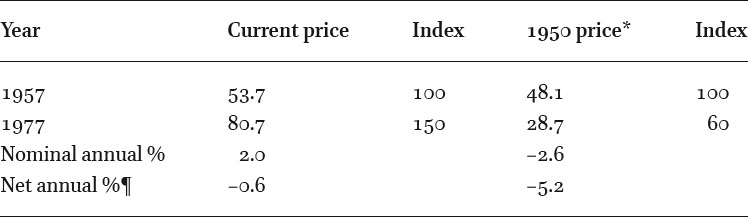


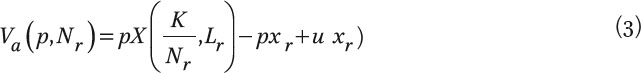


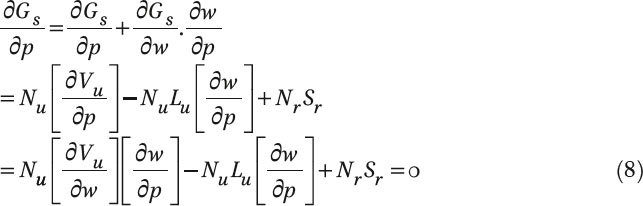

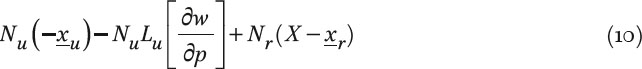

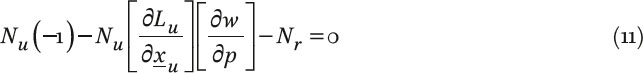

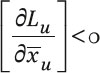


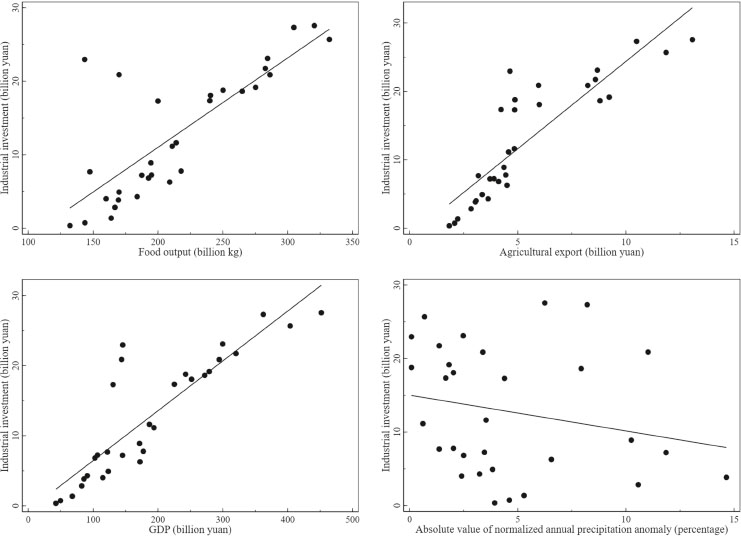

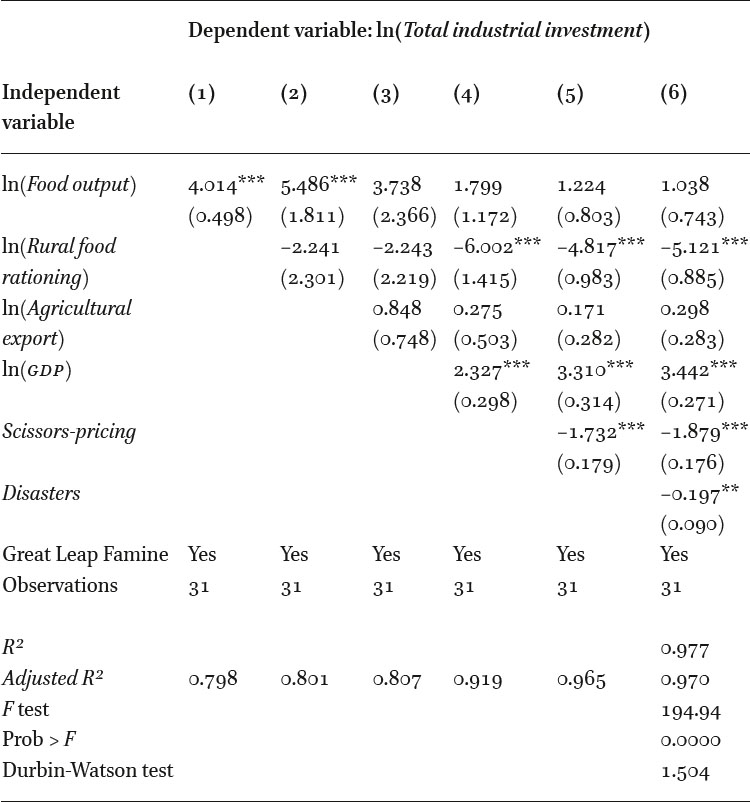

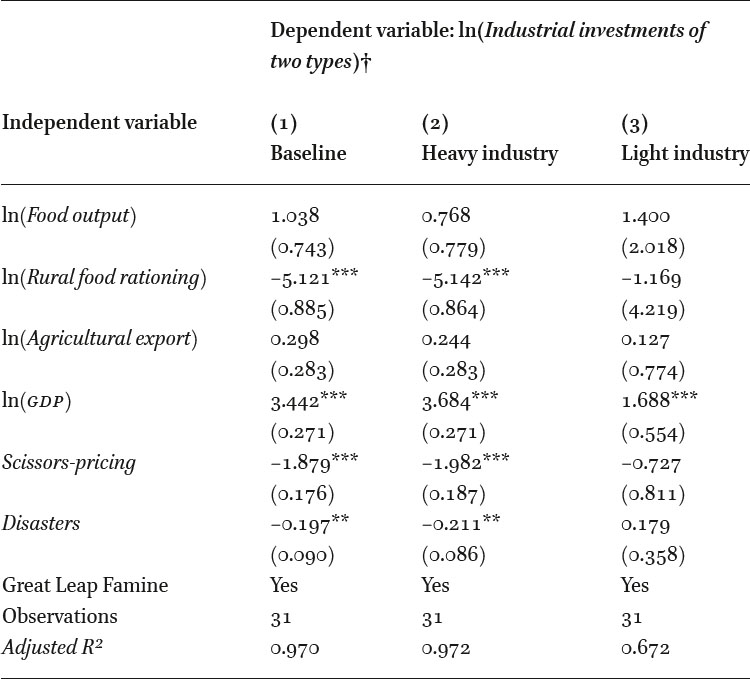

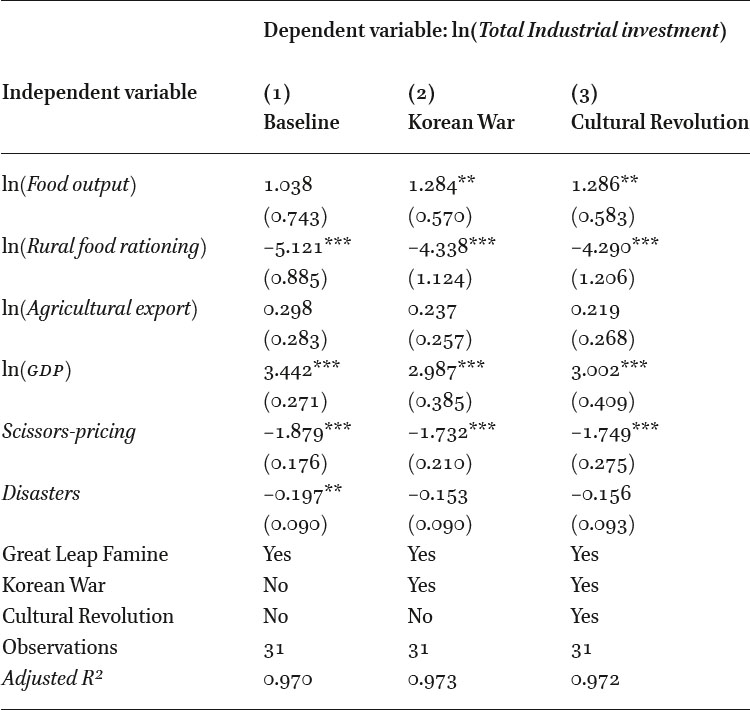


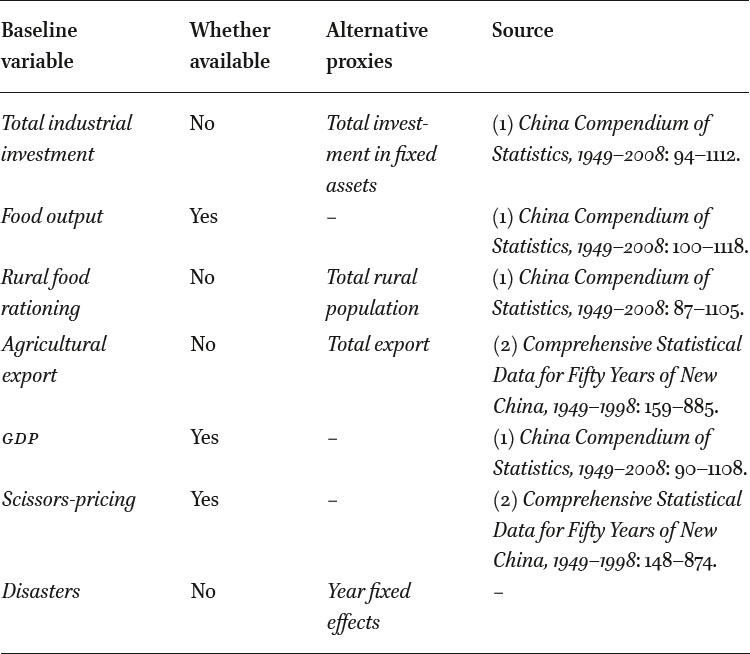

