Abstract
The Taiwanese egg industry employs both conventional caged and ethically-oriented non-caged production systems, yet potential inefficiencies can arise from using the same production parameters for both. This study analyzed data from a major Taiwanese egg producer, developing nonlinear bioeconomic models for egg production and hen mortality, revealing distinct differences between the two systems. While conventional cages optimize early production, non-caged systems offer more stable long-term egg production and lower mortality. Treating flock replacement as an asset replacement problem, simulations identified optimal replacement cycles to maximize profitability using average daily return (ADR). For caged systems, the current 456-day cycle is optimal. However, extending the cycle to 499 days in non-caged systems can boost egg production by 8.51% per flock and can increase ADR by 8.72% per hen over the same duration. Overall, these findings highlight the need for tailored management strategies and demonstrate the economic viability of the more ethical non-caged system.
1. Introduction
The global poultry industry is undergoing significant transformation, influenced by a multitude of factors including shifting consumer preferences, advancements in technology, heightened awareness of animal welfare, and the pressing need for improved biosecurity and disease control measures. Lupenko et al. (2021) highlight that these dynamics are reshaping production practices, while Altmann et al. (2023) emphasizes the growing consumer demand for ethically produced poultry products. In this context, the Taiwanese poultry industry exemplifies these global trends, reflecting a shift towards production diversification and technological integration, as well as an ethical evolution in farming practices. This dual-system approach, characterized by the coexistence of conventional caged systems and non-caged housing for egg-laying hens, presents both opportunities and challenges for producers (Aminuddin and Okdinawati, 2023).
The operational landscape of the Taiwanese poultry industry is complex, as many producers manage both caged and non-caged systems concurrently. This dual approach allows producers to meet diverse market demands and align with evolving societal values regarding animal welfare (Pohle and Cheng, 2009). However, established management protocols optimized for caged systems (Yassin et al., 2012) may not be directly applicable to non-caged environments, which require different strategies due to the inherent differences in hen behavior and resource utilization. For instance, while caged systems allow for controlled environments that facilitate optimal management practices, non-caged systems introduce challenges such as increased feed access, and variable disease transmission risks (Durmuş et al., 2015; Yu et al., 2014). These challenges thus necessitate the development of tailored management strategies that consider the unique dynamics of non-caged systems. The behavioral differences between hens in caged and non-caged environments further complicate management practices. Non-caged systems promote increased mobility and social interaction among hens, which can lead to both positive and negative outcomes (Lin et al., 2017). Consequently, the application of management strategies developed for caged systems can result in inefficiencies and increased production costs in non-caged settings.
The growing global consciousness surrounding animal welfare has significantly influenced consumer preferences, driving demand for products perceived as more humane and ethically produced (Van Loo et al., 2010). Estes et al. (2015) highlight the willingness of consumers to pay a premium for ethically aligned products, a trend also mirrored by legislative measures aimed at enhancing animal welfare. For instance, in 2022, Taiwan implemented a ban on battery cages for egg-laying ducks to raise welfare standards. The significant egg shortage experienced in Taiwan in 2023 (TVBS News, 2023), attributed to disease outbreaks and market fluctuations, underscores the vulnerability of the egg supply chain and highlights the need for a comprehensive reassessment of production and supply chain mechanisms. This situation serves as a reminder of the importance of resilience in food systems and the necessity for innovative approaches to poultry production.
To address these challenges, this paper proposes a novel perspective on the replacement of egg-laying hen flocks as a strategic asset replacement problem. This approach draws parallels with established practices in operations research and industrial engineering, where organizations routinely evaluate the cost-effectiveness of replacing aging assets with more efficient alternatives. For instance, in aviation and mining, organizations frequently assess the cost-effectiveness of updating older assets with newer, more efficient ones (Dakada and Amadi-Echendu, 2020). By extending these principles to the poultry industry, this study aims to investigate the optimal timing for flock replacement, considering factors such as age-related declines in egg production, feed conversion ratios, and mortality (Da Silva et al., 2017). This methodology not only enhances productivity and profitability but also aligns with the ethical considerations that are increasingly shaping consumer preferences and market dynamics (Dan et al., 2015; Kwadzo et al., 2013).
Utilizing a bioeconomic modeling framework, this study aims to maximize economic returns within Taiwan’s dual egg production system by refining management practices, with a focus on the strategic timing of flock replacement. The study identified different optimal flock replacement times for caged and non-caged hens post-sexual maturity, echoing the importance of customizing management strategies to each system to maximize profitability as applying caged-system heuristics to non-caged operations can cause inefficiencies. These principles are applicable beyond egg production, providing valuable insights for industries undergoing changes that impact production costs and efficiency. We also demonstrate that profitability in non-caged systems could be enhanced by adjusting the laying cycle, showing the economic benefits of optimizing laying periods in non-caged systems within a dual-system setup.
By developing a data-driven framework for optimizing flock replacement strategies, this study provides practical solutions for poultry producers, enabling them to increase profitability while addressing animal welfare concerns. This research synthesizes insights from operations management, decision science, and animal welfare to improve efficiency in egg production and the broader agricultural sector. It contributes to the increasing significance of advanced decision-making tools in enhancing agricultural productivity and sustainability (Bjørndal et al., 2012; Dziwornu and Sarpong, 2014; Haskaraca et al., 2022).
2. Literature review
2.1 Stages and dynamics of egg production
The chicken egg production supply chain involves distinct stages, beginning at breeding farms where fertile eggs are produced and transported to hatcheries. In hatcheries, controlled environments ensure the eggs develop into healthy chicks. These young female chicks, or pullets, are then raised in rearing facilities until they reach sexual maturity around 20 weeks. At this point, they move to layer farms to start their egg-laying phase.
Hens exhibit a dynamic egg-laying process throughout their productive lifespan, necessitating modeling techniques, such as bioeconomic modeling, to predict and optimize production outcomes. This approach utilizes historical data, which is often nonlinear (Narinc et al., 2013), to make economic projections and select the best breeder birds. The integration of biological performance with economic analysis helps refine decisions about breeding, feeding, and flock management, aligning operational strategies with financial objectives.
In literature, egg production dynamics are effectively modeled using a three-phase curve, characterized by an initial ascending phase, a peak representing maximum output, and a subsequent descending phase. Mathematically, the curve is segmented into corresponding sections: a positive slope from initial laying to the peak, the apex signifying peak production, and a negative slope from the peak to the cessation of egg production (Fialho and Ledur, 1997; Grossman et al., 2000; Savegnago et al., 2012). This model serves as an essential tool for economic planning and decision-making in the optimization of flock management and the enhancement of production efficiency.
The initial phase features a rapid increase in egg output as hens reach sexual maturity. Proper management of nutrition, health, and environmental conditions during this phase is crucial for optimal production (Leeson and Summers, 2008). During the peak phase, the focus is on maintaining high productivity while ensuring bird health, with efficient management practices required to sustain output. The final phase is marked by a gradual decline in egg production, signaling the end of the hens’ productive period. Decisions about culling and replacing older birds are necessary to maintain consistent production, with industry protocols often removing hens after about a year of laying (Bell and Weaver, 2002).
2.2 Hen welfare and egg production systems
Since the mid-20th century, battery cage systems have been pivotal in egg production, valued for maximizing profitability and efficiency. These cages are confined spaces made from wire mesh and metal partitions, providing each hen approximately 650 cm2 (21×31 cm) of space. This confinement significantly restricts natural behaviors, raising concerns about animal welfare and psychological health despite the economic benefits.
Non-cage housing systems, as highlighted by Sokołowicz et al. (2018), grant laying hens substantially more space than cage systems. Free-range and organic environments, for instance, offer at least double the space of battery cages, typically over 750 square centimeters per bird, promoting comfort behaviors and reducing aggression. This expanded space enhances hens’ freedom of movement and overall welfare, aligning with findings by Freire et al. (2003) that increased space can improve group dynamics and reduce mortality in cage-free environments.
Despite benefits to hen welfare, the dynamic environments of non-cage systems present significant challenges for egg producers. Berry et al. (2014) note that feed costs can account for 60–70% of total livestock production costs. As non-caged systems often result in higher energy expenditure and decreased feed efficiency among hens, this complicates efforts to optimize production for managers. Hens in non-caged systems are more active, leading to increased energy needs. This increased activity can result in greater feed consumption, thereby reducing feed efficiency compared to conventional caged systems. This highlights the need for tailored management strategies that address the specific challenges of non-caged egg production systems (Lay et al., 2011).
2.3 Flock replacement as an asset replacement decision
The replacement or upgrade of productive resources, driven by rising operational costs and advancements in technology, is essential for manufacturing organizations to maintain alignment with their product and marketing strategies (Chand et al., 1993). Earlier studies have developed frameworks for optimizing equipment replacement decisions through input-output analysis (Tanchoco and Leung, 1987). This approach is applied in scenarios such as the phasing out of army vehicles, where decision rules known as repair limits are used to balance the trade-offs between maintaining existing equipment and introducing newer models (Matsuo, 1988).
Traditional models often assume a fixed lifespan for equipment (Drinkwater and Hastings, 1967). However, evolving regulations and technological advancements typically require the adoption of more efficient and sustainable alternatives (Nair and Hopp, 1992; Nguyen et al., 2017). These changes may necessitate adjustments to the replacement schedule, potentially advancing or delaying the optimal time for asset replacement, depending on the balance between maintenance costs and the expenses of new assets (Yatsenko and Hritonenko, 2015).
In the context of egg production, each flock consists of hens of the same age, and as they age, a natural decline in productivity occurs. Hence, flocks are depreciating assets. Operations managers utilize strategic management techniques to pinpoint the optimal time for flock replacement, aiming to select the moment that yields the greatest economic benefit (Dogramaci and Fraiman, 2004). Given that egg quality remains high even towards the end of the laying cycle, extending this cycle can be a viable cost-saving approach. Thus, identifying the most suitable replacement time is critical for maximizing profitability.
Optimal replacement policies should consider both income and costs, aiming to maximize the expected discounted reward throughout a production cycle (Ahmadi, 2016). Integrated poultry companies typically employ fixed strategic management tactics to enhance productivity (Zhang et al., 2002). Although the standard industry practice maintains hen laying periods at 68–70 weeks, research has shown that hens can remain productive beyond this timeframe. Yet, extending the laying period beyond 90 weeks may not be economically sustainable (Traore and Doyon, 2023). Ongoing research is essential to ascertain the optimal duration of the laying cycle and its financial implications, especially in non-caged systems.
3. Research design and methodology
3.1 Data collection and analysis
This research analyzed the egg production performance of caged and non-caged layer hens within Taiwan’s egg production sector. We collaborated with one of Taiwan’s largest egg producers, Ruimu Food Co., Ltd., on a project aimed at enhancing the company’s production efficiency. The data provided by the company includes egg production records from three of its seven egg farms in the region, which collectively account for approximately 30% of the company’s total regional egg production. The caged and non-caged farms selected for this research are representative and do not differ significantly from the other farms not included in the study.
The dataset in this study included details on egg production, hen mortality, and feed records for 46 000 red-feathered hens,1 with 36 000 housed in cages and 10 000 in non-caged environments, reflecting the dominance of caged systems in Ruimu Food Co.’s operations. Despite the uneven distribution, the substantial sample sizes for both groups ensure statistically significant results and robust analysis (Cohen, 1988; Cohen, 1992). This dataset was subsequently employed for analysis and nonlinear modeling, details of which are provided later in this paper.
The analysis spanned from March 2018 to June 2019, covering 65 weeks of egg laying to encompass a full production cycle for each flock, from the onset of laying at 17 weeks to 82 weeks of age. Both housing systems received identical management practices, including laying period/flock replacement cycle.
MATLAB® (The MathWorks, 2023) and the Curve Fitting Toolbox (The MathWorks, n.d.) served as the primary tool for data analysis, modelling and optimization.
3.2 Research framework
This research proposes a detailed framework aimed at optimizing asset replacement decisions for broiler breeder flocks by focusing on two main objectives: predictive modeling of flock performance, and maximizing profitability. The integration of utilizing big data from an actual egg farm into this framework is a significant advancement, offering the potential to enhance decision-making processes by providing detailed insights into production attributes that are critical for optimizing outcomes (Ahearn et al., 2016).
The framework begins with the development of mathematical models that predict Hen-Day Egg Production (EP) and Cumulative Mortality (CM) across the laying cycle. Drawing on the methods validated by Lokhorst (1996), which demonstrated the efficacy of curve fitting techniques in aviary housing systems, this study applies similar methodologies to estimate these performance indicators. These models are crucial as housing systems have been shown to significantly impact these parameters. Non-caged systems are generally associated with lower mortality rates, though their effects on egg production can vary, showing both higher and lower outputs compared to caged systems, according to findings by He et al. (2022).
The next step involves constructing an economic performance model to calculate the Average Daily Return (ADR) as a measure of profitability for each laying cycle. This model incorporates the variations in egg production and mortality rates observed between the caged and non-caged systems.
Finally, the most economically viable length of the laying cycle that maximizes the ADR was identified. This optimization not only guides the timing for flock replacement but also facilitates the planning for the introduction of new flocks of hens, ensuring smooth and continuous production transitions. This strategic component is key to maintaining operational efficiency and is supported by the work of Feichtinger (2012) highlighting the importance of carefully timed interventions in production cycles.
3.3 Bioeconomic models
This study used MATLAB® and the Curve Fitting Toolbox to apply non-linear regression procedures, fitting non-linear models to the data from each flock. The Trust-Region method was selected due to its effectiveness in addressing the challenges associated with fitting curves to non-linear data (Hoseini and Nobakhtian, 2018). This method creates a trust region around the current best solution at each step to determine the next local optimum (Waltz et al., 2006). The Trust-Region algorithm is capable of handling complex problems, including those that are nonconvex or ill-conditioned, which are often encountered in non-linear optimization, particularly in problems formulated in infinite-dimensional space (Yuan, 2015).
Egg production model: Hen-day egg production (EP) is a metric reflecting the average daily egg-laying performance of hens present in the flock, calculated by dividing the total number of eggs laid each day by the total number of hens alive in the flock on that same day, then expressed as a percentage. While multiple studies indicate minimal differences in EP across various housing systems (Neijat et al., 2011), previous research suggests that conventional cages may exhibit higher egg production than alternative systems. The daily percentage of egg production is predicted using the following compartmental model in Equation (1).

Citation: International Food and Agribusiness Management Review 28, 5 (2025) ; 10.22434/ifamr.1189
This study builds on the compartmental model for egg production initially established by McMillan (1981), which is based on a hen’s physiological age, to characterize daily egg production. The model is particularly suitable due to its alignment with the known physiological processes of egg production in poultry.
The strength of the compartmental model lies in its ability to assign biological and physiological meaning to each of its parameters. Parameter a (Max daily output) represents the maximum potential daily egg output achievable under ideal conditions. Parameter b (Rate of increase) signifies the rate at which egg laying increases over time, while parameter c (Rate of decline) characterizes the rate of decline in egg production after reaching its peak output.
Cumulative mortality model: The number of hens remaining alive within the flock at any given time is a critical factor influencing both revenue potential (egg production) and operational costs (feed consumption). Cumulative mortality (CM) refers to the total number of hens that die naturally within a single laying cycle before flock replacement, expressed as a proportion of the initial flock size.
In agricultural studies on animal replacement, such as Scobie (1968) concerning sheep flock management, assumptions often simplify complex variables, such as ignoring mortality. However, in poultry science literature, the distinct mortality behaviors observed between caged and non-caged hens necessitate the inclusion of cumulative mortality in models to enhance accuracy, as differences in survival rates and their significant impact on production strategies in poultry operations are recognized.
Traditionally, researchers such as Adams and Bell (1980) estimated CM by interpolating data from the first and last week of the laying period. Mitchell et al. (2013) proposed a more robust approach using a logarithmic equation to predict cumulative mortality as a function of time. This logarithmic model has proven effective in capturing mortality trends across various production systems, enhancing the accuracy of CM estimation. The cumulative mortality of a batch of hens is identified with the model in Equation (2).
Citation: International Food and Agribusiness Management Review 28, 5 (2025) ; 10.22434/ifamr.1189
In this model, a (CM slope) is the sensitivity or responsiveness of cumulative mortality to changes in time, depicted on a logarithmic scale, while b (Base mortality), the model’s intercept, is the baseline level of mortality at the start of the observed period, acting as a reference point from which mortality changes are measured. Remaining chickens as a percentage of the flock (at a point in time before culling) can then be represented as 1 – CM(t).
3.4 Optimization model and parameters
To assess the economic viability of individual laying hens throughout their productive lifespan within a flock, the Average Daily Return (ADR) function, initially proposed by Long and Wilcox (2011), will be utilized for simulations to determine the optimal duration for laying cycle/flock retention. The ADR, as shown in Equation (3), is computed by subtracting total costs, including both variable and fixed elements, from the total profit generated from egg production, and dividing this value by the total number of days in the cycle. The total duration encompasses both the period when flocks are retained in the system and the transition period during which fixed costs continue to be incurred. ADR, in short, quantifies the daily profit for a cohort of hens over the production cycle.
Citation: International Food and Agribusiness Management Review 28, 5 (2025) ; 10.22434/ifamr.1189
The analysis will focus on identifying the optimal flock retention period (D), defined as the duration that maximizes economic returns by determining the most advantageous time to maintain a flock before initiating replacement. The specific ADR for each production system — conventional caged and non-caged — will be calculated involving EP and CM models, as shown in Equation (4), with the relevant parameters.
Citation: International Food and Agribusiness Management Review 28, 5 (2025) ; 10.22434/ifamr.1189
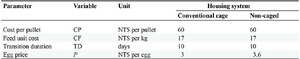
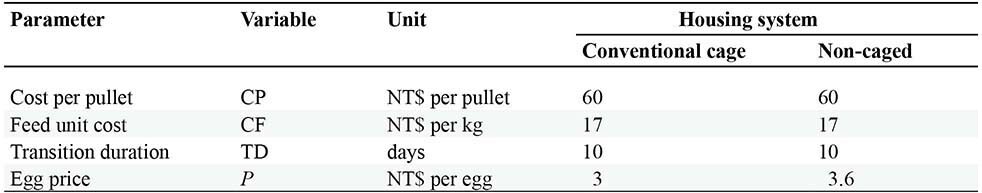
Where D is duration of flock retention (the decision variable), and the parameters are: EP(t), egg production model for each day t; CM(t), cumulative mortality model for each day t; CP, cost per pullet, CF, feed unit cost; AF, average feed consumption; TD, transition duration; P, egg price; and N, number of pullets.
ADR involves variable costs, predominantly feed costs,2 and fixed costs, based on the expense of acquiring pullets. ADR will be simulated with EP and CM models, as well as relevant assumptions provided in Table 1.
Model assumptions for ADR.
Citation: International Food and Agribusiness Management Review 28, 5 (2025) ; 10.22434/ifamr.1189
The average feed consumption (AF), meanwhile, is computed based on company data. Hens in caged system consume an average of 0.06 kg per day (SD=0.0002 kg). In contrast, hens in non-caged system consume an average of 0.12 kg per day (SD=0.0005 kg).3
4. Research results
4.1 Bioeconomic models
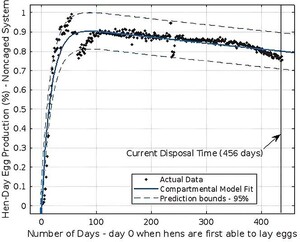
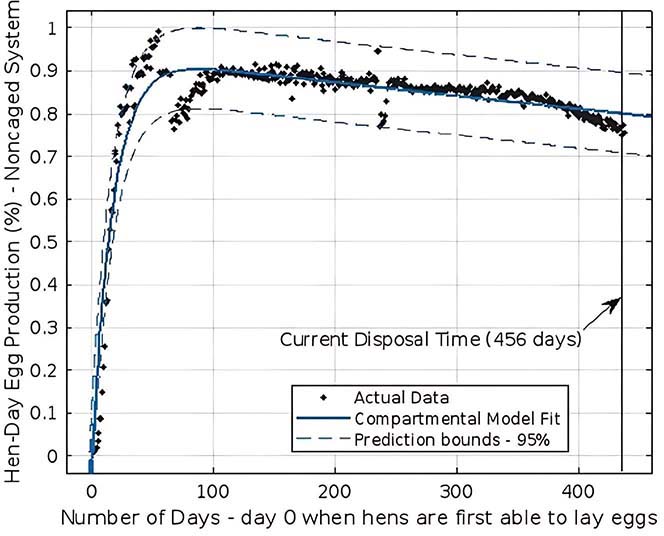
Egg production (EP) analysis: Curve fitting with the compartmental function in Equation (1), EP models and corresponding coefficient of determination (R2) for both caged and non-caged systems are detailed in Table 2. Values of R2 for both caged and non-caged system confirm adequacy of fit, suggesting that the models accurately represent the egg production trends in both systems. Figures 1 and 2 visually depict these three-phase EP curves, illustrating variations in egg production between the different systems.
Egg production (EP) compartmental model parameter estimates and curve fit.
Citation: International Food and Agribusiness Management Review 28, 5 (2025) ; 10.22434/ifamr.1189
EP model for hens in a conventional caged system.
Citation: International Food and Agribusiness Management Review 28, 5 (2025) ; 10.22434/ifamr.1189
EP model for hens in a non-caged system.
Citation: International Food and Agribusiness Management Review 28, 5 (2025) ; 10.22434/ifamr.1189
Conventional cages, with a higher value of parameter a, exhibit a greater capacity for achieving maximum daily egg production.
Conversely, non-caged systems are characterized by a different growth trajectory, as indicated by a higher value of parameter b. This parameter suggests that hens in non-caged systems reach their peak production more rapidly, typically within about 50 days, compared to the 90 days often required in conventional cage systems. This faster ramp-up to peak production could be attributed to more natural living conditions, which may stimulate early laying behavior.
However, the decline phase of egg production, represented by parameter c, is less steep in non-caged systems than in conventional cages. This indicates that while conventional cages may maximize production efficiency initially, they also experience a more pronounced reduction in output as the hens age. In contrast, non-caged systems tend to maintain a more stable production level over time, potentially enhancing the overall welfare and longevity of the hens.
These results show different operational characteristics and productivity patterns observed between conventional cage systems and non-caged environments. While conventional cages optimize early production efficiency, non-caged systems may offer advantages in terms of sustainability and animal welfare, maintaining steadier production levels throughout the hens’ productive lifespan.
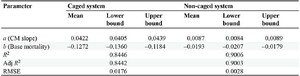
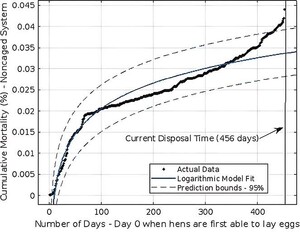
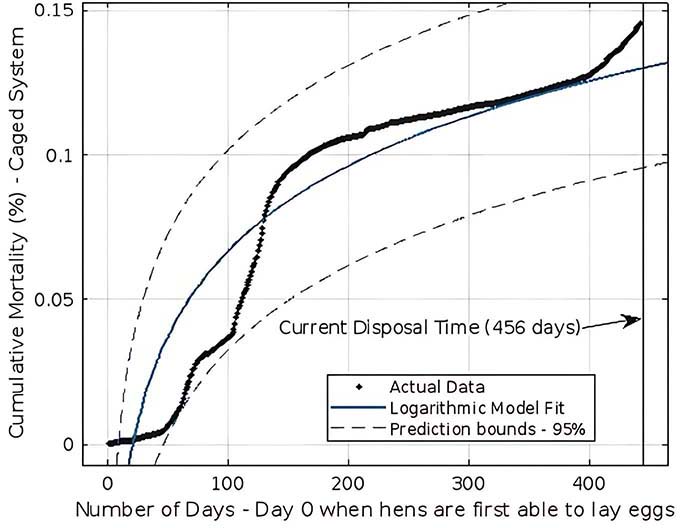
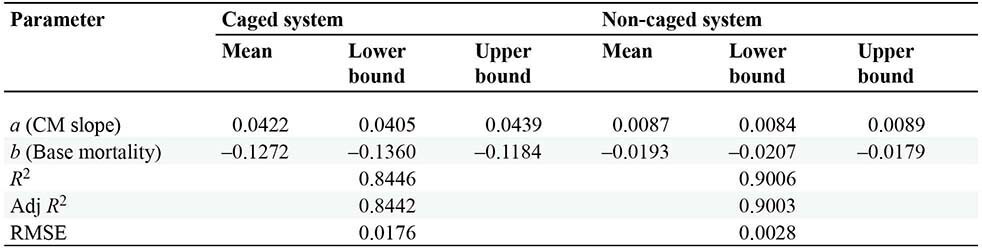
Cumulative mortality (CM) analysis: Analysis of CM leverages curve fitting with the logarithmic function specified in Equation (2), with results shown in Table 3. The models developed for both caged and non-caged systems demonstrate good statistical fits, with R2 values validating the effectiveness of the logarithmic function in accurately modeling CM across different housing configurations. For visual interpretation, Figures 3 and 4 graphically represent these models, illustrating the trends and differences in CM between the caged and non-caged systems.
Cumulative mortality (CM) model parameter estimates and curve fit.
Citation: International Food and Agribusiness Management Review 28, 5 (2025) ; 10.22434/ifamr.1189
Predicted CM of hens housed in conventional cages.
Citation: International Food and Agribusiness Management Review 28, 5 (2025) ; 10.22434/ifamr.1189
Predicted CM of hens housed in a non-caged system.
Citation: International Food and Agribusiness Management Review 28, 5 (2025) ; 10.22434/ifamr.1189
These results highlight a notable disparity in mortality rates between the two systems. Specifically, hens in conventional cages displayed a significantly higher mortality rate, with a cumulative mortality exceeding 12% at day 456, as opposed to around 4.5% observed in non-caged systems. These are consistent with findings by Schuck-Paim et al. (2021), who reported lower cumulative mortality rates in cage-free aviaries compared to traditional caged environments. This also supports literature that non-caged systems contribute to higher overall well-being for hens.
4.2 Optimal ADR simulations and flock replacement
To determine the optimal laying cycle duration for egg production and maximize economic returns across both conventional caged and non-caged systems, ADR simulations were performed with 10 000 conventional caged and 10 000 non-caged hens over a relevant period for egg production. These simulations were performed as detailed in Equation (4) using the obtained EP and CM models and assumptions in Table 1.
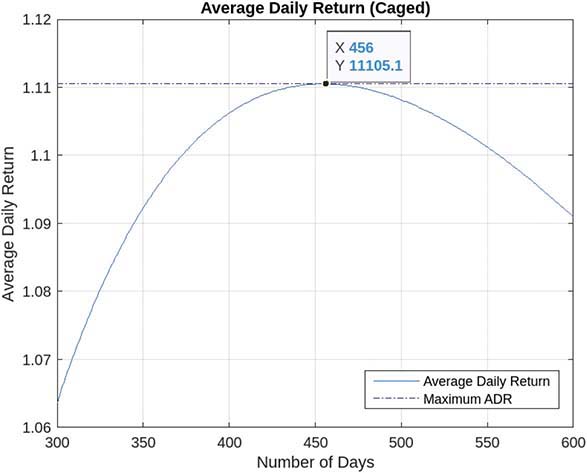
The industry standard for laying duration is set at 456 days, equivalent to approximately 82 weeks. Through extrapolation, ADR simulation indicates that this duration is optimal for caged production systems. This simulation also show that the ADR for this cycle stands at $11 105, as detailed in Figure 5. This finding supports the continued use of the current standard duration in maximizing economic value within caged environments.
Simulated ADR for a conventional caged system.
Citation: International Food and Agribusiness Management Review 28, 5 (2025) ; 10.22434/ifamr.1189
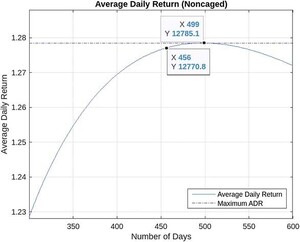
In contrast, simulation for non-caged systems indicate a possible increase in ADR by extending the laying cycle to 499 days, or approximately 88 weeks. This adjustment could increase the ADR to $12,785, significantly surpassing the earnings typically achieved under the current cycle. This finding is visually illustrated in Figure 6.
Simulated ADR for a non-caged system.
Citation: International Food and Agribusiness Management Review 28, 5 (2025) ; 10.22434/ifamr.1189
Implementing this extended cycle is projected to yield an additional profit of NT$7,485 per flock per cycle. By extending the laying period in non-caged systems to 499 days, we simulate an 8.51% increase in egg production per flock. Simulating and comparing the current 456-day cycle with the proposed 499-day cycle, ADR per hen will increase by 8.72% over the same duration. This suggests that the value obtained per hen is higher in the 499-day cycle in non-caged system.
These results show the economic and operational benefits of adjusting laying cycles, particularly for non-caged systems. Additionally, extending the productive lifespan of hens reduces the need for frequent replacements, promoting more sustainable farming practices (Appleby et al., 2004). Consequently, we recommend necessary adjustments to the flock replacement schedule on the non-caged system to capitalize on these benefits.
5. Conclusion
5.1 Summary
This study explores the production dynamics and economic viability of dual egg production systems, reflecting the industry’s evolving commitment to ethical practices. Utilizing data from a major Taiwanese commercial egg producer, the research differentiated the egg production rates and cumulative mortality trends observed in caged versus non-caged systems with bioeconomic modelling. It identified optimal flock replacement times of 454 days for caged hens and 499 days for non-caged hens post-sexual maturity. These results emphasize the importance of tailoring management strategies to each system to maximize profitability and the need for adaptive approaches in varying housing environments to align with both ethical standards and economic goals.
Additionally, the study demonstrates that the profitability of non-caged systems can be enhanced by adjusting the laying cycle/flock replacement accordingly. The proposed timeline for non-caged systems forecasts an 8.51% increase in egg production and an 8.72% increase in ADR per hen over the same duration. This increase in egg output and profit obtained per hen highlights the economic potential of optimizing laying periods for non-caged systems in a dual-system setup.
5.2 Theoretical implications
This study enhances the understanding of optimizing dual egg production systems — caged and non-caged — by applying operations research principles, increasingly relevant in the natural resources sector (Bjørndal et al., 2012). This approach integrates ethical considerations with economic imperatives, aiming to balance animal welfare with profitability. By applying asset management principles to flock replacement, the study highlights the need for flexible strategies that respond to technological and regulatory changes.
Empirically, the research supports the economic viability of non-caged systems, challenging the traditional reliance on caged system due to its profitability. This contributes to knowledge on sustainable agricultural practices and their economic impacts.
The use of nonlinear models and economic metrics like Average Daily Return (ADR) broadens the application of theoretical models to practical industry settings, offering a comprehensive framework that considers biological factors such as egg production and mortality rates, and corresponding economic returns.
5.3 Managerial implications
This study, conducted in collaboration with Ruimu Food Co., Ltd. — a major Taiwanese egg producer known for its scale — offers actionable insights into both caged and non-caged egg production systems. The choice of Ruimu Food, given its substantial share in the market and progressive adoption of both production systems, helps ensure that our findings are reflective of current industry practices while also pointing to future trends in ethical egg production.
A key contribution of this study lies in demonstrating how different production systems — each with distinct costs and returns — should be managed according to their specific parameters. Applying outdated heuristics from caged systems to non-caged operations can lead to inefficiencies, underscoring the need for tailored management approaches. This principle extends beyond egg production, offering valuable insights for industries experiencing process changes that affect production costs and efficiency.
Understanding the optimal laying cycles for each system enhances planning and resource allocation, significantly boosting profitability and promoting the adoption or expansion of non-caged systems. Managers can leverage growing consumer interest in ethically sourced eggs to differentiate their products, gain a competitive advantage, and foster brand loyalty. In an industry influenced by consumers’ shifting preferences towards sustainability, this study underscores the importance of demand-driven innovations to navigate these changes.
By aligning operations with global sustainability goals and regulatory standards, producers not only mitigate non-compliance risks but also enhance their corporate reputation. Adopting non-caged systems positions them as leaders in ethical and sustainable production, appealing to a global audience willing to pay a premium for such products. This approach is particularly pertinent in contexts like Taiwan, where evolving ethical standards and consumer expectations are reflected in regulatory changes such as the ban on battery cages for ducks.
The economic viability of non-caged systems demonstrated by this study supports a sustainable industry model aligned with UN Sustainable Development Goals (SDGs) and bolsters long-term market resilience and competitiveness. Furthermore, implementing dynamic asset replacement strategies improves operational efficiency and cost management, enabling managers to make informed decisions about when to replace assets, effectively balancing maintenance costs with the benefits of newer, more efficient technologies.
By embracing these strategies, egg producers can navigate the complexities of modern food markets, ensuring sustainable growth in an increasingly competitive global landscape.
Acknowledgements
The authors report there are no competing interests to declare. The data that support the findings of this study are available from Ruimu Food Co., Ltd. Restrictions apply to the availability of these data, which were used under license for this study. Data are available from the authors with the permission of Ruimu Food Co., Ltd.
References
Adams, C.J. and D.D. Bell. 1980. Predicting poultry egg production. Poultry Science 59(4): 937–938. https://doi.org/10.3382/ps.0590937
Ahearn, M.C., W. Armbruster and R. Young. 2016. Big Data’s potential to improve food supply chain environmental sustainability and food safety. International Food and Agribusiness Management Review 19A: 155–171. https://doi.org/10.22004/AG.ECON.240704
Ahmadi, R. 2016. An optimal replacement policy for complex multi-component systems. International Journal of Production Research 54(17): 5303–5316. https://doi.org/10.1080/00207543.2016.1173252
Altmann, B.A., A. Trinks and D. Mörlein. 2023. Consumer preferences for the color of unprocessed animal foods. Journal of Food Science 88(3): 909–925. https://doi.org/10.1111/1750-3841.16485
Aminuddin, R.R. and L. Okdinawati. 2023. A dynamic model for poultry supply chain in West Java. Journal of Business and Management Review 4(2): 104–128. https://doi.org/10.47153/jbmr42.6272023
Appleby, M.C., J.A. Mench and B.O. Hughes. 2004. Poultry behaviour and welfare. CABI, Wallingford.
Bell, D.D. and W.D. Weaver. 2002. Commercial chicken meat and egg production, 5th edn. Kluwer Academic, Boston, MA.
Berry, D.P., M.P. Coffey, J.E. Pryce, Y. De Haas, P. Løvendahl, N. Krattenmacher, J.J. Crowley, Z. Wang, D. Spurlock, K. Weigel, K. Macdonald and R.F. Veerkamp. 2014. International genetic evaluations for feed intake in dairy cattle through the collation of data from multiple sources. Journal of Dairy Science 97(6): 3894–3905. https://doi.org/10.3168/jds.2013-7548
Bjørndal, T., I. Herrero, A. Newman, C. Romero and A. Weintraub. 2012. Operations research in the natural resource industry. International Transactions in Operational Research 19(1–2): 39–62. https://doi.org/10.1111/j.1475-3995.2010.00800.x
Chand, S., T. McClurg and J. Ward. 1993. A single-machine replacement model with learning. Naval Research Logistics 40(2): 175–192. https://doi.org/10.1002/1520-6750(199303)40:2<175::AID-NAV3220400204>3.0.CO;2-Q
Cohen, J. 1988. Statistical power analysis for the behavioral sciences, 2nd edN. Lawrence Erlbaum Associates, Upper Saddle River, NJ.
Cohen, J. 1992. A power primer. Psychological Bulletin 112(1): 155–159. https://doi.org/10.1037/0033-2909.112.1.155
Da Silva, D.C.F., A.M.V. De Arruda and A.A. Gonçalves. 2017. Quality characteristics of broiler chicken meat from free-range and industrial poultry system for the consumers. Journal of Food Science and Technology 54(7): 1818–1826. https://doi.org/10.1007/s13197-017-2612-x
Dakada, M.H.C. and J.E. Amadi-Echendu. 2020. Asset replacement decisions in the context of the mining sector. In J.P. Liyanage, J. Amadi-Echendu and J. Mathew (Eds): Engineering assets and public infrastructures in the age of digitalization. Springer, Cham, pp. 358–366. https://doi.org/10.1007/978-3-030-48021-9_40
Dan, S.D., A. Tăbăran, O. Reget, D.V. Cordea, I.V. Cordiş and M. Mihaiu. 2015. Compositional and microbiological particularities of poultry meat obtained in a free-range system compared to the intensive growth system. Bulletin of University of Agricultural Sciences and Veterinary Medicine Cluj-Napoca. Veterinary Medicine 72(2): 391–395. https://doi.org/10.15835/buasvmcn-vm:11592
Dogramaci, A. and N.M. Fraiman. 2004. Replacement decisions with maintenance under uncertainty: an imbedded optimal control model. Operations Research 52(5): 785–794. https://doi.org/10.1287/opre.1040.0133
Drinkwater, R.W. and N.A.J. Hastings. 1967. An economic replacement model. Journal of the Operational Research Society 18(2): 121–138. https://doi.org/10.1057/jors.1967.24
Durmuş, İ., C. Mızrak, S. Kamanlı, Ş.E. Demirtaş, S. Kalebaşı, E. Karademir and M. Doğu. 2015. Poultry meat consumption and consumer trends in Turkey. Bitlis Eren University Journal of Science and Technology 2(1): 10–10. https://doi.org/10.17678/beuscitech.47145
Dziwornu, R.K. and D.B. Sarpong. 2014. Application of the stochastic profit frontier model to estimate economic efficiency in small-scale broiler production in the Greater Accra region of Ghana. Review of Agricultural and Applied Economics 17(2): 10–16. https://doi.org/10.15414/raae.2014.17.02.10-16
Estes, S., L.D. Edgar and D.M. Johnson. 2015. Consumer perceptions of poultry production: A focus on Arkansas. Journal of Applied Communications 99(4): https://doi.org/10.4148/1051-0834.1057
Feichtinger, G. 2012. Mathematical optimization and economic analysis. European Journal of Operational Research 221(1): 273–274. https://doi.org/10.1016/j.ejor.2012.03.018
Fialho, F.B. and M.C. Ledur. 1997. Segmented polynomial model for estimation of egg production curves in laying hens. British Poultry Science 38(1):66–73. https://doi.org/10.1080/00071669708417942
Freire, R., L.J. Wilkins, F. Short and C.J. Nicol. 2003. Behaviour and welfare of individual laying hens in a non-cage system. British Poultry Science 44(1): 22–29. https://doi.org/10.1080/0007166031000085391
Grossman, M., T.N. Gossman and W.J. Koops. 2000. A model for persistency of egg production. Poultry Science 79(12): 1715–1724. https://doi.org/10.1093/ps/79.12.1715
Haskaraca, G., Y. Arslan and Z. Ayhan. 2022. Evaluation of factors affecting consumers’ poultry meat consumption habits and perceptions and poultry breeding processes. Gıda 47(6): 1014–1031. https://doi.org/10.15237/gida.GD22080
He, S., J. Lin, Q. Jin, X. Ma, Z. Liu, H. Chen, J. Ma, H. Zhang, K. Descovich, C.J.C. Phillips, K. Hartcher and Z. Wu. 2022. The relationship between animal welfare and farm profitability in cage and free-range housing systems for laying hens in China. Animals 12(16): 2090. https://doi.org/10.3390/ani12162090
Hoseini, N. and S. Nobakhtian. 2018. A new trust region method for nonsmooth nonconvex optimization. Optimization 67(8): 1265–1286. https://doi.org/10.1080/02331934.2018.1470175
Kwadzo, G., F. Dadzie, Y. Osei-Asare and J.K.M. Kuwornu. 2013. Consumer preference for broiler meat in Ghana: A conjoint analysis approach. International Journal of Marketing Studies 5(2): p66. https://doi.org/10.5539/ijms.v5n2p66
Lay, D.C., R.M. Fulton, P.Y. Hester, D.M. Karcher, J.B. Kjaer, J.A. Mench, B.A. Mullens, R.C. Newberry, C.J. Nicol, N.P. O’Sullivan and R.E. Porter. 2011. Hen welfare in different housing systems. Poultry Science 90(1): 278–294. https://doi.org/10.3382/ps.2010-00962
Leeson, S. and J.D. Summers. 2008. Commercial poultry nutrition, 3 edN. Nottingham University Press, Nottingham.
Lin, X., D. Zhang, X. Wang, Y. Huang, Z. Du, Y. Zou, J. Lu and Y. Hao. 2017. Attitudes of consumers and live-poultry workers to central slaughtering in controlling H7N9: A cross-sectional study. BMC Public Health 17(1): 517. https://doi.org/10.1186/s12889-017-4374-9
Lokhorst, C. 1996. Mathematical curves for the description of input and output variables of the daily production process in aviary housing systems for laying hens. Poultry Science 75(7): 838–848. https://doi.org/10.3382/ps.0750838
Long, A. and S. Wilcox. 2011. Optimizing Egg Revenue for Poultry Farmers. Available eonline at https://www.researchgate.net/publication/228452145_Optimizing_Egg_Revenue_for_Poultry_Farmers
Lupenko, Yu.O., N.Hr. Kopytets and V.M. Voloshyn. 2021. Structural changes in the meat market. BIO Web of Conferences 36: 08006. https://doi.org/10.1051/bioconf/20213608006
Matsuo, H. 1988. A modified approach to the replacement of an existing asset. The Engineering Economist 33(2): 109–120. https://doi.org/10.1080/00137918808966947
Matthews, W.A. and D.A. Sumner. 2015. Effects of housing system on the costs of commercial egg production. Poultry Science 94(3): 552–557. https://doi.org/10.3382/ps/peu011
McMillan, I. 1981. Compartmental model analysis of poultry egg production curves. Poultry Science 60(7): 1549–1551. https://doi.org/10.3382/ps.0601549
Mitchell, D., P. Brockett, R. Mendoza-Arriaga and K. Muthuraman. 2013. Modeling and forecasting mortality rates. Insurance: Mathematics and Economics 52(2): 275–285. https://doi.org/10.1016/j.insmatheco.2013.01.002
Morales-Suárez, W., L.D. Daza and H.A. Váquiro. 2023. Artificial neural networks for modeling and optimizing egg cost in second-cycle laying hens based on dietary intakes of essential amino acids. AgriEngineering 5(4): 1832–1845. https://doi.org/10.3390/agriengineering5040112
Nair, S.K. and W.J. Hopp. 1992. A model for equipment replacement due to technological obsolescence. European Journal of Operational Research 63(2): 207–221. https://doi.org/10.1016/0377-2217(92)90026-6
Narinc, D., E. Karaman, T. Aksoy and M.Z. Firat. 2013. Investigation of nonlinear models to describe long-term egg production in Japanese quail. Poultry Science 92(6): 1676–1682. https://doi.org/10.3382/ps.2012-02511
Neijat, M., J.D. House, W. Guenter and E. Kebreab. 2011. Calcium and phosphorus dynamics in commercial laying hens housed in conventional or enriched cage systems. Poultry Science 90(10): 2383–2396. https://doi.org/10.3382/ps.2011-01401
Neves, M.F., A.W. Gray, C.E. Lourenço and F.A. Scott. 2021. Mantiqueira: Innovating and disrupting in the egg business. International Food and Agribusiness Management Review 24(1): 138–161. https://doi.org/10.22434/IFAMR2020.0031
Nguyen, K.T.P., T. Yeung and B. Castanier. 2017. Acquisition of new technology information for maintenance and replacement policies. International Journal of Production Research 55(8): 2212–2231. https://doi.org/10.1080/00207543.2016.1229069
Pohle, K. and H.-W. Cheng. 2009. Furnished cage system and hen well-being: comparative effects of furnished cages and battery cages on behavioral exhibitions in White Leghorn chickens. Poultry Science 88(8): 1559–1564. https://doi.org/10.3382/ps.2009-00045
Savegnago, R.P., V.A.R. Cruz, S.B. Ramos, S.L. Caetano, G.S. Schmidt, M.C. Ledur, and D.P. Munari. 2012. Egg production curve fitting using nonlinear models for selected and nonselected lines of White Leghorn hens. Poultry Science 91(11): 2977–2987. https://doi.org/10.3382/ps.2012-02277
Schuck-Paim, C., E. Negro-Calduch and W.J. Alonso. 2021. Laying hen mortality in different indoor housing systems: a meta-analysis of data from commercial farms in 16 countries. Scientific Reports 11(1): 3052. https://doi.org/10.1038/s41598-021-81868-3
Scobie, G.M. 1968. Economic aspects of replacement policies in Merino sheep flocks. Quarterly Review of Agricultural Economics 21(3): 126–139.
Sokołowicz, Z., J. Krawczyk and M. Dykiel. 2018. The effect of the type of alternative housing system, genotype and age of laying hens on egg quality. Annals of Animal Science 18(2): 541–556. https://doi.org/10.2478/aoas-2018-0004
Taiwan Ministry of Agriculture. 2024. Public AgriData Exchange. Available online at https://data.moa.gov.tw/open_search.aspx?id=619
Tanchoco, J.M.A. and L.C. Leung. 1987. An input-output model for equipment replacement decisions. Engineering Costs and Production Economics 11(2): 69–78. https://doi.org/10.1016/0167-188X(87)90013-9
The MathWorks. n.d. Curve Fitting Toolbox. The MathWorks, Natick, MA. Available online at https://www.mathworks.com/products/curvefitting.html
The MathWorks. 2023. MATLAB Version 23.2 (R2023b). The MathWorks, Natick, MA. Available online at https://www.mathworks.com
Traore, O.Z. and M. Doyon. 2023. Economic sustainability of extending lay cycle in the supply-managed Canadian egg industry. Frontiers in Animal Science 4: 1201771. https://doi.org/10.3389/fanim.2023.1201771
Trejo-Pech, C.J.O. and J.M. Thompson. 2021. Discounted cash flow valuation of conventional and cage-free production investments. International Food and Agribusiness Management Review 24(2): 197–214. https://doi.org/10.22434/IFAMR2020.0046
TVBS News. 2023. No immediate solution to Taiwan’s egg shortage problem. Available online at: https://news.tvbs.com.tw/english/2074688
Van Loo, E., V. Caputo, R.M. Nayga Jr., J. Meullenet, P.G. Crandall and S.C. Ricke. 2010. Effect of organic poultry purchase frequency on consumer attitudes toward organic poultry meat. Journal of Food Science 75(7): S384–S397. https://doi.org/10.1111/j.1750-3841.2010.01775.x
Waltz, R.A., J.L. Morales, J. Nocedal and D. Orban. 2006. An interior algorithm for nonlinear optimization that combines line search and trust region steps. Mathematical Programming 107(3): 391–408. https://doi.org/10.1007/s10107-004-0560-5
Yang, Y.-C. 2018. Factors affecting consumers’ willingness to pay for animal welfare eggs in Taiwan. International Food and Agribusiness Management Review 21(6): 741–754. https://doi.org/10.22434/IFAMR2017.0072
Yassin, H., A.G.J. Velthuis, G.W.J. Giesen and A.G.J.M. Oude Lansink. 2012. A model for an economically optimal replacement of a breeder flock. Poultry Science 91(12): 3271–3279. https://doi.org/10.3382/ps.2012-02290
Yatsenko, Y. and N. Hritonenko, N. 2015. Algorithms for asset replacement under limited technological forecast. International Journal of Production Economics 160: 26–33. https://doi.org/10.1016/j.ijpe.2014.08.020
Yu, H., J.T. Wu, B.J. Cowling, Q. Liao, V.J. Fang, S. Zhou, P. Wu, H. Zhou, E.H.Y. Lau, D. Guo, M.Y. Ni, Z. Peng, L. Feng, H. Jiang, H. Luo, Q. Li, Z. Feng, Y. Wang, W. Yang and G.M. Leung. 2014. Effect of closure of live poultry markets on poultry-to-person transmission of avian influenza A H7N9 virus: an ecological study. The Lancet 383(9916): 541–548. https://doi.org/10.1016/S0140-6736(13)61904-2
Yuan, Y. 2015. Recent advances in trust region algorithms. Mathematical Programming, 151(1): 249–281. https://doi.org/10.1007/s10107-015-0893-2
Zhang, Y.L., R.C.M. Yam and M.J. Zuo. 2002. Optimal replacement policy for a multistate repairable system. Journal of the Operational Research Society 53(3): 336–341. https://doi.org/10.1057/palgrave.jors.2601277
Corresponding author
Notably, red-feathered chickens constituted 55% of Taiwan’s colored chicken population in the second quarter of 2019, highlighting their substantial role in national egg production.
Feed cost account for over 70% of total production expenses (Morales-Suárez et al., 2023).
This finding is consistent with existing literature, which indicates that feed consumption is generally higher in non-caged systems. Studies have shown that hens in non-caged environments tend to have increased energy expenditure due to greater freedom of movement, leading to higher overall feed intake compared to their caged counterparts (Lay et al., 2011). This correlation supports the validity of the company’s data and alignment with literature.


