Abstract
A genetically edited high-oleic soybean seed has been recently introduced. There has also been increasing demand for healthy substitutes for low-oleic oils and even a regulatory ban on trans-fats in processed foods. The likely market and welfare impact of the new variety on the U.S. soybean and oil markets, with and without the transfat ban, are quantified by using an equilibrium displacement model. The results indicate that the introduction of the variety alone would have little market impact, given the estimated yield drag relative to current varieties. The primary beneficiaries of the variety introduction combined with trans-fat bans we find to be consumers of low-oleic oil because of a price decrease and land owners because of a price increase. The biggest losers would be corn consumers because of a price increase and soybean processors because of a price decrease. The food and agribusiness sector might increase benefits further through marketing campaigns potentially driving higher demand for high-oleic products.
1. Introduction
A gene-edited (GE) high-oleic soybean variety was commercially released in the United States in 2019, offering improved oil composition and oxidative stability compared to conventional soybean varieties. Developed without transgenic modification, such as that used in conventional genetically modified (GM) soybean varieties, this GE variety was introduced during a period of increasing regulatory pressure to eliminate trans-fats from the food supply. As a result, GE high-oleic soybeans represent a targeted innovation that aligns with evolving market and policy preferences for healthier edible oils. This study examines the expected market impacts of adopting gene-edited high-oleic soybean in the U.S. soybean and oil markets, both with and without a policy to ban trans-fats in food manufacturing.
Soybeans are one of the most economically important crops in the United States, with over 33.6 million ha cultivated in 2025. The crop supports a broad value chain encompassing seed developers, farmers, processors, food manufacturers, and consumers. The soybean processing industry crushes the crop to provide soybean oil and soybean meal, with the remainder of soybean production primarily exported as whole beans. Soybean oil accounts for more than half of the U.S. edible oil consumption. Recent food policy changes, specifically the U.S. Food and Drug Administration’s ban on partially hydrogenated oils, have led food manufacturers to seek healthier and more stable oil alternatives. In this context, high-oleic oils derived from GE soybeans are gaining importance as substitutes for trans-fat-producing oils. However, their adoption depends on identity-preserved (IP) supply chains that ensure segregation from conventional soybeans, which increases coordination requirements and production costs (Nicholson et al., 2023).
While the nutritional attributes of high-oleic soybean oil are well recognized, the economic and market-level consequences of this new variety remain largely unexplored. Previous studies have theoretically considered the market potential of high-oleic soybeans (Darroch and Jardine, 2002; Giannakas and Yiannaka, 2004), yet no empirical quantification of value chain impacts under real-world market and policy conditions has been presented.
To address this gap, this study uses an equilibrium displacement model (Perrin, 1997, Brester et al. 2023) to examine the potential market responses and welfare impacts of the introduction of GE high-oleic soybean to the U.S. across the entire supply chain. We consider these outcomes with and without a ban on trans-fats in food manufacturing that would increase demand for the oil produced by this GE soybean. The multimarket model we use simulates the effects of these two shocks on prices and quantities in each market comprising the supply chain and allows us to estimate the welfare effects on the different stakeholders in the supply chain.
Our results show that in the presence of a trans-fat ban, GE high oleic soybean technology can increase the economic well-being of soybean farmers, even though an additional production cost is predicted for the new variety. Consumer surplus measures of welfare indicate that consumers of traditional low-oleic oil would gain because that price falls, while consumers of GE high-oleic oil (primarily food manufacturers) would lose, but would lose less than the low-oleic consumers gain. These welfare measures do not whether the trans-fat ban is good or bad policy, because the consumer preferences expressed by demand elasticities for the two types of oil do not reflect health benefits that motivated the policy. The study does reveal that a trans-fat ban policy has a big impact on the effect of the new variety: the supply-side introduction of the GE variety alone would have little impact. The market success of a GE high-oleic soybean variety such as this is likely to depend less on supply-side efficiencies and more on the expansion of trans-fat regulations and consumer demand for oils with improved health attributes.
2. Methods
The study employs comparative statics in a multimarket partial equilibrium model, also known as an Equilibrium Displacement Model (EDM) (Brester et al., 2023; Muth, 1964; Perrin, 1997), to simulate the effects of a supply and a demand shock to the markets involved in the value chain for soybeans. This study considers a value chain in which high-oleic soybean seeds are marketed to farmers, soybean production is procured from farmers by exporters and by soybean processors who sell soybean oils to food manufacturers which in turn sell oil-containing products to consumers. The model quantifies how the introduction of a new GE high-oleic soybean (supply shocks) and policy-driven demand shocks propagate price and quantity changes through the soybean value chain.
We use log-linearized supply and demand equations representing equilibrium in the related markets of the soybean value chain under competitive market conditions. The rationale behind adopting a perfectly competitive market model is based in part on the low market concentration level in food processing industry, representing about 80% of final soybean oil consumption, and in part on the relatively minor changes in modeling and outcome that a monopsonistic specification would achieve.
Food processing markets in the United States have low market concentration levels. According to Gschwandtner and Hirsch (2018), the Herfindahl–Hirschman Indexes (HHI) were found to be lower than 1500 on average. This finding is consistent with the study conducted by Saitone and Sexton (2017), which categorized 29 out of 37 food manufacturing and retailing (NAICS-6) industries as unconcentrated, with only three industries considered highly concentrated. The particular industries in which edible oils are used as a raw material, such as frozen cakes, pies, and other pastries, have HHI values lower than 1500, where 1500 is a threshold that represents a moderate level of concentration in the industry.
Currently, high-oleic soybean seed suppliers include Corteva and Calyxt.1 The contracted hectares of high-oleic soybean (2023–2024) is reported to be 0.69 million ha (John Jensen, Vice president of oil strategy, U.S. Soybean Board, private communication, 3 February 2021), which to some extent establishes the viability of the identity-preserved supply chain. Introduction of the high-oleic soybeans into the supply chain increases costs required for segregation and identity preservation (Nicholson et al., 2023; Smyth and Phillips, 2001; Tillie and Cerezo, 2015) which are accounted for in our model. In addition, our model incorporates a higher cost of farm production of the high-oleic soybean relative to conventional soybean due to a likely yield reduction relative to existing varieties (also known as “yield drag”). For successful innovation, these additional costs must be offset by a premium for the high-oleic characteristic.
The model incorporates a demand-side shock due to a trans-fat ban, which shifts food manufacturers’ purchases toward high-oleic oils. Concurrently with the release of the GE variety, a ban on the use of trans-fats in food manufacturing is being implemented in the U.S., the EU (European Union), and Canada, with support from the World Health Organization (WHO). In the U.S., food manufacturers are required to replace partially hydrogenated oils with alternatives such as palm oil, liquid high-oleic oils (e.g., high-oleic soybean oil), or fully hydrogenated oils, because these conventional low-oleic oils generate trans fats in processed foods. This regulatory-induced demand increase is modeled as a positive shift in the demand for GE high-oleic soybean oil. The model captures how shocks at one stage of the value chain propagate through the system.
Building on the factors discussed, this study examines different scenarios for demand and supply shocks driven by the adoption of GE high-oleic soybean technology and policy-driven demand for high-oleic oils. The initial equilibrium conditions are based on industry production processes and competitive equilibrium conditions for soybean farmers, processors, and edible oils markets. Each set of agents is represented by a specific set of demand and supply functions for its own inputs and outputs. The initial equilibrium is then shocked by the introduction of the GE variety alone or by the introduction of the GE variety in conjunction with a trans-fat ban. By solving for changes in prices, quantities, and welfare across multiple market agents, the model estimates both direct impacts (e.g., cost shocks at farm level) and indirect effects (e.g., changes in conventional oil demand and meal by-product prices). Using a standard numeric comparative statics approach, we solve for the effects of these shocks on various prices, quantities and agents’ welfare.
2.1 The equilibrium displacement model
The production process for industry I (farming, soybean processing) is represented with a cost function as

Citation: International Food and Agribusiness Management Review 28, 5 (2025) ; 10.22434/ifamr.1098
where wi is a vector of prices for the vector of input quantities xi, Yi, is a vector of outputs that are sold at the vector of prices Pi, t represents exogenous technological change and
In our model, soybean processors produce three outputs: GE high-oleic soybean oil (subscript ho), GM low-oleic soybean oil (lo), and soy meal (m), by using three inputs, GE high- and GM low-oleic soybeans (h and l) and other inputs (op). Farmers produce two types of soybeans (h,l) and corn (c), using as inputs the two kinds of seeds (hs and ls), land (L), and other inputs (of) to produce.
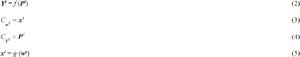
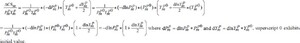
Competitive market equilibrium conditions for industry I (soybean processors or farmers) are expressed as: product demand equations (equation (2)), input demand equations determined by Shephard’s lemma (equation (3)), marginal costs set equal to the output price (equation (4)), and input supply equations (equation (5)).2
Citation: International Food and Agribusiness Management Review 28, 5 (2025) ; 10.22434/ifamr.1098
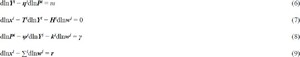
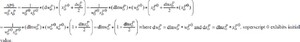
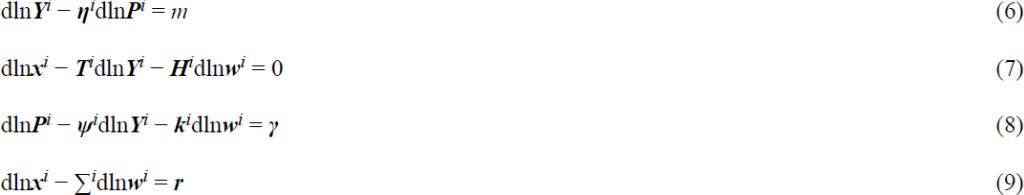
Cost functions must be homogeneous of degree one in input prices and in the case of constant returns to scale are also homogeneous of degree one in outputs Yi. The input demand and output supply equations (3 and 4) follow from Shephard’s lemma, and because the partial derivative of a function homogeneous of degree k is homogeneous of degree k–1, Cwi is homogeneous of degree zero in wi, and Cyi is homogeneous of degree zero in Yi. Following the standard comparative statics approach as applied by Perrin (1997), we totally differentiate these equations, then express them in logarithms. The logarithmic differential equations corresponding to (2)–(5) are organized with exogenous shocks on the right and endogenous variables on the left side of the equations:
Citation: International Food and Agribusiness Management Review 28, 5 (2025) ; 10.22434/ifamr.1098
where
When (6)–(9) represent the processing sector, the vector of horizontal demand shocks in the final oil market is expressed as m ∈ [mh, ml, 0] where mh represents the increased demand for GE high-oleic soybean oils, and ml represents the decreased demand for GM low-oleic soybean oil. When (6)–(9) represent the farmers’ sector, (8) is the vector of dual rates of technical change determined as  where
where
2.2 Modeling linkages across the supply chain
Markets are connected from upstream to downstream by using equations (9) for one sector and (6) for the other. For the processing sector, for example, xi may represent the processors’ demand for GE high-oleic soybeans at price wi, while for the farm sector, (6), Yi may represent the quantity of GE high-oleic soybeans that farmers produce at price Pi. To connect the two sectors, the demanders’ xi are set equal to the suppliers’ Yi and the corresponding wi equal to the Pi.
Citation: International Food and Agribusiness Management Review 28, 5 (2025) ; 10.22434/ifamr.1098
The market clearing condition for GM low-oleic soybeans is similar to equations (10)–(11), but includes two sources of demand, domestic and export, for which the total log change in demand is the share-weighted change in the two quantities demanded. The equilibrium changes in the GM low-oleic soybean market are thus:
Citation: International Food and Agribusiness Management Review 28, 5 (2025) ; 10.22434/ifamr.1098
where  represents the share of the GM low-oleic soybeans that is consumed domestically and
  represents the share of the GM low-oleic soybean exported from the U.S.
Similarly, the market clearing conditions for soybean processors’ “other” inputs are determined by the derived demand and the supply of processors “other” inputs,  . We thus set changes in prices and quantities equal to one another, as
Citation: International Food and Agribusiness Management Review 28, 5 (2025) ; 10.22434/ifamr.1098
The above equilibrium equations described in equations (6)–(13) include 28 variables. At the farm level, 8 for the prices and quantities of the four farm inputs (h seed, l seed, land and “other” farm inputs), 6 for the prices and quantities of three farm outputs (h, l and c). At the processing level, 6 for the prices and quantities of the three processing inputs (h, l, and “other” processing input), and 6 for the prices and quantities of the three processing outputs (ho, lo and m). The quantity of GM low-oleic soybeans exported and the total quantity of soybean oil. The equilibrium equations also total 28. We solve this system of linear equations with right-hand-side shocks as described earlier in this section: the supply of GE high-oleic soybean seeds, the cost of production of GE high-oleic soybeans and the demands for GM low and GE high-oleic soybean oils.
2.3 Welfare changes
This study measures welfare changes as changes in traditionally-measured consumer and producer surpluses. These changes are expressed both in dollars and as a fraction of the initial value of the product (price times quantity) to provide different perspectives on the size of change. We note that this measure of consumer welfare, based on estimates of the derived demand for oils by the food manufacturing sector, may not include the value of health benefits to the ultimate consumer of their products. Thus, our welfare measure may not include health benefits that are intended by a trans-fat ban.
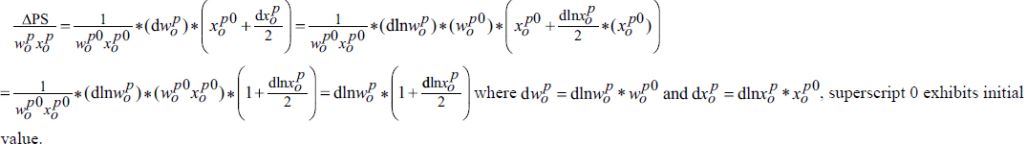
There are four stakeholders whose welfare concern us: consumers of oil products; consumers of soybean meal; owners of processing plants, and owners of farmland. In our analysis of GE high-oleic and GM low-oleic soybean oil consumer surplus, the surplus is calculated using changes along their original demand curves. We represent the change in consumer surplus triangles as a fraction of initial value as in equation (14) where subscript m in this case represents soybean meal, but the equation with subscript c also represents corn consumers. Our model specifies zero profits, so earnings to owners of processing plants and farms are reflected in producers’ surplus for an inelastically-supplied owner input. Change in producers’ surplus triangles are calculated using equation (15) (owners of processing plants in this case, but comparable for owners of farmland).
Citation: International Food and Agribusiness Management Review 28, 5 (2025) ; 10.22434/ifamr.1098
Citation: International Food and Agribusiness Management Review 28, 5 (2025) ; 10.22434/ifamr.1098
Because the initial welfare of high-oleic oil consumers is close to zero, their welfare change cannot be computed as a fraction of the initial welfare. We represent it only as the area of the final consumer surplus triangle.
3. Parameter estimates
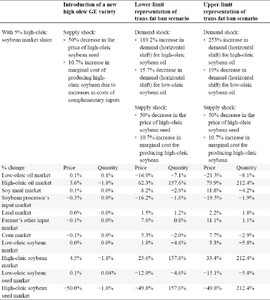
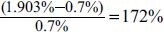
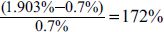
To implement this analysis, it is important to identify plausible ranges for the shocks in exogenous demand (m) and in supply (γ and r), in addition to estimates of parameters and initial shares. Therefore, a lower- and upper-limit scenario are established for an exogenous GE high-oleic oil demand shock mh from 189.2% to 253% based on the contracted future acreages of GE high-oleic soybean in 2023–2024 and a potential price premium of high-oleic soybean oils. The lower-limit scenario for the demand curve shift is calculated in the following steps. First, using a 77% increase in high-oleic soybean planted acreages within 2–3 years (John Jensen, Vice president of oil strategy, U.S. Soybean Board, private communication, 3 February 2021), the expected market share of GE high-oleic soybean is calculated as 1.9%. Then, the growth rate of GE high-oleic soybean production (172%)6 is calculated based on the current market share and the expected market share in three years (0.7% and 1.9%, respectively). To capture the total horizontal demand shock, the change in quantity demanded is estimated as the product of the price premium of GE high-oleic soybean oils (97%) and the demand elasticity, which results in a 189.2%7 increase in high-oleic soybean demand.
With a similar logic for the upper-limit scenario, we assume an increase in GE high-oleic soybean planted acreages of 231%, which represents a 2.3% market share for GE high-oleic soybean within 2–3 years (John Jensen, Vice president of oil strategy, U.S. Soybean Board, private communication, 3 February 2021). This implies a growth of 230% in GE high-oleic soybean based on the current market share and a potential price premium of high-oleic soybean oils (127%), which results in a 253%8 horizontal demand shock. We acknowledge that the data for contracted GE high-oleic soybean acreages are from the supply side. However, it indicates potential market equilibrium quantities because they reflect what seed companies expect and guarantee in the form of agreements with producers and processors. Therefore, lower- and upper-limit scenario demand shocks for GM low-oleic soybean (ml), are −15.7% and −19%.
Our model specifies that the initial market share of GE high-oleic soybean and their corresponding oil is 5%, while the remaining 95% consists of GM low-oleic soybean and oil. Considering that soybean oil accounts for 52% of the total edible oil market (USDA ERS, 2020b), the demand shock mh is estimated to drive an increase in the market share of high-oleic oils from 4.9% (lower-limit) to 6.6% (upper-limit)9 by 2024. Similarly, ml indicates a decrease in consumer demand for low-quality soybean oils10 from −7.8% (lower-limit) to −8.9% (upper-limit).11
The adoption of GE high-oleic soybean production under identity-preserved system is introduced in the model as a shift,
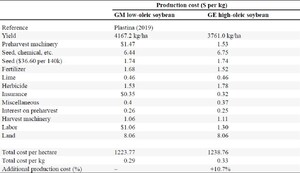
Estimated production costs for low-oleic and high-oleic soybeans
Citation: International Food and Agribusiness Management Review 28, 5 (2025) ; 10.22434/ifamr.1098
This extra cost arises from the yield drag, additional herbicide expenses, and the costs associated with segregating high-oleic soybeans to prevent their mixing with conventional (low-oleic) soybeans, thereby preserving the higher value of the new varieties. These segregation efforts we estimate would result in 4–5% of additional costs, which we have added to machinery and labor fees.
Finally, the exogenous seed supply shock (rh) represents the introduction of the new seed. An equilibrium displacement model such as this requires an initial equilibrium to be displaced. The high-oleic soybean market does not yet exist, so we represent the initial equilibrium as a very high price that results in a negligible quantity sold. We represent the introduction of these seeds (the “shock”) as a downward shift in the high-oleic seed supply of −50% (which is expressed in the model as a horizontal shock of a very flat supply curve).
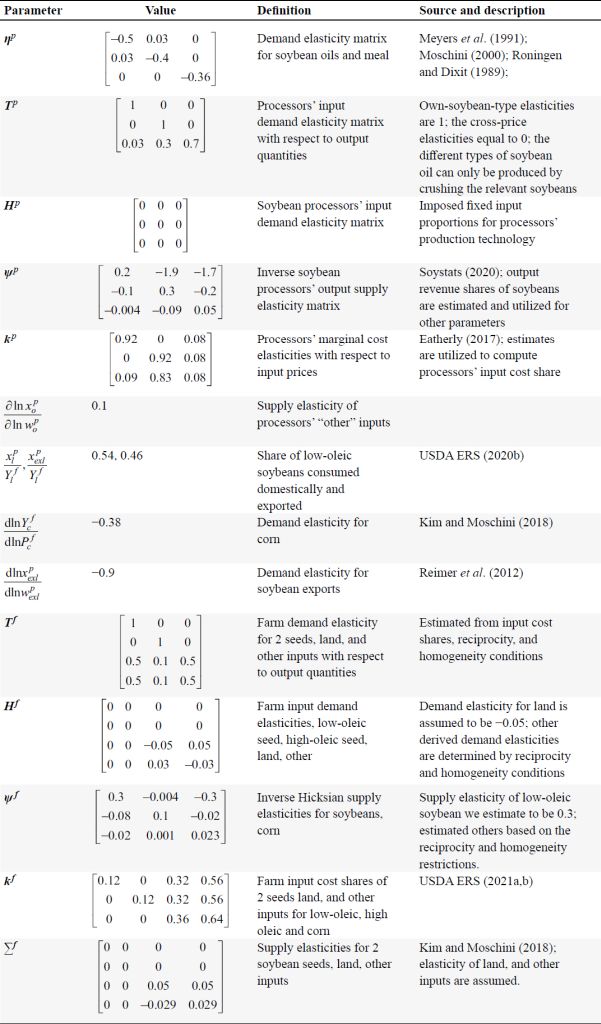
Initial equilibrium prices and quantities of inputs and outputs are calibrated to those observed in the markets in 2020–2021, as shown in Table 2. Some values such as elasticities of demand and supply for various outputs and inputs, and other parameters are assumed that are displayed in Table 3. The model is calibrated using national-level U.S. data drawn from USDA and industry sources. This includes average prices, quantities, acreage, and input costs for soybeans, corn, soybean oil, and meal. A national-level calibration is appropriate given the aggregate nature of the regulatory shock being modeled (i.e., the FDA’s trans-fat ban). While a large share of U.S. soybeans is exported, these exports are predominantly in the form of whole beans, which are then processed abroad—particularly in Asian markets—into meal and oil for animal feed and industrial use. In contrast, soybean oil is primarily consumed domestically, and GE high-oleic soybean oil currently has no significant export market. Accordingly, the model treats high-oleic oil demand as a domestic phenomenon. Conventional soybean export demand, however, is incorporated into the model through calibrated market shares and demand elasticities.
Initial equilibrium prices and quantities of inputs and outputs
Citation: International Food and Agribusiness Management Review 28, 5 (2025) ; 10.22434/ifamr.1098
Simulation parameters and values
Citation: International Food and Agribusiness Management Review 28, 5 (2025) ; 10.22434/ifamr.1098
4. Results
Our numerical analyses show that the adoption of gene-edited high-oleic soybeans has a measurable but relatively limited impact on the value chain in the absence of a transfat ban. The largest market welfare costs are imposed on the owners of soybean processing plants for whom prices fall and on corn purchasers for whom prices rise.
4.1 Market effects of GE high-oleic soybean introduction alone
The cost of producing GE high-oleic soybeans is estimated to go up because of a slight yield drag and some other cost increases (pesticides and identity-preservation costs). We estimate that GE high-oleic soybean would result in an increase of 10.7% in production cost compared to GM low-oleic soybean. Our results (Table 4) thus show that the price of high-oleic oil would rise, while the quantity of both high-oleic oil and soybeans would fall. Soybean processors will reduce output by the same amount, but oil prices rise by only 3.6%.
The percentage changes in market equilibrium with different shocks and scenarios
Citation: International Food and Agribusiness Management Review 28, 5 (2025) ; 10.22434/ifamr.1098
However, even if the current yield of GE high-oleic soybeans could be increased to the same level as the current GM low-oleic soybeans, the estimated production cost would still be 1% higher than conventional soybeans due to additional identity preservation costs. Such a change we calculate would expand GE high-oleic soybean and oil market to 3.7% greater than the initial scenarios, with 9.2% and 7.4% lower price premiums for GE high-oleic soybeans and oils, respectively.
These findings suggest that in the absence of policy-driven demand increase, the adoption of GE high-oleic soybeans may not be economically attractive for farmers due to increased production costs and limited market response. Without a strong demand signal, processors and manufacturers have little incentive to switch, making supply-side innovation alone insufficient to shift the market.
4.2 Market effects of GE high-oleic soybean introduction and trans-fat ban policy
The FDA trans-fat ban, which aimed to eliminate artificial trans fats from the food supply, officially took effect on June 18, 2018. Although this marked the end of approval for partially hydrogenated oils (PHOs), the agency granted manufacturers an extended compliance window, allowing products made before this date to remain in distribution until January 1, 2021. In our model, this policy change is treated as a demand-side shock that reflects the cumulative market adjustments following full enforcement. While the simulation does not track year-by-year transitions, it captures the longer-term steady-state effects on the soybean oil market once manufacturers have shifted toward alternative oils such as GE high-oleic soybean oil. These changes are represented by exogenous shocks in demand of soybean oils and a price premium of GE high-oleic soybean oil.
In the case of the lower-limit representation of the policy shock, the quantity of GE high-oleic soybeans in the market would increase by 157.6% while the prices rise by 25.6%. GE High-oleic soybean oil quantity increases by the same amount, but prices increase by 62.3%.12 The quantity for low-oleic oil would fall by 7.1% and the price by 16.9%. These results reveal that the equilibrium adjustments due to demand shocks from trans-fat ban policies are likely to outweigh those due to the introduction of a new GE high-oleic seed. In this representation of the policy, the price of corn increases by 5.3% as farmers switch from producing corn to soybeans, while corn production decreases by 2%. The owners of soybean processing facilities would experience a substantial reduction in the value of their facilities (−16.2%), because the total quantity of soybeans being crushed decreases by 0.9%. Landowners realize increases in rents as soybeans increase in price and quantity.
In simulating an upper-limit representation of the policy shock, the results show in larger equilibrium disturbances. For example, GE high-oleic oil price increases by 79.9% rather than 62.3%, with quantity increasing by 212.4% rather than 157.6%. Similarly, the GE high-oleic soybean price increases by 33.4% compared to 25.6% with the smaller demand shift. Owners of soybean processing plants (the processing “other” input) experience a reduction in quantity processed, which reduces owners’ rents by 19.5%.
In both representations of the policy-induced demand shift, characterized by increased preference and a price premium for GE high-oleic soybean oil, the equilibrium results show that high-oleic soybean production becomes economically feasible. In contrast, conventional GM low-oleic seed suppliers face declining demand, with seed prices and quantities falling by 12% and 4.6% under the lower-limit scenario, and by 15.1% and 5.8% under the upper-limit scenario. While the total seed volume remains relatively stable, these results indicate a notable shift in market share toward GE high-oleic soybean varieties.
The differences between these scenarios indicate that the trans-fat ban shock is the primary shock to this supply chain, while the supply shocks related to the introduction of a GE variety are relatively small. These results are in line with the theoretical analysis by Giannakas and Yiannaka (2004). They found that consumers’ valuation of the high-oleic attribute and the relative price will determine the success of this new crop in the market. Because there appear to be no sufficient agronomic benefits or cost reduction for adopting GE high-oleic soybean seeds, farmers would not benefit from the new varieties without increased consumer demand.
These results highlight how trans-fat regulations can act as a catalyst for broader market realignments. The policy-induced demand shift increases incentives across the value chain—from processors sourcing more GE soybeans to farmers reallocating land from conventional crops to GE high-oleic soybean production. Importantly, the analysis suggests that technological adoption alone (i.e., the introduction of GE seeds) is insufficient to drive large-scale market changes unless accompanied by aligned demand-side signals. In this case, regulation not only creates market pull for healthier oils but also alters incentives throughout the supply chain. For stakeholders, from seed companies to food manufacturers, this underscores the strategic importance of monitoring and anticipating food policy changes when planning for technology development and commercialization.
4.3 Welfare changes
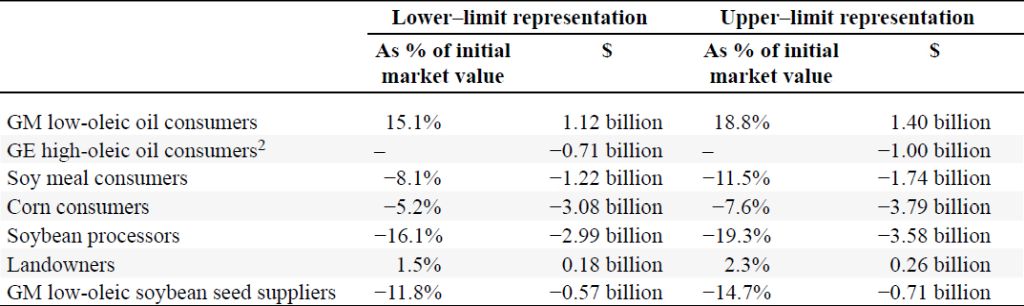
Table 5 reports the predicted welfare changes for buyers and owners for the two alternative representations of the policy change with introduction of the new variety. The result shows that low-oleic soybean oil buyers gain welfare valued between $1.12 billion and $1.40 billion because the price falls while substantial (though reduced) quantities continue to be purchased. On the other hand, buyers of GE high-oleic soybean oil lose market surplus of $0.71 billion to $1 billion because the price rises and at the same time, they are forced by the policy change to consume more. In this study, traditional consumer surplus (recall that these consumers are food manufacturers) is measured using demand curves consistent with the pre-shock equilibrium. The ban on trans-fat in food manufacturing forces these buyers off their demand curves, which should lead us to expect a reduction in welfare. However, the shocks result in a substantial price reduction in low-oleic oils which results in a welfare gain that more than offsets the welfare lost by forcing buyers off their demand curves. These impacts on buyers of edible oils of course do not include health benefits of the consumers who ultimately consume the food products produced by the food manufacturers who are affected by the trans-fat ban.
Welfare changes in relevant stakeholders with the introduction of the GE variety under the two representations of the trans-fat ban policy1
Citation: International Food and Agribusiness Management Review 28, 5 (2025) ; 10.22434/ifamr.1098
Because of reduced quantities and higher prices, soybean meal consumers suffer welfare losses of about 8.1% up to about 11.5% and corn consumers lose from about 5.2% up to about 7.6%. As fractions of market value, these may seem small, but the markets are large. Soy meal demanders losses are from $1.22 billion to $1.74 billion and corn consumers losses from $3.08 billion to $3.79 billion. Landowners would realize significant welfare benefits due to the increased rental rate, from 1.5% to 2.3% of land value, or $0.18 to $0.26 billion in total welfare value. The welfare effects for the seed innovator are not properly represented in our model because our specification of variety introduction as a reduction in price is just an artifice to represent the new seed introduction. However, this study captures that conventional bio-seed companies would experience a welfare loss in the range of −11.8% to −14.7% because of reduced demand.
The results indicate that short-term welfare gains accrue mostly to low-oleic oil purchasers and farmland owners, while processors and corn purchasers may lose welfare. These findings provide useful insights for farmers who have an opportunity to increase GE high-oleic soybean production at a time when demand increases due to the trans-fat ban, despite an increase in the production cost relative to current varieties.13 Food manufacturers and other consumers can also expect benefits from using GE high-oleic soybean oil because it can be relatively cheaper than other high-oleic substitutes and has better quality compared to low-oleic oils. Therefore, although low-oleic bio-seed production companies experience short-term welfare loss due to the reduced demand for conventional soybean seed, the important step for them is to successfully commercialize GE high-oleic soybean varieties.
While the results highlight opportunities for certain stakeholders, they also point to transitional challenges for others. In particular, processors and corn purchasers may experience relative welfare declines due to changing input demands and price adjustments along the supply chain. These outcomes reflect the complex redistribution of value in response to policy-driven demand shifts. Furthermore, the welfare estimates presented here do not account for broader societal benefits such as improvements in public health, suggesting that the overall gains from trans-fat regulation may be underestimated. Given these considerations, complementary policies that support adaptation and encourage consumer awareness may help balance these effects and maximize net social benefits.
5. Conclusions, implications and limitations
A high-oleic acid soybean variety became the first GE crop commercialized in the U.S., with an expectation of substantial demand due to its nutritional benefits and given the impending trans-fat ban in food manufacturing. This study develops an extensive multi-market analysis of the economic impacts and welfare implications of those changes along the supply chain: farm production, the soybean crushing industry and food manufacturing. An equilibrium displacement model is used to estimate the effects of the introduction of a GE high-oleic soybean variety into a market traditionally dominated by GM low-oleic soybeans, both with and without the imposition of a ban on trans-fat in food manufacturing.
The introduction of the new variety alone was found to have little impact on markets. The bulk of the market impacts would only occur only with a simultaneous ban on trans-fat in food manufacturing that increases demand for GE high-oleic soybeans. An estimated yield drag that increases the farm cost of production relative to standard soybeans limits the impact of the variety alone. However, our findings also indicate that even if bio-seed companies could increase the yield of GE high-oleic soybean to the level of GM low-oleic soybeans, the impact would still be relatively minor.
The primary economic winners from GE high-oleic soybean adoption given the trans-fat ban are consumers of GM low-oleic soybean oil and farmland owners, while corn consumers and soybean processors experience the largest losses. GM low-oleic oil consumers would gain $1.12–1.40 billion in consumer surplus annually (15–19% of market value), due to the 17–21% fall in price. Farm landowners would also gain, about $0.18–0.26 billion annually (1.5–2.3% of total land rent) due to a 1.5–1.8% increase in land rental rates. Corn consumers would lose the most, $3.08–3.79 billion annually (5.2–7.6% of the value of the corn crop), followed by soybean processors at $2.99–3.58 billion (16.1–19.3% of processing costs). GE high oleic soybean oil consumers would lose because the price is expected to rise by 4.5%, but this loss is small ($0.71–1.00 billion annually) because of the limited quantity traded. Our approach does not allow for identifying welfare effects on GE high-oleic soybean seed innovators, as it relies on a hypothetical reduction in the seed price as the method for introducing the variety.
The success of the GE high-oleic soybean variety will primarily depend on policy-driven and consumer-driven demand. This demand will be increased by trans-fat ban regulations in the U.S. and globally, and could be further influenced by marketing strategies that highlight the benefits of high-oleic soybean oil over other vegetable oils. To enhance adoption and demand, food and agribusiness companies should consider investing in marketing campaigns to educate consumers about the nutritional benefits, functional stability, and regulatory advantages of high-oleic soybean oil. Such efforts could help drive higher demand, making the GE high-oleic soybean variety more commercially viable.
5.1 Limitations and future research
This study could be extended in numerous ways. First, the analysis could be expanded to include the world edible oil market to explore how different agents in different countries interact under the trans-fat ban movements that are spreading to the developed and developing countries. Second, it would be also useful to evaluate substitution relationships among various types of oils, such as palm oils and canola oils that are substitutes for low-oleic soybean oil. Finally, given that the trans-fat regulation decreases the risk of diseases and mortality (Downs et al., 2017; Restrepo and Rieger, 2016), one could take into account the welfare benefits from healthcare cost savings from consuming higher quality edible oils. These extensions could provide more information about how the edible oil markets change under this kind of new food innovation and provide alternative strategies to U.S. soybean producers and relevant stakeholders.
References
American Soybean Association. 2020. 2020 Soy Stats. Available online at http://soystats.com/2020-soystats (accessed 17 October 2020).
American Soybean Association. 2023. 2023 Iowa soybean review. Available online at https://www.iasoybeans.com/newsroom/article/isr-january-2023-soybean-processing-growth-is-crushing-it.
Barrows, G., S. Sexton and D. Zilberman. 2014. Agricultural biotechnology: the promise and prospects of genetically modified crops. Journal of Economic Perspectives 28: 99–120.
Biswas, S., J. Tian, R. Li, X. Chen, Z. Luo, M. Chen, X. Zhao, D. Zhang, S. Persson and J. Shi. 2020. Investigation of CRISPR/Cas9-induced SD1 rice mutants highlights the importance of molecular characterization in plant molecular breeding. Journal of Genetics and Genomics 47(5): 273–280.
Brester, G.W., J.A. Atwood and M.A Boland. 2023. Equilibrium displacement models: theory, applications and policy analysis. University of Minnesota Libraries Publishing, Minneapolis, MN.
Chilcoat, D., Z.B. Liu and J. Sander. 2017. Use of CRISPR/Cas9 for crop improvement in maize and soybean. Progress in Molecular Biology and Translational Science 149: 27–46.
Ciliberto, F., G. Moschini and E.D. Perry. 2019. Valuing product innovation: genetically engineered varieties in US corn and soybeans. The RAND Journal of Economics 50(3): 615–644.
Darroch, J. and A. Jardine. 2002. Combining firm-based and consumer-based perspectives to develop a new measure for innovation. In: 3rd International Conference on Management of Innovation and Technology, Hangzhou City, China, 25–27 October 2002.
Ding, Y., H. Li, L.L. Chen and K. Xie. 2016. Recent advances in genome editing using CRISPR/Cas9. Frontiers in Plant Science 7: 703.
Downs, S.M., M.Z. Bloem, M. Zheng, E. Catterall, B. Thomas, L. Veerman and J.H. Wu. 2017. The impact of policies to reduce trans fat consumption: a systematic review of the evidence. Current Developments in Nutrition 1(12): 117.
Eatherly, R.L. 2017. A cost-differential analysis of local soybean processing in east Tennessee: roast or crush? Master’s thesis, University of Tennessee, Knoxville, TN.
Finger, R., N.E. Benni, T. Kaphengst, C. Evans, S. Herbert, B. Lehmann, S. Morse and N. Stupak. 2011. A meta analysis on farm-level costs and benefits of GM crops. Sustainability 3(5): 743–762.
Fulginiti, L.E. 2010. Estimating Griliches’ k‐Shifts. American Journal of Agricultural Economics 92(1): 86–101.
Giannakas, K. and A. Yiannaka. 2004. The market potential of a new high-oleic soybean: an ex ante analysis. Agribio Forum 7(3): 101–112.
Gschwandtner, A. and S. Hirsch. 2018. What drives firm profitability? A comparison of the US and EU food processing industry. The Manchester School 86(3): 390–416.
Huffman, W.E., Y. Jin and Z. Xu. 2018. The economic impacts of technology and climate change: new evidence from US corn yields. Agricultural Economics 49: 463–479.
Kim, D.H., H.J. Lee, S.M. Amanullah, A.T. Adesogan and S.C. Kim. 2016. Effects of dietary n-6/n-3 fatty acid ratio on nutrient digestibility and blood metabolites of hanwoo heifers. Animal Science Journal 87: 46–53.
Kim, H. and G. Moschini. 2018. The dynamics of supply: us corn and soybeans in the biofuel era. Land Economics 94(4): 593–613.
Klotz-Ingram, C., S. Jans, J. Fernandez-Cornejo and W. McBride. 1999. Farm-level production effects related to the adoption of genetically modified cotton for pest management. AgBioForum 2: 73–84.
Li, M., X. Li, Z. Zhou, P. Wu, M. Fang, X. Pan, Q. Lin, W. Luo, G. Wu and H. Li. 2016. Reassessment of the four yield-related genes Gn1a, DEP1, GS3, and IPA1 in rice using a CRISPR/Cas9 system. Frontiers in Plant Science 7: 377.
Maximiano, M.R., F.T. Tavora, G.S. Prado, S.C. Dias, A. Mehta and O.L. Franco. 2021. CRISPR genome editing technology: a powerful tool applied to developing agribusiness. Journal of Agricultural and Food Chemistry 69(23): 637–-6395.
Meyers, W.H., S. Devadoss and M. Helmar. 1991. The world soybean trade model: specification, estimation, and validation. Technical Report (91-TR 23). CARD, Ames, IA.
Moschini, G., H. Lapan and A. Sobolevsky. 2000. Roundup Ready® soybeans and welfare effects in the soybean complex. Agribusiness: An International Journal 16(1): 33–55.
Muth, R.F. 1964. The derived demand curve for a productive factor and the industry supply curve. Oxford Economic Papers 16(2): 221–234.
Nicholson, C.F., McRoberts, K.C., Öz, B.S., and B. Kopainsky. 2023. A dynamic systems analysis of factors affecting success of identity-preserved products: the case of high-oleic soybeans. International Food and Agribusiness Management Review 26(1): 159–174.
Perrin, R.K. 1997. The impact of technological change on a competitive industry. Journal of Agricultural and Resource Economics 22(2): 345–355.
Phillips, P.W. 2016. Genetically modified organisms and the future global nutrient supply: part of the solution or a new problem? Hidden Hunger 115: 153–163.
Plastina, A. 2019. Estimated costs of crop production in Iowa-2019. Iowa State University Extension and Outreach, Ames, IA.
Qaim, M. and D. Zilberman. 2003. Yield effects of genetically modified crops in developing countries. Science 299(5608): 900–902.
Reimer, J.J., X. Zheng and M.J. Gehlhar. 2012. Export demand elasticity estimation for major US crops. Journal of Agricultural and Applied Economics 44(4): 501–515.
Restrepo, B.J. and M. Rieger. 2016. Trans fat and cardiovascular disease mortality: evidence from bans in restaurants in New York. Journal of Health Economics 45: 176–196.
Roningen, V.O. and P.M. Dixit. 1989. Economic implications of agricultural policy reforms in industrial market economies. US Department of Agriculture, Economic Research Service, Agriculture and Trade Analysis Division, Washington, DC.
Ruttan, V.W. 1999. Biotechnology and agriculture: a skeptical perspective. The Journal of Agrobiotechnology Management and Economics 2(1): 54–60.
Saitone, T.L. and R.J. Sexton. 2017. Concentration and consolidation in the US food supply chain: The latest evidence and implications for consumers, farmers, and policymakers. Economic Review 102: 25–59.
Sánchez-León, S., J. Gil-Humanes, C.V. Ozuna, M.J. Giménez, C. Sousa, D.F. Voytas and F. Barro. 2018. Low-gluten, nontransgenic wheat engineered with CRISPR/Cas9. Plant Biotechnology Journal 16: 902–910.
Smyth, S. and P.W.B. Phillips. 2001. Competitors co-operating: establishing a supply chain to manage genetically modified canola. International Food and Agribusiness Management Review 4: 51–66. https://doi.org/10.1016/S1096-7508(01)00070-2.
Silva, D.F., D. Zilberman, S. Kaplan and M. Potts. 2019. The impact of high-yield technologies on the cocoa market in West Africa. In: 2019 Annual Meeting of the Agricultural and Applied Economics Association. 21–23 July 2019. Atlanta, GA, USA.
Thomson, J.A. 2018. The pros and cons of GM crops. Functional Plant Biology 45(3): 297–304.
Tillie, P. and E.R. Cerezo. 2015. Markets for non-genetically modified identity preserved soybean in the EU. EUR 27203. Publications Office of the European Union, Luxembourg.
USDA National Agricultural Statistics Service Information (NASS). 2020. 2020 Agricultural land, land values and cash rents. Available online at https://www.nass.usda.gov/Publications/Highlights/2020/land-values-cash-rents.pdf.
USDA National Agricultural Statistics Service Information (NASS). 2021. Acreage. Available online at https://quickstats.nass.usda.gov.
USDA Economic Research Service (ERS). 2017. Major land usage. Available online at https://www.ers.usda.gov/data-products/major-land-uses.
USDA Economic Research Service (ERS). 2020a. Feed grains database. Available online at https://www.ers.usda.gov/data-products/feed-grains-database.
USDA Economic Research Service (ERS). 2020b. Oil crops yearbook data. Available online at https://www.ers.usda.gov/data-products/oil-crops-yearbook.
USDA Economic Research Service (ERS). 2021a. Soybeans cost and return data. Available online at https://www.ers.usda.gov/data-products/commodity-costs-and-returns.
USDA Economic Research Service (ERS), 2021b. Corn cost and return data. Available online at https://www.ers.usda.gov/data-products/commodity-costs-and-returns.
Wang, Y., X. Cheng, Q. Shan, Y. Zhang, J. Liu, C. Gao and J.L. Qiu. 2014. Simultaneous editing of three homoeoalleles in hexaploid bread wheat confers heritable resistance to powdery mildew. National Biotechnology 32: 947.
Wang, J., H. Kuang, Z. Zhang, Y. Yang, L. Yan, M. Zhang, S. Song and Y. Guan. 2020. Generation of seed lipoxygenase-free soybean using CRISPR−Cas9. Crop Journal 8: 432–439.
Wilson, A.K. 2021. Will gene-edited and other GM Crops fail sustainable food systems? Rethinking food and agriculture. Woodhead Publishing, Sawston.
Corresponding author
Monsanto has temporarily stopped supplying high-oleic varieties in the domestic market.
In the context of a comparative statics model as ours, inclusion of non-competitive mark-downs or mark-ups would not change the equilibrium displacement estimates. For a monopsonistic processor, for example, profit-maximizing input choice would be represented as Cw[w * (1 −
Important technical notes for representing a technology in this way are that Ti and
Citation: International Food and Agribusiness Management Review 28, 5 (2025) ; 10.22434/ifamr.1098
Citation: International Food and Agribusiness Management Review 28, 5 (2025) ; 10.22434/ifamr.1098
Citation: International Food and Agribusiness Management Review 28, 5 (2025) ; 10.22434/ifamr.1098
172%*0.2*0.5 + 172%=189.2%, where 0.2 is an inverse supply elasticity and 0.5 is a demand elasticity for high-oleic soybean oil.
230%*0.2*0.5 + 230%=253%
0.52*0.05*2.53=0.066 and 0.52*0.05 *1.892=0.049
Consumers have other high-oleic oil options using different crops (e.g., canola or sunflower). Also, palm oil, lard, and tallow do not necessarily require partial hydrogenation. But at this point, this study only considers soybean markets.
0.52*0.95*(−0.157) = −0.078 and 0.52*0.95*(−0.18) = −0.089
This is not a surprising result because the recent U.S. wholesale price of low-oleic soybean oil is 28.9 cents/pound, which is 62% lower than the price of high-oleic sunflower oil (76 cents/pound) according to the USDA ERS (2020b).
To explore how the assumption about the level of initial market share affects impacts on the equilibrium markets, sensitivity analysis was conducted by varying the initial market share as 5, 10, 15 and 20%. The magnitude of changes in equilibrium prices and quantities increases were within a range of 9–25% as initial market share rises over that range. The changes in equilibrium adjustments are largest in prices for soybean and oil markets, but quite low in quantities of other relevant markets such as soy meal. These variations in the market share led to increasing welfare losses for corn and soy meal consumers and soybean processors, while land and other input owners experience greater welfare gains.


