Abstract
Agricultural product suppliers play a crucial role in ensuring the stability of the food supply chain, meeting market demands, promoting agricultural economic development, and safeguarding consumer food safety. Therefore, when evaluating agricultural product suppliers, it is necessary to consider both their economic and sustainability aspects. This paper proposes a new performance assessment method that ensures distinguishable evaluation results even when the evaluation indicators for agricultural product suppliers include undesirable outputs and fuzzy numbers, and that the evaluation weights are reasonable. The assessment process takes into account the preferences and optimism levels of both decision-makers and the suppliers being evaluated, reducing decision-making risks and making the results more acceptable to participants. The introduction of prospect theory ensures more realistic evaluation outcomes. Through a case analysis of 11 corn suppliers, the superiority and effectiveness of this method are verified. The results show that the decision-makersâ reference point preferences, levels of optimism, and degrees of rationality significantly affect the performance evaluation results of agricultural product suppliers.
1. Introduction
With the advancement of technology, agricultural production has transitioned from traditional manual labor to mechanized and automated operations, leading to significant improvements in the yield and quality of agricultural products. Consequently, the concept of large-scale agricultural production has emerged, and agricultural product suppliers have been established and developed in response to this demand (Yu et al., 2010). In modern society, agricultural product suppliers play a crucial role in meeting market demands, enhancing agricultural production efficiency, ensuring food safety, and promoting sustainable agricultural development.
In recent years, the rational and effective evaluation and selection of agricultural product suppliers has become a prominent topic, attracting significant attention from scholars and corporate decision-makers (DMs) (Wu and Liao, 2023). On one hand, performance evaluation can help ensure that the agricultural products supplied meet quality and safety standards, thereby safeguarding consumer health (Wei et al. 2024). On the other hand, through continuous performance evaluation, companies can select and develop superior suppliers, enhancing the market competitiveness of the entire supply chain. This, in turn, promotes the rapid and stable development of local agriculture, helping agricultural producers and workers achieve poverty alleviation and prosperity (Luo et al., 2023).
DEA has been widely applied in the field of supplier evaluation (Kuo et al., 2010; Kuo and Lin, 2012). After a statistical analysis of various supplier evaluation methods, Karsak and Dursun (2014) pointed out that DEA is currently the most popular method for supplier evaluation. However, using DEA methods for evaluating the performance of agricultural product suppliers typically offers the following three advantages: (1) DEA is a non-parametric evaluation method, which eliminates the need to transform the indicators when assessing agricultural product suppliers; (2) It does not require the pre-setting of weights for the various input and output indicators of agricultural product suppliers before evaluation; (3) DEA can not only evaluate suppliers but also provide clear improvement targets for inefficient suppliers. Consequently, DEA has gained favor among researchers in the field of supplier evaluation. However, there are still several shortcomings when applying the traditional DEA model to the evaluation of agricultural product suppliers: (1), traditional DEA models cannot evaluate the performance of agricultural product suppliers when the raw input-output data contains fuzzy numbers; (2), traditional DEA models belong to the self-assessment mode, in which a series of problems caused by relatively flexible weight assignments cannot be ignored; (3), traditional DEA methods often yield identical results with multiple suppliers having an efficiency score of 1, leading to evaluation results that are often not clear and explicit enough to provide DMs with clear guidance.
Agricultural production is influenced by various factors such as human resources, soil conditions, and seed quality, which are difficult to control precisely. This makes it challenging to accurately quantify input-output data. Different statistical methods and calculation standards can lead to data discrepancies, especially in supply chains involving multiple stages and participants. Therefore, it is necessary to consider the fuzziness of data when evaluating the performance of agricultural product suppliers. Scholars in the DEA-related field have proposed their own solutions. Using membership functions to transform fuzzy data into precise data is a common approach. Eeckaut (2000) applied this method to convert fuzzy inputs and outputs into precise input and output data and provided corresponding mathematical programming methods. Guo (2009) proposed a fuzzy CCR model, which converts constraints including fuzzy equations and inequalities into deterministic constraints by implementing defined possibility levels and using comparison rules of fuzzy numbers. Saati et al. (2002), within the traditional DEA framework, defined interval variables using alpha-cuts and interval programming to restrict fuzzy numbers. Through linear transformation, they proposed a fuzzy DEA evaluation ranking method. Unfortunately, Saati et al. (2002) did not consider the undesirable output indicator, and the model still belongs to the self-evaluation mode, inevitably leading to some indicatorsâ weights being set to 0 during the evaluation process, and multiple suppliers being evaluated as DEA efficient.
In response to the issue of multiple evaluated decision-making units (DMUs) having the same efficiency of 1 in traditional models and the unreasonable evaluation weights, some scholars have proposed the idea of peer mutual evaluation. This idea has also been quickly introduced into the field of supplier evaluation. Interested readers can refer to related literature on the application of cross-efficiency in evaluating suppliers by Baker and Talluri (1997), Falagario et al. (2012), Talluri and Narasimhan (2004), Lingegård et al. (2021) and others. Although cross-efficiency has many advantages and wide applications, its optimal weights are not unique.
To address the issue of non-uniqueness in cross-efficiency weights, Sexton et al. (1986), Doyle and Green (1994) proposed the well-known aggressive and benevolent secondary objective models, aiming to select an appropriate set of weights among multiple optimal weights for mutual evaluation. However, the choice between the benevolent and aggressive secondary objective models has become a new decision dilemma for DMs. Based on Wang and Chinâs (2010) work, Wang et al. (2011) provided four neutral models for cross-efficiency evaluation from the perspective of multi-criteria decision analysis. Among them, they respectively set two objective functions: maximizing the distance between DMU and the negative ideal point and minimizing the distance between DMU and the positive ideal point. Through these two secondary objective models, all DMUs can obtain relatively âefficientâ weights. However, due to the different distances between the output and input data of each agricultural product supplier and the positive and negative ideal points, choosing different ideal points as references will result in different efficiency results and rankings. This contradiction is similar to the dilemma mentioned earlier regarding the choice between the aggressive and benevolent model.
Although Wang et al.âs (2011) method has its shortcomings, the approach of using reference points to assist DMs in evaluating suppliers has garnered considerable attention. On one hand, establishing reference points provides DMs with a clear benchmark, helping them assess whether the agricultural product suppliers under evaluation have met the expected targets. On the other hand, by setting reference points, DMs can more intuitively and conveniently compare the indicators of the agricultural product suppliers under evaluation, thereby simplifying the evaluation process. However, the aforementioned researchers assumed that DMs are entirely rational individuals driven by data when setting these reference points. Consequently, the evaluation results are based on the assumption of complete rationality, which deviates from real-world situations (Gong et al., 2021).
To illustrate the difference between complete and bounded rationality, consider a simple example involving $5. If an individual is completely rational, losing $5 and finding $5 would elicit the same feeling because the absolute values of â5 and 5 are equal. However, this is not the case in reality. Research by Kahneman and Tversky (1979) shows that individuals feel losses more intensely than gains. The pain people feel when they lose $5 is significantly greater than the pleasure they experience when they find $5. This discrepancy arises because human rationality is bounded, and perceptions are often relative to a reference point rather than changes in absolute values. Based on this difference in the perception of losses and gains and risk aversion, Kahneman and Tversky (1979) proposed the well-known prospect theory.
Prospect theory effectively predicts that in the evaluation of agricultural product suppliers, selecting positive and negative ideal points as different reference points will lead to different outcomes. Shao and Wang (2021) proposed three cross-efficiency models based on prospect theory â the benevolent model, the aggressive model, and the neutral model â for evaluating supplier efficiency. Unfortunately, Shao has not provided a detailed explanation of whether the aggressive model or the benevolent model is more suitable for evaluating suppliers.
Typically, the choice of reference points for agricultural product suppliers and the selection between aggressive and benevolent evaluation strategies depend solely on the DMâs personal preferences and subjective judgment. However, it is crucial to recognize that agricultural product suppliers differ from suppliers of other economic products. Agricultural products possess not only economic attributes but also social and safety attributes. overly autocratic decisions can lead to significant decision-making risks. When DMs use unreasonable evaluation results to select the wrong suppliers for establishing an agricultural supply chain, it can result in economic losses for the company and cause resource wastage and food shortages, leading to broader social issues.
As previously mentioned, when evaluating the performance of agricultural product suppliers, sustainability should be considered alongside economic factors. The sustainability of agricultural product suppliers includes the greenness of their production processes, the sustainability of maintaining reasonable production processes, and the sustainability of maintaining basic production capacities. The reference elements for this evaluation are shown in Figure 1.

The sustainability of agricultural product suppliers.
Citation: International Food and Agribusiness Management Review 28, 4 (2025) ; 10.22434/ifamr.1154
When the sustainability factors of agricultural product suppliers are included in the evaluation criteria, it becomes clear why the previously mentioned issue of unreasonable self-assigned weight distribution in traditional DEA models for evaluating agricultural product suppliers is unacceptable.
When using traditional DEA models to evaluate agricultural product suppliers, different weight combinations correspond to different production and operation modes of these suppliers. This variation underscores the necessity of establishing reasonable evaluation weights through the cross-efficiency method. The reason is that illogical weights, such as assigning zero to certain inputs or outputs, indicate that the agricultural product supplier is producing in an unrealistic and unsustainable manner. These unreasonable production and operation methods are often unstable, difficult to achieve, and even harder to maintain. Evaluation results obtained from such unreasonable production models not only lack reference value but also carry significant risks. A reasonable combination of evaluation weights is essential for ensuring the sustainability of the production processes of agricultural product suppliers.
Considering the sustainability of agricultural product suppliersâ basic production capacity underscores relying solely on DMsâ personal preferences and subjective consciousness for evaluation decisions is unreasonable. Agricultural production is highly dependent on natural conditions, often characterized by significant uncertainty. Therefore, the decision objective proposed by Wang et al. (2011), which aims to maximize the distance between the evaluated suppliers and the negative ideal point while minimizing the distance to the positive ideal point under the assumption of fully rational decision-making, is overly optimistic and idealistic. In real life, suboptimal conditions such as natural disasters and pest infestations are common. In the field of agricultural product supplier evaluation, DMs need to maintain an objective, comprehensive, and cautious attitude, promptly identifying issues and taking effective measures to reduce enterprise risk. In short, evaluation decisions from a pessimistic perspective reflect the efficiency of agricultural product suppliers in maintaining the most basic production capacity when unexpected events occur. However, in reality, DMsâ cognition is often limited, making it difficult for individuals to predict future production environments. Formulating evaluation strategies solely based on DMsâ preferences and disregarding the preferences and opinions of suppliers can lead to outcomes that are disconnected from reality. Preferences and feedback from multiple evaluated suppliers help to complement the DMsâ understanding, reduce potential risks in the assessment process, and thus assist DMs in taking appropriate decision-making measures. If DMs overlook the opinions and sentiments of suppliers during the evaluation process, it may result in the breakdown of collaborative relationships. In such circumstances, enterprises may struggle to obtain high-quality supply services, while suppliers may miss out on development opportunities.
In conclusion, addressing the shortcomings in the existing field of agricultural product supplier evaluation requires several improvements when applying DEA. This paper attempts to develop a fuzzy DEA cross- efficiency evaluation method that considers the preferences of DMs and suppliers, aiming to evaluate agricultural product suppliers with fuzzy data while ensuring comprehensive consideration of their sustainability. The main contributions of this study are as follows:
-
(1) The proposed evaluation model in this paper comprehensively considers the sustainability of agricultural product suppliers when assessing their performance. The model facilitates the evaluation of agricultural product suppliersâ performance in the presence of undesirable output indicators, thus considering the greenness of the supplierâs production activities. By introducing a cross-efficiency evaluation method, the model ensures more reasonable evaluation weights and examines the production sustainability of agricultural product suppliers. Both the calculation and aggregation stages of cross-efficiency consider the reference point preferences and optimism levels of both evaluated suppliers and DMs, effectively maintaining the sustainability of sustainability of agricultural product suppliersâ basic production capacity;
-
(2) The model proposed in this paper can evaluate the performance of agricultural product suppliers when there are fuzzy values in the input, expected output, and undesirable output data. The evaluation results are precise values rather than interval values, which ensuring that the evaluation results are easily comparable;
-
(3) The model proposed in this paper is built on the assumption that both evaluated suppliers and DMs are bounded rational individuals. By introducing prospect theory, the model effectively depicts the risk preferences and loss aversion of DMs and evaluated suppliers in the process of evaluation, resulting in evaluation results that are closer to real-world situations;
-
(4) Through a practical a case study of agricultural product supplier, this paper verifies the effectiveness and superiority of the model. Through sensitivity analysis, we validate the significant impact of DMsâ and evaluated suppliersâ reference point preferences, optimism biases, and risk preferences on supplier evaluation.
The remaining sections of this paper are arranged as follows: Section 2 provides relevant basic methods involved in the research. The evaluation method and model designed in this paper are presented in Section 3. In Section 4, we provide a case study to validate the proposed methods and sensitivity analysis and effectiveness of the proposed model. Finally, Section 5 provides the conclusion of this research.
2. Preliminaries
2.1 Fuzzy DEA
Assuming there are n DMUs, each using m inputs to generate s outputs. If the i-th input and r-th output of DMUk are represented by xik (i = 1, 2â¦, m) and yrk (r = 1, 2â¦, s) respectively, then the CCR efficiency of DMUk can be calculated by the following model:
Citation: International Food and Agribusiness Management Review 28, 4 (2025) ; 10.22434/ifamr.1154
Model 1 is the classic CCR model proposed by Charnes et al. (1978). Saati et al. (2002) improved the model based on Charnes et al. (1978) work. Assuming DMUâs input indicators  are triangular fuzzy numbers, and output indicators are also triangular fuzzy numbers
  , then the efficiency of DMUk can be calculated by the following model with
Citation: International Food and Agribusiness Management Review 28, 4 (2025) ; 10.22434/ifamr.1154
Where  and
and  .
.
Saati et al. (2002) proposed that Model 2 effectively addresses the performance evaluation problem when DMU inputâoutput indicators are fuzzy numbers.
2.2 Cross-efficiency
Cross-efficiency evaluation method is established based on a peer assessment concept. After obtaining their own CCR efficiency through Model 1, each DMU uses this set of weights to evaluate other DMUs, thus, each DMU will receive (nâ1) peer-evaluation efficiencies. The cross-efficiency of a DMU can be obtained by aggregating the peer assessment efficiencies with its own assessment efficiency, and the aggregation method is usually taking the arithmetic mean.
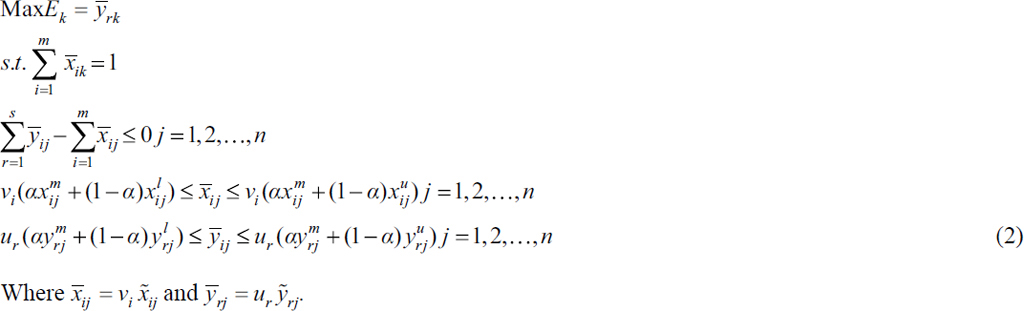
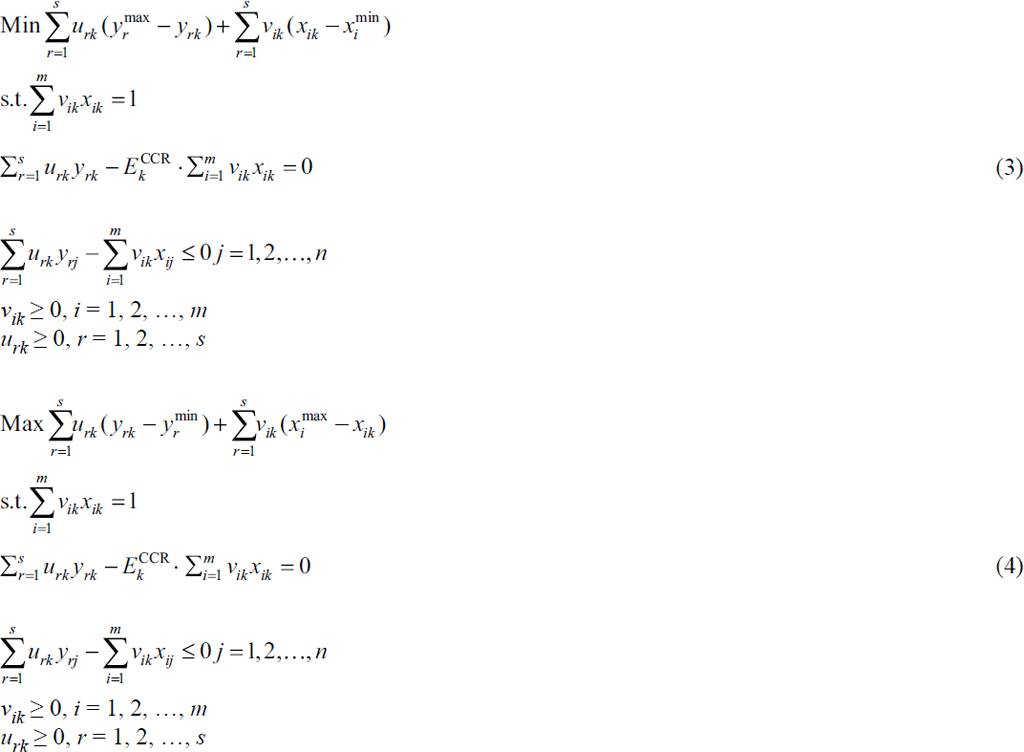
Due to the possibility of multiple sets of optimal weights when solving efficiency using Model 1, it is often difficult for a DMU to determine which set of weights to use when conducting peer-evaluation of other DMUs. Wang et al. (2011) proposed two cross-efficiency secondary goal programming models based on positive and negative ideal points, as shown below:
Citation: International Food and Agribusiness Management Review 28, 4 (2025) ; 10.22434/ifamr.1154
where  and
and  represent the maximum and minimum inputs of the i-th input for all DMU,
  and
and  represent the maximum and minimum expected outputs of the r-th expected output for all DMU, and
  represents the CCR efficiency of DMUk. The
  and
and  are the optimal weights obtained for DMUk in Model (3), then the evaluation of DMUk on DMUj is Ekj, and the average cross-efficiency of DMUj is E*jj, where
  . The self-evaluated efficiency of DMUs is the highest, and the n peer-evaluation efficiencies obtained by DMUs are always equal to or less than their self-evaluated efficiency. When calculating the arithmetic mean of the n evaluation results for DMUâs cross-efficiency, it is often impossible to obtain an efficiency rating of 1. It is precisely for this reason that the cross-efficiency method improves the identifiability of DMU efficiency.
2.3 Prospect theory
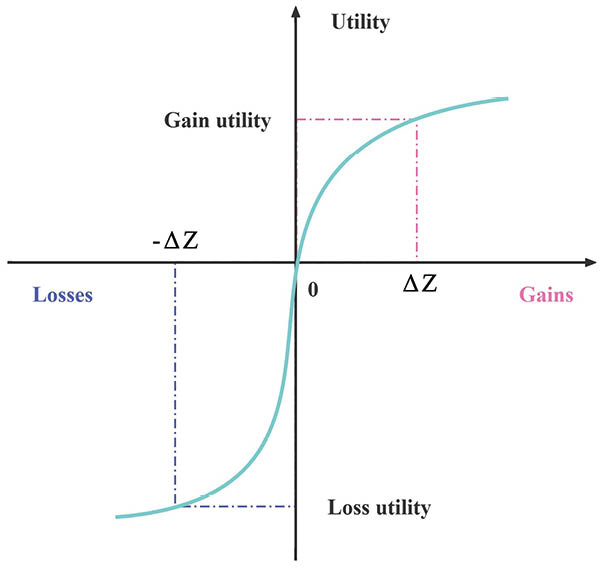
Prospect theory was proposed by Kahneman and Tversky (1979). This theory challenges the rationality assumption in traditional economics and presents a descriptive decision-making model to explain peopleâs behavior when facing risks. The core principles of prospect theory include:
-
(1) Reference dependence: People typically rely on a reference point to evaluate their gains and losses.
-
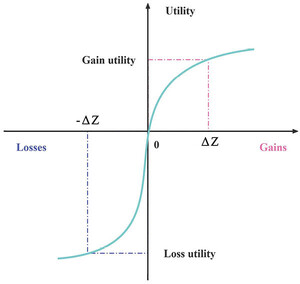
(2) Loss aversion: The pain caused by losses is greater than the pleasure from equivalent gains under the same conditions. As shown in Figure 2, comparing the utility values of âZ and ââZ with equal absolute values.
-
(3) Risk attitude: DMs exhibit risk aversion toward gains and risk seeking toward losses. Therefore, the value function of prospect theory is S-shaped, as illustrated by the prospect value function curve in Figure 2.
Prospect value function curve.
Citation: International Food and Agribusiness Management Review 28, 4 (2025) ; 10.22434/ifamr.1154
The prospect value can be calculated by the following formula:
Citation: International Food and Agribusiness Management Review 28, 4 (2025) ; 10.22434/ifamr.1154
3. Proposed models
3.1 The cross-efficiency calculation model proposed in this paper
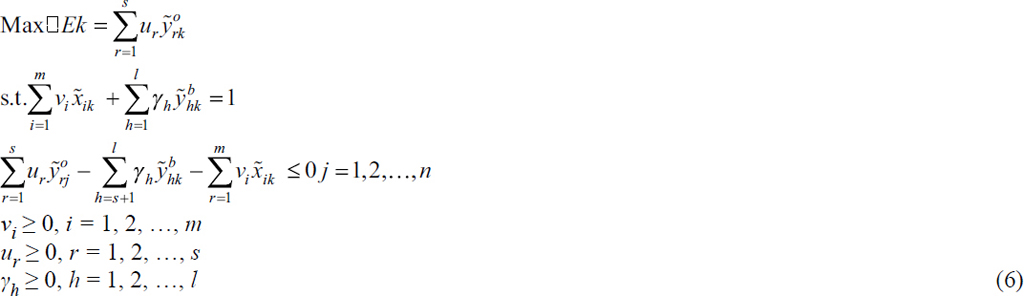
Assuming that the i-th input  of the agricultural product supplier DMUj is a triangular fuzzy number
  ,
,  , the r-th expected output
  is a triangular fuzzy number
  ,
,  , and the h-th undesirable output is a triangular fuzzy number
  ,
,  , the basic performance evaluation model proposed in this paper is as follows:
Citation: International Food and Agribusiness Management Review 28, 4 (2025) ; 10.22434/ifamr.1154
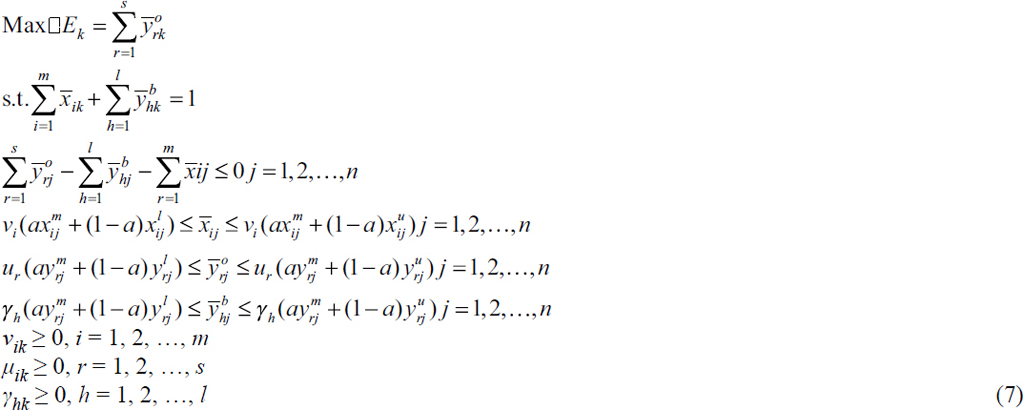
In the DEA models, various methods are typically employed to handle non-discretionary output indicators, including the curve measurement method, directional distance function method, linear transformation function method, and others. In this study, non-discretionary output indicators are treated as inputs, thereby avoiding the need for complex transformations or modifications to the model. Treating non-discretionary output indicators as inputs emphasizes the importance of reducing non-discretionary outputs (such as pollutants) and aligns their optimization direction with that of inputs. Based on Model 2, truncate the triangular fuzzy numbers by the
Citation: International Food and Agribusiness Management Review 28, 4 (2025) ; 10.22434/ifamr.1154
where  .
.
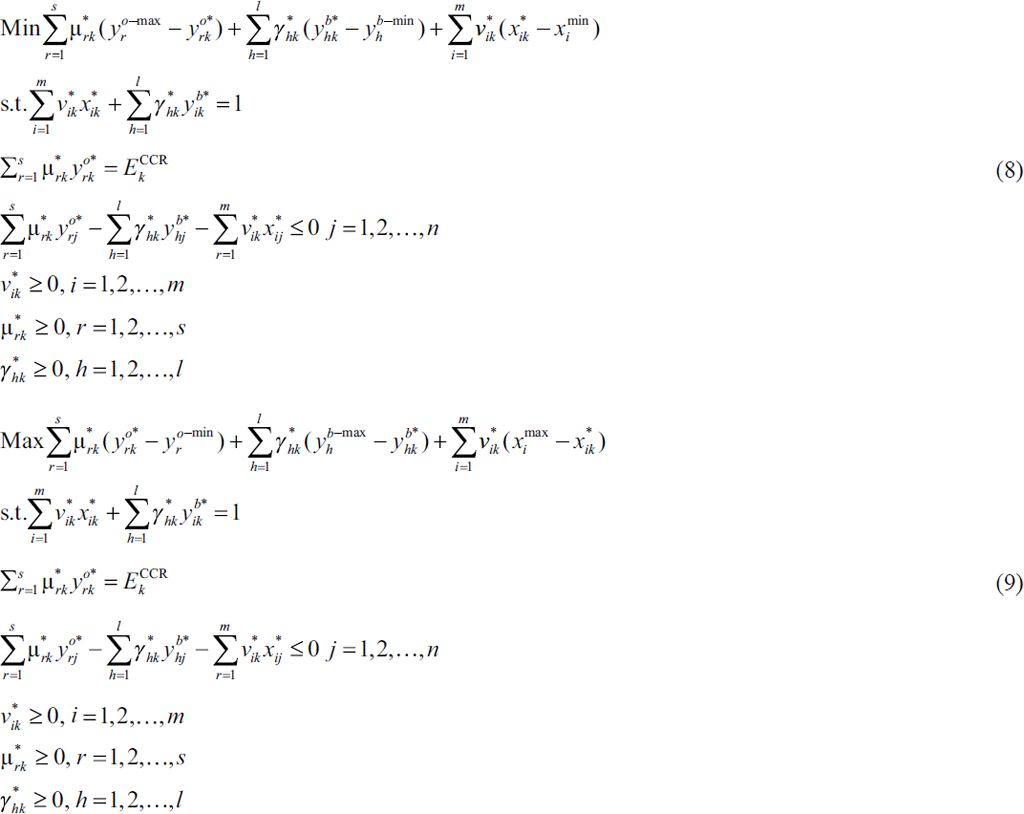
Due to Model 7 being built on a self-evaluation model, its solutions often yield multiple suppliers with an efficiency score of 1, and zero weights are also inevitable. Introducing a cross-evaluation model can effectively address such issues. Building on the ideas of Wang et al. (2011), this paper establishes a cross-efficiency quadratic objective model based on positive and negative ideal points as references, as detailed below:
Citation: International Food and Agribusiness Management Review 28, 4 (2025) ; 10.22434/ifamr.1154
where  and
and  represent the maximum and minimum inputs of the i-th input for all agricultural product suppliers,
  and
and  represent the maximum and minimum expected outputs of the r-th expected output for all agricultural product suppliers,
  and
and  represent the maximum and minimum undesirable outputs of the h-th undesirable output for all agricultural product suppliers.
  and
and  are the optimal inputs, optimal expected outputs, optimal undesirable outputs, and the agricultural product suppliers DMUk with their CCR efficiency, which can be obtained when solving Model 7.
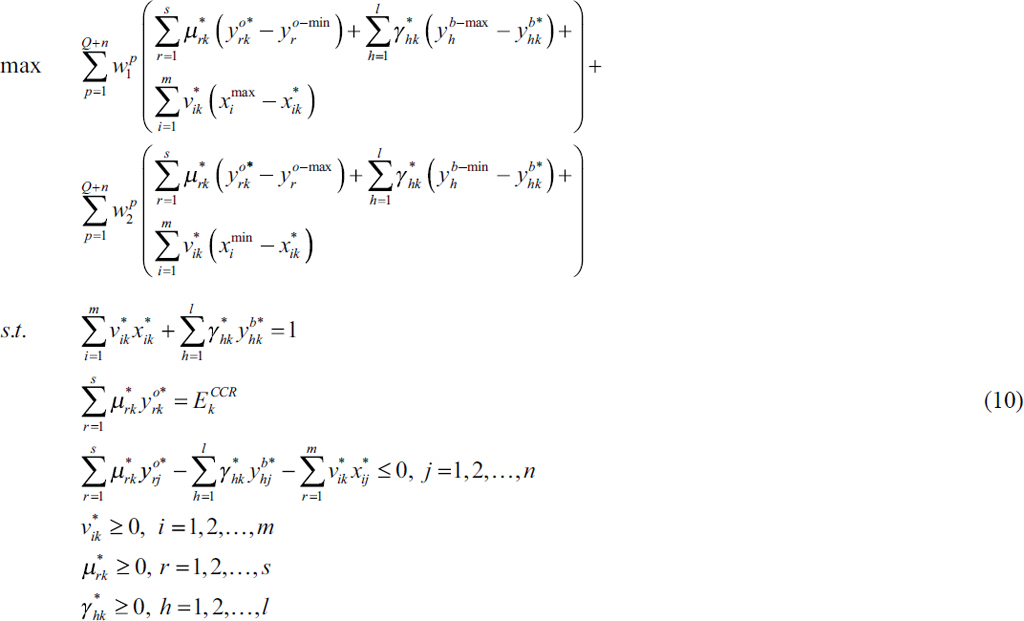
In order to balance the preferences of DMs and all evaluated suppliers, inspired by the ideas of Hatami-Marbini et al. (2017), we have made improvements to Model 8 and Model 9, as shown below:
Citation: International Food and Agribusiness Management Review 28, 4 (2025) ; 10.22434/ifamr.1154
where  represents the coefficient of DMs preferring the negative ideal point as the reference, and similarly,
  represents the coefficient of DMs preferring the positive ideal point as the reference. If there are Q DMs and n evaluated suppliers, then the preference weight of each DM for each evaluated supplier is denoted as
  . Consequently,
  and
and  are subject to the constraint
  .
.
It is evident that Model 10 represents the target solution under ideal conditions, where DMs are entirely optimistic, and the evaluation results are highly risky. Therefore, we further improve Model 10 by incorporating the influence of DMsâ optimistic attitude factors. The specific model is as follows:
Citation: International Food and Agribusiness Management Review 28, 4 (2025) ; 10.22434/ifamr.1154
In this context,  and
and  represent the optimism and pessimism levels of the DMs, respectively. They are subject to constraints similar to those of
  .
.
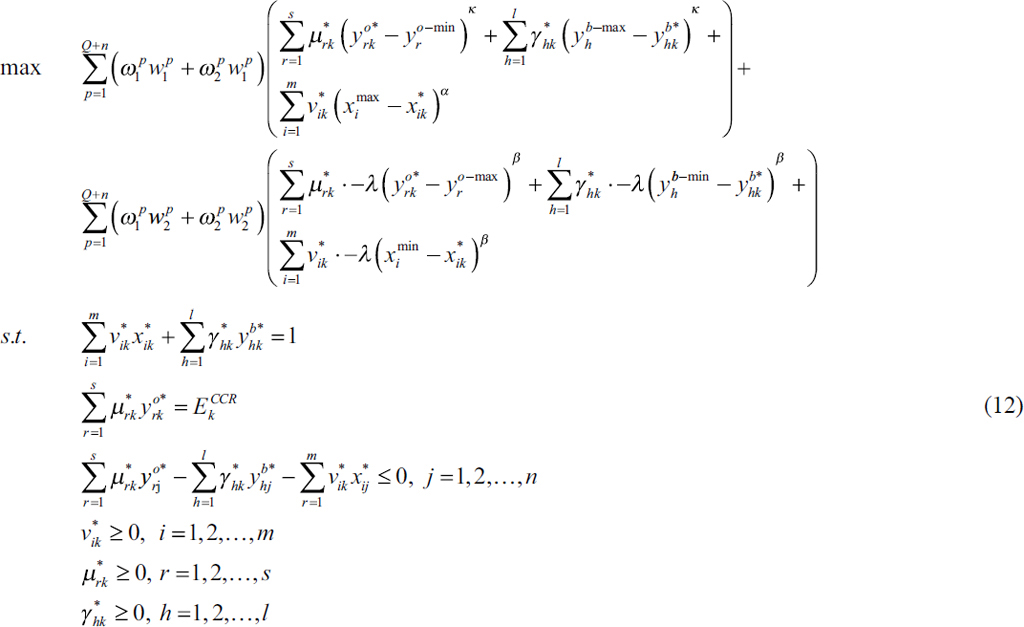
Model 11 still follows the expected utility function, assuming that DMs and evaluated suppliers are perfectly rational, thus overlooking their risk attitudes. In this paper, the a-cut method is employed to process input, output, and undesirable output indicators during the performance evaluation of agricultural product suppliers. In Model 12, we have replaced the parameter
Citation: International Food and Agribusiness Management Review 28, 4 (2025) ; 10.22434/ifamr.1154
When applying the improved Model 12 to evaluate the efficiency of agricultural product suppliers, the cross-efficiency evaluation matrix of agricultural product suppliers can be computed.
3.2 The cross-efficiency aggregation model proposed in this paper
The paper presents a method for calculating the weights of cross-efficiency aggregation sets. The proposed cross-efficiency aggregation method considers the acceptance attitudes of each agricultural product supplier towards other suppliers. The resulting aggregated preferences are fair and easily accepted, thus the aggregated cross-efficiency gains recognition from all agricultural product suppliers.
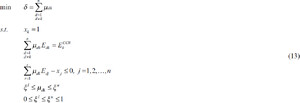
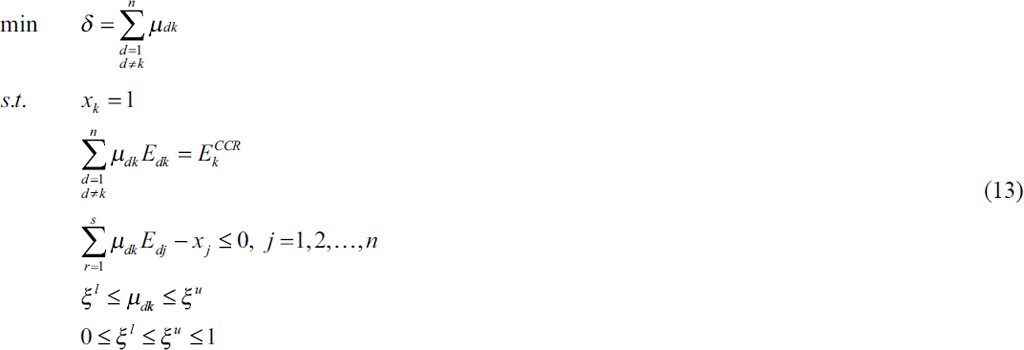
We regard the cross-efficiency obtained by each DMU as their outputs, and assume that all DMUs have an input value of 1. We use Model 13 to optimize the aggregation weights for DMUs. Model 13 is presented as follows:
Citation: International Food and Agribusiness Management Review 28, 4 (2025) ; 10.22434/ifamr.1154
Where
After obtaining the credibility of each DMUd through Model 13, we calculate the overall credibility of DMUd using equation (14), as shown below:
Citation: International Food and Agribusiness Management Review 28, 4 (2025) ; 10.22434/ifamr.1154
The aggregation weights Ud of DMUd âs cross-efficiency are shown in equation (15):
Citation: International Food and Agribusiness Management Review 28, 4 (2025) ; 10.22434/ifamr.1154
The final cross-efficiency score of DMUd is:
Citation: International Food and Agribusiness Management Review 28, 4 (2025) ; 10.22434/ifamr.1154
Thus, the cross-efficiency evaluation results of all agricultural product suppliers can be computed, and based on these results, performance ranking of suppliers can be determined. In the next section, we will provide a case study to validate this method.
4. Case study
4.1 A case study of cross-efficiency evaluation for a corn supplier
The production and operational status of 11 corn suppliers in a city in Shandong Province, China, serve as a case study in this paper, with specific data provided upon request. These 11 suppliers utilize three types of energy inputs: labor, water resources, the seed and pesticide costs. Two expected outputs are corn crop and its by-products corn stover, while one undesirable output is the soil maintenance costs. Labor, water resources, corn stover, and soil maintenance costs are represented as triangular fuzzy numbers, while the remaining indicators are real numbers. Setting the
Self-evaluated efficiency of suppliers and their optimal input-output values.
Citation: International Food and Agribusiness Management Review 28, 4 (2025) ; 10.22434/ifamr.1154
From Table 1, it is observed that when applying Model 7 for the efficiency solving of suppliers, 8 suppliers achieved an efficiency score of 1. At this point, it is impossible to differentiate the rankings of these 8 suppliers, and they are all ranked first. To enhance the distinguishability of the evaluation results, after obtaining the self-assessment efficiency of all suppliers, we input them into Model 12 for calculation.
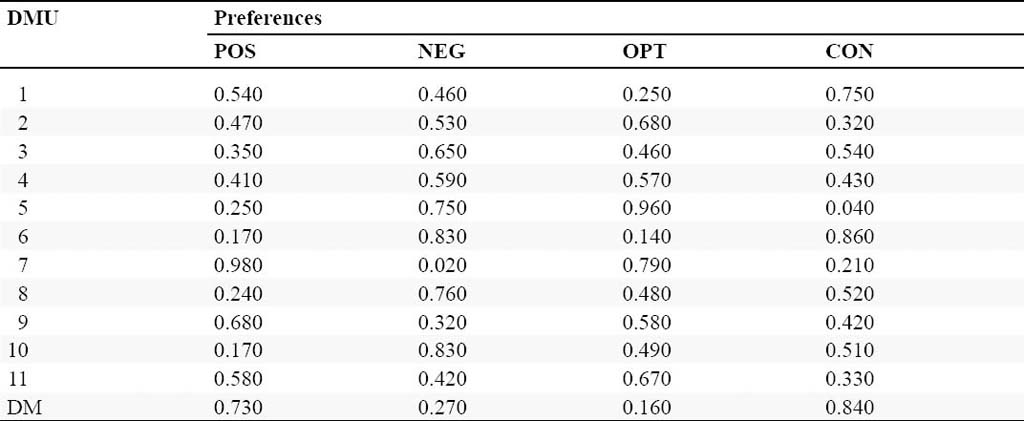
Assuming there is only one evaluator for the suppliers. With 11 evaluated suppliers, there are 12 DMs whose preferences for positive and negative ideal points, as well as their optimism towards decision-making execution, need to be considered. We randomly assign preferences and optimism levels to the 12 DMs, resulting in the following overall preferences: positive ideal point preference of 0.46, negative ideal point preference of 0.54, optimism level of 0.52, and conservatism level of 0.48. The details are given in Table 2.
Reference point preferences and optimism levels of 12 decision makers.
Citation: International Food and Agribusiness Management Review 28, 4 (2025) ; 10.22434/ifamr.1154
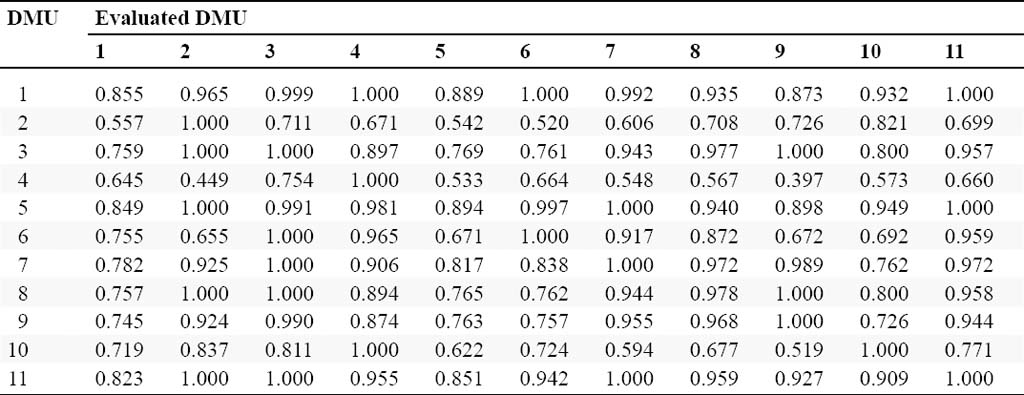
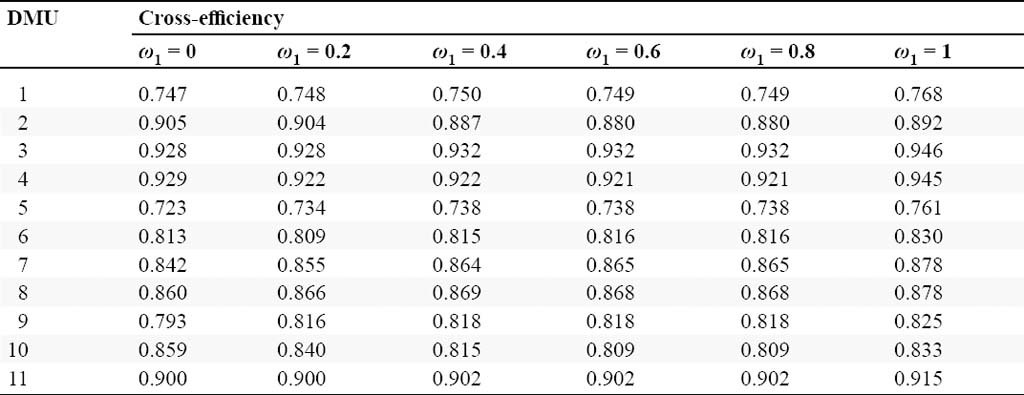
The data from Tables 1 and 2 are substituted into Model 12 for calculation, resulting in the cross-efficiency of the 11 corn suppliers, as shown in Table 3.
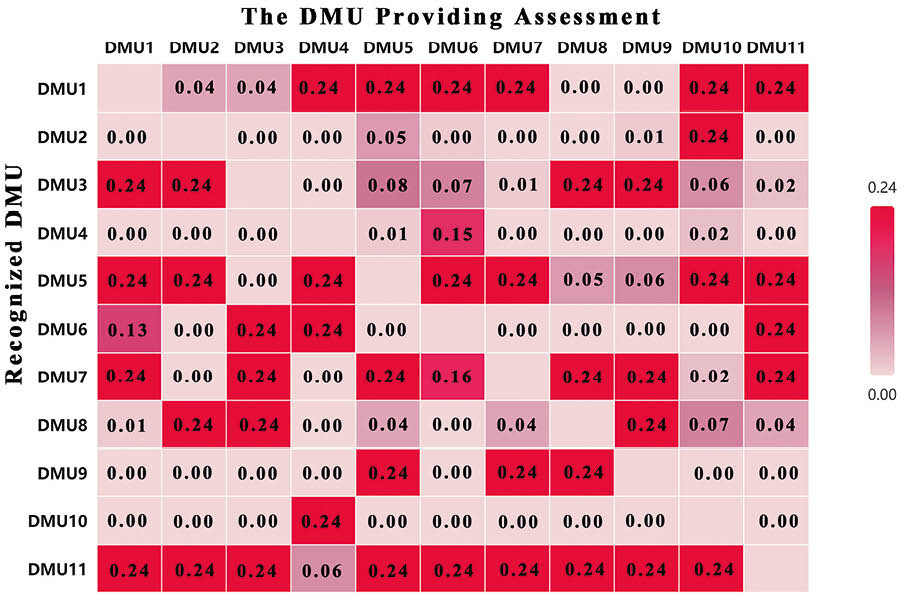
Cross-efficiency matrix of DMUs solved based on Model 12.
Citation: International Food and Agribusiness Management Review 28, 4 (2025) ; 10.22434/ifamr.1154
As shown in Table 3, except for DMU2 and DMU3, the remaining nine DMUs received efficiency evaluations of 1 no more than three times. Therefore, in this study, we set the parameter
Heatmap of aggregated weights for DMU cross-efficiency.
Citation: International Food and Agribusiness Management Review 28, 4 (2025) ; 10.22434/ifamr.1154
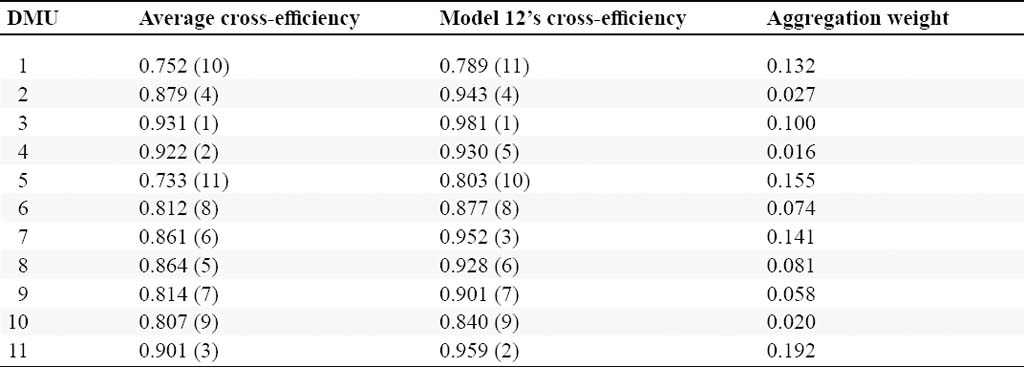
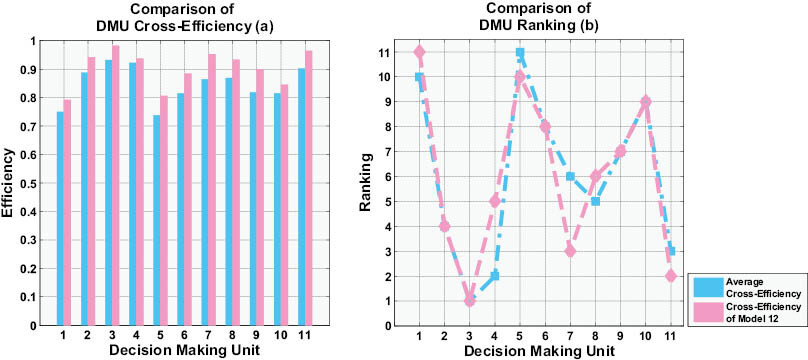
The degree of recognition (aggregation weights), final cross-efficiency, and average cross-efficiency of the 11 corn suppliers are shown in Figure 3 and Table 4. The numbers immediately following the efficiency values, enclosed in parentheses, represent the individual efficiency rankings of the 11 corn suppliers.
Average cross-efficiency and aggregated cross-efficiency from Model 12.
Citation: International Food and Agribusiness Management Review 28, 4 (2025) ; 10.22434/ifamr.1154
It can be observed that the model exhibits strong discriminative power after introducing the cross-efficiency peer evaluation mechanism, enabling a differentiated ranking of the 11 corn suppliers, as shown in Figure 4. This is something that self-evaluation models often fail to achieve. From Table 1 and Table 4, the efficiency of DMU3 ranks first among the 11 corn suppliers due to two key factors. Firstly, DMU3 excels in managing inputs such as water resources and labor while maintaining high corn output. For example, when comparing these three input-output indicators, DMU3 requires only 0.106 units of labor resources and 0.355 units of water resources to produce one unit of corn crop. In contrast, DMU7 needs 0.130 units of labor resources and 0.489 units of water resources for the same output, and DMU9 requires 0.196 units of labor resources and 0.675 units of water resources per unit of corn crop output. It is worth noting that the self-assessed efficiency of DMU3, DMU7 and DMU9 is all rated as 1. Secondly, although DMU3âs inputâoutput ratios for Seed and pesticide costs input, corn stover output, and soil maintenance costs are not the best, they still reach an advanced level. This ensures that DMU3 receives high peer evaluation results when compared to other corn suppliers. A similar situation occurs with DMU11, which ranks second in efficiency.
Comparison of DMU cross-efficiency and their rankings.
Citation: International Food and Agribusiness Management Review 28, 4 (2025) ; 10.22434/ifamr.1154
The case of DMU7, however, differs from that of DMU3 and DMU11. Although DMU7 does not establish an absolute advantage in input-output ratios, its operational and production methods are favored by other corn suppliers. In other words, DMU7âs production and operation model appear to be common and reasonable. As a result, DMU7 gains more influence in peer evaluations, which enhances the reliability of its self-assessed efficiency. Consequently, during the efficiency aggregation process, the weight of DMU7âs self-assessed efficiency increases, leading to its final ranking rising to third place. As a contrasting case, although DMU2 and DMU4 manage their labor resource input effectively, their performance in peer evaluations is not recognized by other DMUs. Consequently, their self-assessed efficiencies are scarcely considered in their final cross-efficiency scores, leading to a decline in their efficiency rankings.
DMU1 and DMU5 rank at the bottom of the performance rankings among the 11 corn suppliers. Their high soil maintenance costs negatively impact their performance. During the self-assessment phase, neither DMU1 nor DMU5 could achieve a DEA efficient evaluation. Moving into the peer evaluation phase, their inefficient input-output ratios further exacerbated their poor performance. To improve their production efficiency, DMU1 and DMU5 should reasonably control their labor resource inputs, increase corn output, and find ways to reduce soil maintenance costs.
Unlike previous approaches, this study did not utilize the mean cross-efficiency to evaluate supplier performance. Instead, we computed aggregation weights for cross-efficiency based on the varying degrees of recognition received by different suppliers. As indicated by Figure 4 and Table 4, among the 11 corn suppliers, DMU11, DMU5 and DMU7 received higher degrees of recognition. The opposite situation occurs with DMU2 and DMU10, as they are unable to provide higher evaluations for other DMUs. Consequently, DMU2 and DMU10 are not acknowledged by other corn suppliers.
The recognition of suppliers by other suppliers is reflected in the aggregation weights of cross-efficiency. DMU11, DMU5 and DMU7 exhibit the highest aggregation weights, while DMU2 and DMU10 have the lowest aggregation weights. This further impacts the cross-efficiency and performance ranking of all DMUs. DMU4 and DMU7 are most affected in terms of efficiency and ranking. When ranked based on average cross-efficiency, DMU4 could rank second, while DMU7 could only rank sixth. However, after the revision of aggregation weights in this study, the ranking of DMU4 declined to fifth, whereas the ranking of DMU7 increased to third. The reason lies in the fact that DMU6, and DMU10 provide higher evaluations for DMU4. However, the recognition of DMU6 and DMU10 from other DMUs is not high, suggesting that their favorable evaluations for DMU4 are exceptional and not persuasive. On the other hand, DMU11 and DMU5 provide the highest evaluations for DMU7, and as the influence of DMU11 and DMU5 increases, the evaluation results and ranking of DMU7 naturally rise.
The model proposed in this paper also considers the environmental sustainability of suppliers. The cross-efficiency comparison results of the 11 suppliers are depicted in Figure 4-(a) and Figure 4-(b). It is evident from Table 4, and Figure 4 that the evaluation method proposed in this paper effectively addresses the performance evaluation issue of suppliers with undesirable output indicators. Furthermore, during the evaluation process, all fuzzy data pertaining to suppliers can be transformed into precise values, facilitating DMs in more intuitively analyzing and comprehending the operational status of suppliers.
4.2 Model comparison
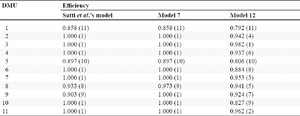
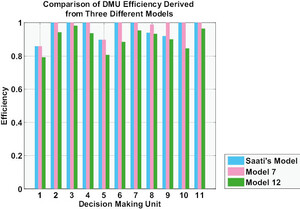
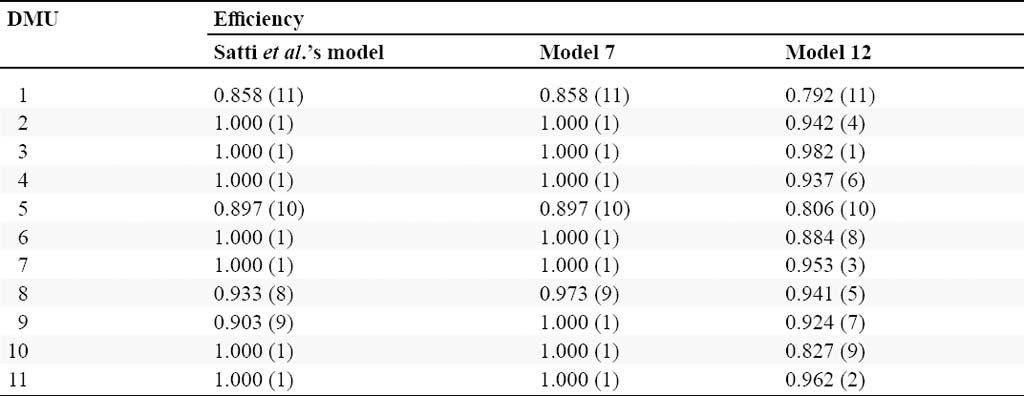
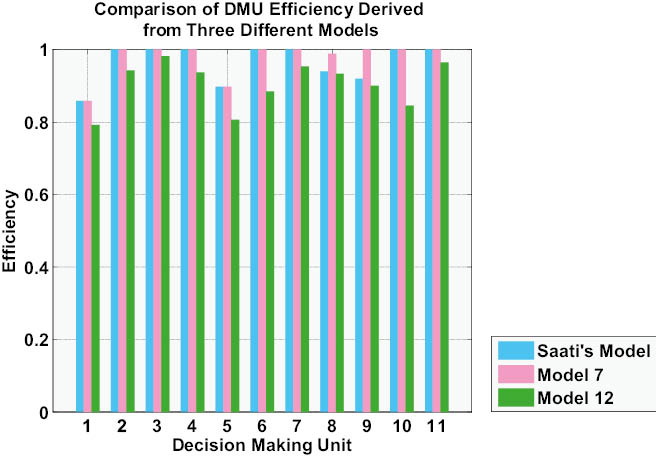
The data of 11 corn suppliers were inputted into the model proposed by Saati et al. (2002) and the model proposed in this paper for calculation. Comparing the efficiency results and efficiency rankings obtained from the three models, and the results were shown in Table 5 and Figure 5.
Comparison of DMU efficiencies derived from three different models.
Citation: International Food and Agribusiness Management Review 28, 4 (2025) ; 10.22434/ifamr.1154
Comparison of DMU efficiency derived from three different models.
Citation: International Food and Agribusiness Management Review 28, 4 (2025) ; 10.22434/ifamr.1154
A reasonable supplier evaluation method should assess suppliersâ comprehensive capabilities from multiple perspectives during the evaluation process and provide DMs with detailed, clear, and distinguishable performance rankings and comparative results. Based on these two factors, we analyze the three evaluation models according to the comparative results shown in Table 5.
Analyze the three models in terms of comprehensive evaluation capabilities. Saati et al.âs (2002) model shows some deficiencies in both the ability to consider evaluation metrics and comprehensive evaluation capabilities. Firstly, because Saati et al.âs (2002) model is a self-assessment model, DMUs tend to choose the most favorable weights to achieve higher efficiency ratings, which inevitably inflates their efficiency. Additionally, Saati et al.âs (2002) model does not consider the undesirable output indicators of corn suppliers, resulting in a less objective and comprehensive evaluation. For example, DMU9 performs exceptionally well in handling soil maintenance, and Model 7 gives DMU9 an efficiency score of 1. Saati et al.âs (2002) model overlooks this aspect, resulting in a low-efficiency evaluation for DMU9. A similar situation occurs with DMU8. This indicates that by considering undesirable output indicators, the model can provide fairer and more realistic evaluation results for agricultural products suppliers, which also helps incentivize suppliers to strive for environmental sustainability. In this regard, the evaluation results of Model 7 are evidently more reasonable.
Nevertheless, DMU9 received a DEA efficient evaluation solely due to its excellent performance in handling soil maintenance, which indicates that DMU9 placed a disproportionate amount of weight on undesirable output indicators, neglecting other input-output indicators. Such an evaluation lacks credibility and is unrealistic. Similarly, other DMUs also tend to allocate significant weight to their most outstanding single indicator. In the evaluation results of Model 7, eight out of eleven suppliers rated themselves as DEA efficient. Saati et al.âs (2002) model similarly rated seven suppliers as DEA efficient. This outcome highlights the shortcomings of applying self-evaluation models in the evaluation of suppliers, and it underscores the necessity of evaluating the comprehensive capabilities of agricultural suppliers from multiple perspectives in performance assessment.
The proposed Model 12 abandons the self-assessment approach and adopts a peer assessment method, considering decision-makers as boundedly rational. This model evaluates the efficiency of 11 corn suppliers from various angles, taking into account the actual competitiveness of these suppliers, which leads to more reasonable results. For instance, as previously mentioned, DMU9 excels in controlling land maintenance costs and therefore receives high ratings in this area. However, it is unrealistic for DMU9 to obtain a high overall evaluation and secure large orders based solely on this singular advantage. When other DMUs evaluate DMU9âs performance using their operational models, the deficiencies in DMU9âs comprehensive capabilities become apparent, resulting in its overall efficiency ranking dropping to the 7th position. Similarly, when we focus on DMU10 and DMU3, it is evident that evaluating their comprehensive capabilities significantly influences their final actual efficiency rankings. As shown in Table 5, in the self-assessment model, DMU10 deemed itself to be DEA efficient. When other suppliers evaluated DMU10 using their input-output weights, DMU10 showed significant inefficiencies, causing its efficiency ranking to drop from first to ninth place. Conversely, DMU3 demonstrated more comprehensive performance. During the cross-evaluation phase, when six suppliers used their own weights to assess DMU3âs efficiency, DMU3 still achieved a DEA efficient evaluation. Therefore, compared to Saati et al.âs (2002) model and Model 7, the proposed Model 12 more effectively assesses the comprehensive capabilities of suppliers during the evaluation process.
In terms of the distinguishability of evaluation results, the proposed Model 12 also outperforms both Saati et al.âs (2002) model and Model 7. As shown in Table 5, Saati et al.âs (2002) model evaluates the performance of 11 corn suppliers, resulting in seven of them receiving an efficiency score of 1, implying that these seven suppliers all rank first in efficiency. It is easy to imagine how challenging it would be for DMs to determine the most suitable corn supplier for collaboration from these seven. Since Model 7 considers one additional undesirable output factor compared to Saati et al.âs (2002) model, it further complicates the situation by giving eight suppliers an efficiency score of 1, making it even harder to differentiate among them.
In contrast, the proposed Model 12 not only provides more objective evaluation results but also assigns unique efficiency scores and rankings to each of the 11 corn suppliers. DMs can effectively distinguish between the suppliers based on the evaluation results from Model 12. This further demonstrates the rationality and appropriateness of the proposed Model 12 in the context of agricultural supplier evaluation.
4.3 Sensitivity analysis
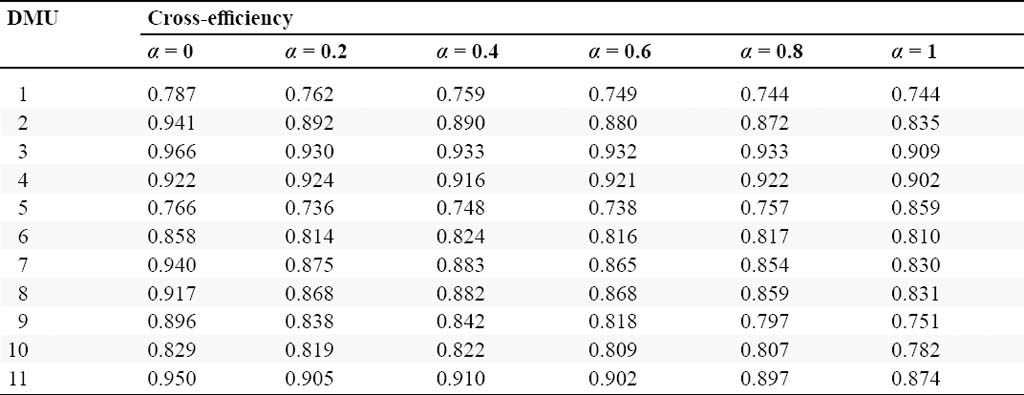
This section will analyze the impact of different optimism levels of DMs and evaluated suppliers, various reference point preferences, and varying confidence levels on the supplier evaluation results. Specifically, it will examine how different values of
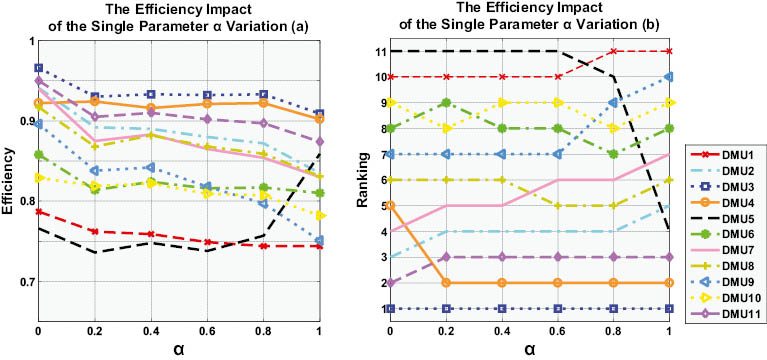
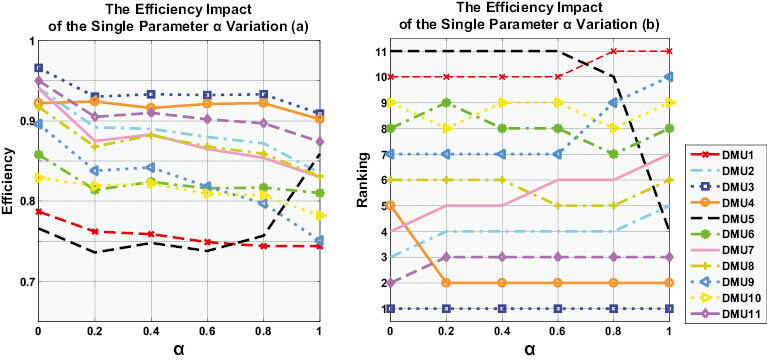
Sensitivity analysis of α -cut
Consistent with the previous sections, the initial values for,
The impact of different values of the parameter α on DMU efficiency.
Citation: International Food and Agribusiness Management Review 28, 4 (2025) ; 10.22434/ifamr.1154
Comparison of DMU cross-efficiency and their rankings.
Citation: International Food and Agribusiness Management Review 28, 4 (2025) ; 10.22434/ifamr.1154
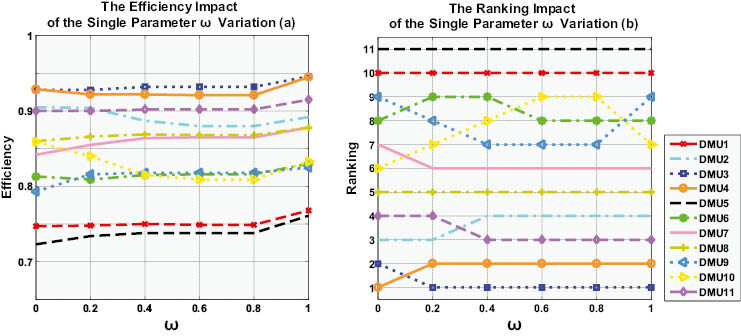
Scensitivity analysis of DM reference point preference.
Table 7 and Figure 7 illustrate the changes in DMU efficiency values as the reference point preferences of DMs and evaluated suppliers vary, with other parameters held constant at their initial values. The initial values for
The impact of different values of parameter Ï on DMU efficiency.
Citation: International Food and Agribusiness Management Review 28, 4 (2025) ; 10.22434/ifamr.1154
Comparison of DMU cross-efficiency and their rankings.
Citation: International Food and Agribusiness Management Review 28, 4 (2025) ; 10.22434/ifamr.1154
When
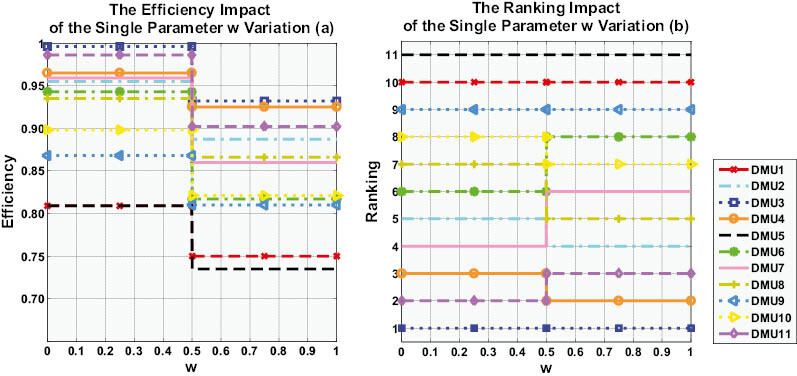
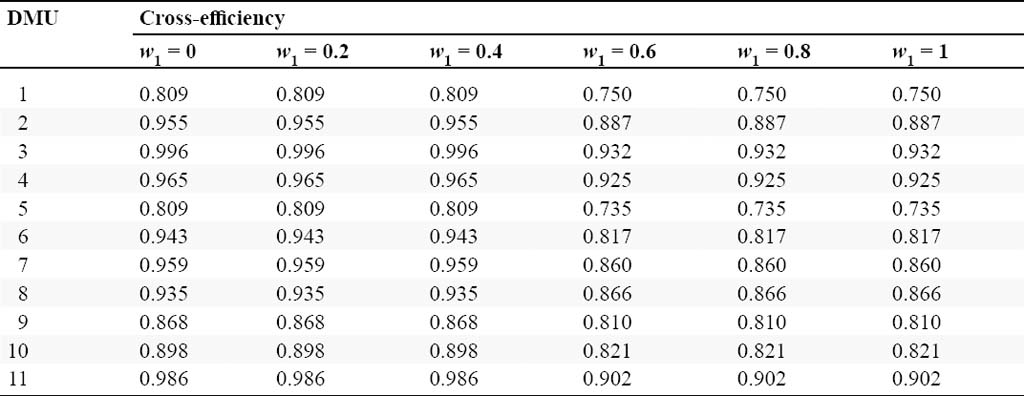
Sensitivity analysis of DM optimism levels
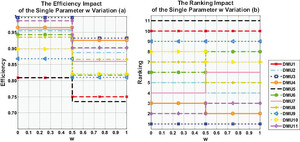
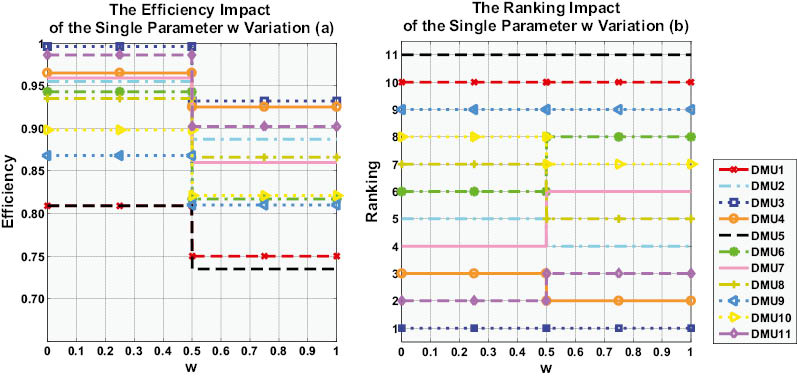
By keeping the values of parameters
Comparison of DMUs cross-efficiency and their rankings.
Citation: International Food and Agribusiness Management Review 28, 4 (2025) ; 10.22434/ifamr.1154
The impact of different values of parameter w on DMU efficiency.
Citation: International Food and Agribusiness Management Review 28, 4 (2025) ; 10.22434/ifamr.1154
When the value of w1 is in the range of 0 to 0.5, DMU6 and DMU7 maintain relatively high efficiency rankings. In other words, assuming a future production environment that is not optimistic, DMU6 and DMU7 demonstrate superior production efficiency compared to other DMUs, being better able to maintain efficient agricultural product supply activities under adverse conditions. As w1 increases, the DMsâ optimism grows. When w1 is in the range of 0.5 to 1, indicating a shift from a pessimistic to an optimistic decision-making attitude, the ranking of DMU8 significantly improves. This suggests that DMU8 is more adaptable to this positive decision environment and has greater potential for improvement. Although the value of w1 significantly impacts the efficiency and ranking results of all DMUs around the midpoint of 0.5, once DMs establish their level of optimism, the efficiency and rankings of the DMUs remain relatively stable. This stability occurs because the value of w1 significantly influences the optimization direction of the objective function rather than the prospect values of the indicators. The efficiency and rankings of the 11 suppliers exhibit a high sensitivity to the optimism level of the DMs.
5. Conclusion
This paper proposes a DEA cross-efficiency fuzzy evaluation method that considers the reference point preferences, optimism levels, and risk preferences of DMs and suppliers to evaluate agricultural product suppliers with fuzzy numbers in their metrics. Firstly, the model incorporates the undesirable outputs of suppliers, allowing the environmental sustainability of suppliers to be assessed. Secondly, the evaluation method introduces the concept of cross-efficiency to prevent suppliers from being evaluated based on unreasonable input-output ratios. By examining the comprehensiveness of suppliers, the method ensures that DMs select high-efficiency suppliers with good long-term operational capabilities, indicating that this evaluation method considers the production sustainability of suppliers. Furthermore, the paper adheres to the principle of mutual respect between DMs and evaluated suppliers, treating both as equal decision-making entities. Both the DMs and the evaluated suppliers have preferences regarding the positive and negative ideal points. Their optimistic and pessimistic attitudes, based on the optimization direction of the modelâs secondary function, are taken into account. The resulting evaluation outcomes are easily accepted by all parties. Furthermore, this fair decision-making process undoubtedly fosters better communication between DMs and suppliers, jointly promoting the sustainability of both the enterprises and the agricultural product suppliers. Lastly, since completely rational individuals do not exist in real life, considering the bounded rationality of DMs ensures that the evaluation results are more realistic. By incorporating prospect theory, the paper portrays the bounded rationality of all DMs and evaluated suppliers, making the obtained evaluation results more reflective of real-world situations.
Although the proposed model has certain innovativeness and practicality, in the evaluation process, we assume that suppliers operate in a black-box manner, neglecting the complex network structures and production situations of suppliers. In the next research phase, we will incorporate DEAâs network evaluation structure to attempt to unveil the black-box operation of suppliers and evaluate the efficiency of agricultural product suppliers across multiple stages.
References
Baker, R.C. and S. Talluri. 1997. A closer look at the use of data envelopment analysis for technology selection. Computers and Industrial Engineering 32(1): 101â108. https://doi.org/10.1016/S0360-8352(96)00199-00194
Charnes, A., W.W. Cooper and Charnes, A., E. Rhodes. 1978. Measuring the efficiency of decisionâmaking units. European Journal of Operational Research 2(6): 429â444. https://doi.org/10.1016/0377-2217(78)90138-90138
Doyle, J. and R. Green. 1994. Efficiency and cross-efficiency in DEA: derivations, meanings and uses. Journal of the Operational Research Society 45(5): 567â578. https://doi.org/10.1057/jors.1994.84
Eeckaut, T.P.V. 2000. Fuzzy pair-wise dominance and implications for technical efficiency performance assessment. Journal of Productivity Analysis 13: 207â230. https://doi.org/10.1023/A:1007870908622
Falagario, M., F. Sciancalepore, N. Costantino and R. Pietroforte. 2012. Using a DEA-cross efficiency approach in public procurement tenders. European Journal of Operational Research 218(2): 523â529. https://doi.org/10.1016/j.ejor.2011.10.031
Gong, X., C. Yu, L. Min and Z. Ge. 2021. Regret theory-based fuzzy multi-objective portfolio selection model involving DEA cross-efficiency and higher moments. Applied Soft Computing 100: 106958. https://doi.org/10.1016/j.asoc.2020.106958
Guo, P. 2009. Fuzzy data envelopment analysis and its application to location problems. Information Sciences 179(6): 820â829. https://doi.org/10.1016/j.ins.2008.11.003
Hatami-Marbini, A., P.J. Agrell, M. Tavana and P. Khoshnevis. 2017. A flexible cross-efficiency fuzzy data envelopment analysis model for sustainable sourcing. Journal of Cleaner Production 142: 2761â2779. https://doi.org/10.1016/j.jclepro.2016.10.192
Kahneman, D. and A. Tversky. 1979. Prospect Theory: An analysis of decision under risk. Econometrica 47: 263â291. https://doi.org/10.2307/1914185
Karsak, E. Ertugrul and M. Dursun. 2014. An integrated supplier selection methodology incorporating QFD and DEA with imprecise data. Expert Systems with Applications 41(16): 6995â7004. https://doi.org/10.1016/j.eswa.2014.06.020
Kuo, R.J. and Y.J. Lin. 2012. Supplier selection using analytic network process and data envelopment analysis. International Journal of Production Research 50(11): 2852â2863. https://doi.org/10.1080/00207543.2011.559487
Kuo, R.J., Y.C. Wang and F.C. Tien. 2010. Integration of artificial neural network and MADA methods for green supplier selection. Journal of Cleaner Production 18(12): 1161â1170. https://doi.org/10.1016/j.jclepro.2010.03.020
LingegÃ¥rd, S., J.A. Olsson, A. Kadefors and S. Uppenberg. 2021. Sustainable public procurement in large infrastructure projects â policy implementation for carbon emission reductions. Sustainability 13(20): 11182. https://doi.org/10.3390/su132011182
Luo, M., G. Zhou and H. Xu. 2023. A differential game model research on dynamic pricing and coordination of fresh agricultural products supply chain based on freshness. Economic Research-Ekonomska Istraživanja 36(2): 2177696. https://doi.org/10.1080/1331677X.2023.2177696
Saati, S.M., A. Memariani and G.R. Jahanshahloo. 2002. Efficiency analysis and ranking of DMUs with fuzzy data. Fuzzy Optimization and Decision Making 1(3): 255â267. https://doi.org/10.1023/A:1019648512614
Sexton, T.R., R.H. Silkman and A.J. Hogan. 1986. Data envelopment analysis: critique and extensions. New Directions for Program Evaluation 1986(32): 73â105. https://doi.org/10.1002/ev.1441
Shao, X. and M. Wang. 2021. Two-stage cross-efficiency evaluation based on prospect theory. Journal of the Operational Research Society 73(7): 1620â1632. https://doi.org/10.1080/01605682.2021.1918587
Talluri, S. and R. Narasimhan. 2004. A methodology for strategic sourcing. European Journal of Operational Research 154(1): 236â250. https://doi.org/10.1016/S0377-2217(02)00649-00645
Wang, Y.-M. and K.-S. Chin. 2010. A neutral dea model for cross-efficiency evaluation and its extension. Expert Systems with Applications 37(5): 3666â3675. https://doi.org/10.1016/j.eswa.2009.10.024
Wang, Y.-M., K.-S. Chin and Y. Luo. 2011. Cross-efficiency evaluation based on ideal and anti-ideal decision-making units. Expert Systems with Applications 38(8): 10312â10319. https://doi.org/10.1016/j.eswa.2011.02.116
Wei, C., H. Wang, G. Li, J. Li, F. Zhang, Y. Wu and Z. Weng. 2024. Multiplex detection methods for mycotoxins in agricultural products: a systematic review. Food Control 158: 110207. https://doi.org/10.1016/j.foodcont.2023.110207
Wu, X. and H. Liao. 2023. Geometric linguistic scale and its application in multi-attribute decision-making for green agricultural product supplier selection. Fuzzy Sets and Systems 458: 182â200. https://doi.org/10.1016/j.fss.2022.08.026
Yu, M.-M., S.-C. Ting and M.-C. Chen. 2010. Evaluating the cross-efficiency of information sharing in supply chains. Expert Systems with Applications 37(4): 2891â2897. https://doi.org/10.1016/j.eswa.2009.09.048
Corresponding author


