Abstract
While voluntary responsible business standards are more flexible than regulation and thus more responsive to changes in society, revising standards can have negative effects on compliance rates. We hypothesize that when non-compliance is visible to external stakeholders and participating firms receive a clear signal that their products are non-compliant, the firms will respond by re-certifying their products, which will raise their certification rates. We tested our hypothesis by conducting a multi-level regression on the certification rates before and after the revision of a voluntary label for healthier food products, active in the Dutch market from 2006 until 2015 in the Dutch market (76 firms, 22 product categories, 1354 firm-category-year observations). Our results show the opposite effect than hypothesized: after standards’ revision, firms with decertified products significantly decrease their certification rates compared to firms without decertified products. We conclude that making standards stricter over time is not always a successful strategy to maintain compliance. We argue that this decrease in compliance after standards’ revisions can be explained by the low behavioural visibility of non-compliance, restricting stakeholder pressure both at the product level by consumers as well as at the firm level by other stakeholders.
1. Introduction
Now present in almost every industry, front-of-pack labels signal to consumers that the product was produced in a societally desirable way (e.g. the Forest Stewardship Council, the Fair-Trade Organisation) or that the use of the product will lead to societally desirable consequences (e.g. health labels such as NutriScore or energy labels) (Aragòn-Correa et al., 2020; Feunekes et al., 2008; Moog et al., 2015; Reinecke et al., 2012; Van Kleef and Dagevos, 2015). The responsible business standards underlying labels are created in response to grand challenges faced by our global society (e.g. climate change, social and economic inequality, and pandemics). These challenges are complex, uncertain, and evaluative — “[d]ifferent actors have different views about what the problem actually is and therefore what constitutes an acceptable solution” (Ferraro et al., 2015, p. 366). Consequently, the definition of the problem is constantly changing, asking for new rules. For example, when new knowledge becomes available about the environmental impact of a product, the related product standards need to change to prevent becoming outdated and obsolete (Dangelico et al., 2013). While the development of ‘hard law’ is often seen as slow and cumbersome (Grinbaum and Groves, 2013; Guston, 2008; Scherer and Palazzo, 2011), voluntary standards or ‘soft laws’ are praised for their responsiveness to changing environments (Brunsson and Jacobsson, 2002; Voegtlin and Scherer, 2017). However, the flexibility of these responsible product standards may come at a price.
While many studies have investigated responsible business standards (Botzem and Dobusch, 2012; Durand et al., 2019; Pache and Santos, 2010, 2021a; Slager et al., 2021; Wijen, 2014), the flexibility of these standards has only limitedly been investigated (Ferraro et al., 2015; Pesch et al., 2021; van den Ende et al., 2012). While changes in the institutional environments of the standards are observed, the effects of these dynamics on the standards are often investigated through a governance lens (Aragòn-Correa et al., 2020; Arenas et al., 2020; Flynn and Hacking, 2019; Moog et al., 2015; Reinecke et al., 2012). For example, Moog et al. (2015) described how tensions between partners in the Forest Stewardship Council arose when industry dynamics changed and competing standards were created. While these studies do observe changes to the standards themselves, their investigations focus on changes in the perceived credibility and fairness of the standard-setter — also referred to as input legitimacy (Arenas et al., 2020; Boström, 2006; Mena and Palazzo, 2012). However, changes in standards also influence the other source of legitimacy: rules effectiveness or output legitimacy (Botzem and Dobusch, 2012; Brunsson et al., 2012; Mena and Palazzo, 2012).
The compliance rate is the main indicator used to measure the rule effectiveness of voluntary standards (Mena and Palazzo, 2012). Many studies investigate compliance, but the majority portray the voluntary standards as stable over time (Brunsson et al., 2012). Moreover, compliance is often measured as a binary variable — i.e. either a firm is compliant, or it is not — ignoring that compliance behaviour has multiple gradients (Endenich et al., 2022; Oliver, 1991; Pache and Santos, 2021a). Capturing these gradients is important because the relation between the flexibility of standards and compliance is not straightforward. While adjusting standards allows them to respond to dynamic environments, when standards change too often, they do not provide the stability needed to be a predictable factor for firms to rely on (van den Ende et al., 2012). Handling this paradox between flexibility and stability is crucial for the legitimacy of voluntary standards in the long term and thus, for achieving their objective of tackling grand challenges (Scherer et al., 2016).
One strategy to keep this balance is to implement a stepwise revision strategy: the societal actors agree at the start with more lenient standards to boost participation and compliance but only under the condition that the standards become stricter over time (Moog et al., 2015). Previous studies have provided valuable insights into organisational compliance behaviour, but they did not provide conclusive answers on the effectiveness of this stepwise strategy in maintaining output legitimacy of voluntary responsible business standards. In our study, we analyse the relationship between standards’ revisions and the compliance behaviour of participating firms, answering the following research question: Can a stepwise revision strategy to make standards stricter over time maintain the compliance of firms to responsible business standards?
To investigate the effectiveness of this stepwise standard revision strategy, a context is required that a) has an observable change in standards over time and b) allows measuring small changes in the compliance behaviour of the participating firms. The context of our study complies with both requirements. Our longitudinal data regarding a voluntary, health label for food products from 2006 until 20151 in the Dutch market allows us to study compliance before and after the revision of the standards. In this revision, the standards did not change in one direction but were adjusted per product category: some stricter, some less strict, and some stayed the same. These multiple directions allow us to observe how firms respond to different standard revisions within the same programme. Since these standards were set at a product category level and we have data both at the firm and the product level (76 firms, 22 product categories, 3577 products, 1354 firm-category-year observations), a multi-level analysis was conducted providing a richer view of compliance behaviour. Our results provide reasons to doubt whether making voluntary standards stepwise stricter is a successful strategy for maintaining the legitimacy of voluntary standards. Reviewing the characteristics of the investigated case and previous theories on the legitimacy of standards, we discuss how to stimulate firms to maintain their compliance rates, thereby, providing lessons for the governance of voluntary standards and points for further research.
2. Literature review and hypothesis development
In organisation studies, the concept of standards can be investigated from three angles (Brunsson et al., 2012). First, standards are often studied as external influences on the internal organisations of firms with studies focusing on how standards are adopted and implemented in organisations. Second, standards are a form of organisation that supports the governance of firm behaviour in society. Third, standards are seen as a product of a formal standardization organisation aiming to develop and maintain the standards. In this paper, we investigate the interrelation between these three angles by looking at how firms’ compliance responds to changes in the standards and thereby, indirectly impacts the success of the legitimacy strategy of the standardization organisation. Before the hypotheses of the paper are explained, we, first, show how the unique characteristics of voluntary standards have a role to play in their legitimacy and the need for stepwise revision strategies to maintain the legitimacy of responsible business standards.
2.1 The characteristics of voluntary standards
Although standards come in many shapes and sizes, four characteristics distinguish them from other rules or norms (Brunsson et al., 2012). The first element is that standards are for common use, meaning that multiple organisations or individuals can implement them. Although some standards are set up for specific industries, products, or processes, they still apply to organisations other than the standard-setting organisation that created them, and thus they cross organisational boundaries (Brunsson et al., 2012). The second element is their voluntary status. Standards do not have formal power of enforcement as the standard-setting organisation does not have the right to force others into standard adoption (Brunsson et al., 2012; Rasche et al., 2013). The third element is formal authorship. Although standards are mechanisms of social order and — in the case of responsible business standards — can reflect “globally valid conceptions of virtuous behaviour and morality” (Haack et al., 2012, p. 818), they differ from societal norms as they are the result of a deliberate decision by individuals or organisations. Norms, on the other hand, result from repeated patterns of social interaction (Rasche et al., 2013; Sandholtz, 2012). With this formal authorship comes specific demands for the legitimacy of this standardization organisation, as they often have no legal authority (Brunsson et al., 2012).
The final characteristic of standards is that they are dynamic. Although standards are mainly implemented to provide order in a complex and opaque world, they are not to be seen as stable entities (Brunsson et al., 2012; Wijen, 2014). One of the main elements of standardization to be changed over time is the content of the standards themselves. Egyedi & Blind (2008) define three strategies for revision: a) grafting in which the new standards are based upon the prior standards but adjust them; b) extending, in which the new standards add features to the prior standards; c) revolution, in which the new standards are radically different than the prior standards. Although this dynamic character of standards has been widely accepted, previous empirical studies have ignored how tricky this revision process is (Slager et al., 2012).
2.2 Standard revision: Balancing Output and Input Legitimacy
The main risk for this revision process is that the standards lose their legitimacy. Two types of legitimacy can be distinguished: output and input legitimacy (Mena and Palazzo, 2012). Output legitimacy of voluntary standards concerns the extent to which standards are actually able to standardize the behaviour of adopters and is thus predominantly dependent on their diffusion (Botzem and Dobusch, 2012). Wider diffusion increases the reach and effectiveness of the standards. Especially in the case where there are multiple competing standards, their adoption rate determines whether they are regarded as legitimate norms or as ‘paper tigers’ (Timmermans and Epstein, 2010). The diffusion of standards is determined by the number of firms participating in the standards and the level of compliance with the standards within the firms (Botzem and Dobusch, 2012; Wijen, 2014). Compliance is defined as “the extent that an organization consciously and strategically chooses to comply with institutional pressures in anticipation of specific self-serving benefits” (Oliver, 1991, p. 152).2 Whether the participation and compliance rates differ depends on which level of corporate behaviour is evaluated and certified. Many studies have investigated voluntary standards with firm-level certification, such as B-Corps, Forest Stewardship Council, and Fairtrade (Levy et al., 2016; Moog et al., 2015; Reinecke et al., 2012; Stubbs, 2017). In these cases, firms can only participate if they comply and, thus, compliance rates are equal to participation rates. Other standards are implemented on the product, process, or plant levels, like the ISO 9000 and the Global Reporting Initiative. In these cases, participation might not automatically lead to compliance, as several qualitative case studies have shown (Hanseth and Bygstad, 2015; Sandholtz, 2012; Vigneau et al., 2015; Wijen, 2014).
The legitimacy of standards is also determined by the extent to which the standards are perceived as justified or credible i.e. input legitimacy (Mena and Palazzo, 2012). Therefore, the standardization organisation needs to convince the other societal actors that their standards are in line with the socially constructed norms to which corporate behaviour is judged (Suchman, 1995, p. 574). In the case of responsible business standards, these socially constructed norms are often represented by government, NGOs, and other civil society groups, which are “portrayed as cultural carriers that disseminate a general model of ‘universalism, individualism, rational voluntaristic authority, progress, and world citizenship’” (Haack et al., 2012, p. 818). In standardizing corporate behaviour in a socially responsible direction, responsible business standards thus also need to balance the motivations and abilities of firms with the demands of the other societal actors affected by the corporate behaviour (Garst et al., 2017). As the world is dynamic, over time, the alignment between societal norms and responsible business standards can be compromised (Garst et al., 2021). This misalignment can be unpredictable when the societal norms change due to new insights on the targeted societal issue or social value to be achieved (Brunsson et al., 2012; Ferraro et al., 2015; Garst et al., 2021).
To maintain both output and input legitimacy of standards, the standard-setter can choose to have a stepwise revision strategy. In this scenario, the societal actors agree at the start with more lenient standards to boost participation and compliance but only under the condition that the standards become stricter over time (Moog et al., 2015). Although the previously mentioned, qualitative case studies have provided valuable insights into organisational compliance behaviour, they do not provide conclusive answers on the relationship between standards’ revisions and compliance. In this article, we will investigate the effectiveness of this stepwise strategy in maintaining output legitimacy of voluntary responsible business standards, by analysing the relationship between standards’ revisions and the compliance behaviour of participating firms.
2.3 Hypothesis development
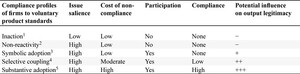
To test the effect of the stepwise revision strategy can maintain compliance with standards and stimulate innovation (Guston, 2008; Stilgoe et al., 2013; Voegtlin and Scherer, 2017), our study focuses on product standards. In contrast to firm-level standards, participation in product standards does not equal compliance: a firm can participate in product standards and have only a few products certified. The number of certified products is thus an indicator of compliance (Brunsson and Jacobsson, 2002; Oliver, 1991). To characterise the compliance behaviour, five compliance profiles can be identified from the literature (see Table 1) (inspired by Endenich et al., 2022): (1) inaction; (2) non-reactivity; (3) symbolic adoption; (4) selective coupling; (5) substantive adoption (Durand et al., 2019; Endenich et al., 2022; Oliver, 1991; Pache and Santos, 2010, 2021a; Slager et al., 2021). Three conditions are theorized to influence the compliance profile: a) issue salience, b) visibility of non-compliance, and c) costs of non-compliance (Durand et al., 2019). An overview of these profiles and conditions can be found in Table 1.
First, only when the standard addresses a salient issue, does the firm’s management perceive the issue as a priority and consider it relevant to their business (Bundy et al., 2013). In the case of voluntary standards, firms can decide whether to participate or not. A firm’s management only decides to participate if they consider the standardized issue relevant to their business. The management of the firms with the first compliance profile of “inaction” do not see the issue as relevant and would not participate no matter how lenient the standards are. A revision of the standards will not affect the issue salience perceived by management and thus issue salience is out of the scope of our study.
Second, the non-compliance should be visible to stakeholders so they can pressure the firm to comply (DiMaggio and Powell, 1983; Wijen, 2014). Product standards are often connected to a front-of-pack label to communicate to buyers that the product is compliant, like in our investigated case. If the product is no longer compliant after the standard revision, the label will have to be removed from the packaging. Both compliance and non-compliance behaviour are thus visible to external stakeholders. If the firm wants to maintain its compliance levels after standard revision, it will be required to invest in product innovation.
However, this effect will only be seen if the third condition applies: the firm only responds to stakeholder pressure when not responding to the pressures could lead to damage to the firm’s performance and the cost of that damage is higher than the investment needed to comply (Haack et al., 2012; Wijen, 2014). The (perceived) size of this damage is influenced by stakeholder salience: urgent damage claims of stakeholders perceived as powerful and legitimate will more likely be seen by management as relevant (Mitchell et al., 1997; Wood et al., 2021). Revisions of standards can influence the return on investment of maintaining compliance, but how a firm responds to this change is dependent on its compliance profile. Firms in the second compliance profile initially perceived the cost of non-compliance as too low and becoming compliant as not worth the investment. These non-reactive firms can become participants and move to the third compliance profile if the standards become less strict. However, the stepwise revision strategy investigated in this study is aimed at making the standards stricter over time. Firms with a nonreactive profile will likely not join after such standard revision and are not affected by these standard revisions.

A conceptual overview of the multiple compliance profiles in the case of voluntary standards.
Citation: International Food and Agribusiness Management Review 27, 4 (2024) ; 10.22434/ifamr1032
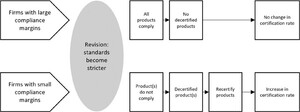
The effect of the stepwise revision strategy is thus likely to be observed in the participating firms, represented by the latter three profiles. To distinguish these groups, the compliance margin can be taken into consideration. With this term, we mean how far within the limits of the standards the participating firms operate. Some firms will make sure that their products are just within the limits, while other firms will push themselves to ensure their products are well within the limits that the standards set (Brunsson and Jacobsson, 2002). Only when standard revision crosses the compliance margin, firms will be faced with the decertification of their products. When the standard revision leads to decertified products, the concerned firms will receive a message from the standard-setter to remove the label from their products or invest in product innovation to maintain compliance. The firms that only symbolically adopt, will perceive the issue as salient but also perceive the potential damage of non-compliance as low (Bundy et al., 2013; Oliver, 1991). Firms with this third compliance profile will, thus, perceive such investments as too high compared to the cost of non-compliance and will decrease their compliance rates.
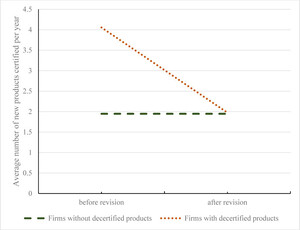
The objective of the stepwise revision strategy to stimulate innovation is thus targeted at the last two compliance profiles. Firms with selective coupling or substantive adoption perceive the cost of non-compliance as moderate or high (Pache and Santos, 2010, 2021b; Slager et al., 2021). When the management of these firms receives signals of decertification, they will want to avoid non-compliance, increase their investment in product innovation and get their products re-certified to maintain compliance. This re-certification will lead to a higher certification rate after the revision. See Figure 1 for a visual representation of this relation. Based on this discussion, the following hypothesis is formed:
Visual representation of the Hypothesis where the standard revisions lead to decertified products, which lead to an increase in certification rates.
Citation: International Food and Agribusiness Management Review 27, 4 (2024) ; 10.22434/ifamr1032
Hypothesis: Firms with decertified products will have a significantly higher certification rate after the standards’ revisions compared to the firms that experience no decertified products.
3. Methodology
3.1 Case description
To investigate the effect of standards’ revision on input and output legitimacy, we use data from the Dutch Choices Programme (Choices), a self-regulation programme of food firms active in the Dutch market. In acting upon the long-term health effects of food products, standardization is very common in the food industry. Previous studies on the effectiveness of these standards have been undertaken (Buttriss, 2013; Dean et al., 2014; Knai et al., 2015; Sharma et al., 2010; Trieu et al., 2015), but the wide variety of standardization practices available — e.g. pledges for healthier products, industry-wide nutrition targets, and front-of-pack health labels — clouds clear conclusions.
Choices was launched in May 2006 by three multinational food manufacturers (Scholtens, 2006). The Choices standards governed a front-of-pack health label, which signalled which products complied with nutritional standards specified per product category (e.g. bread, dairy, vegetables). As they standardize the composition of products of food firms concerning the products’ contribution to consumer health, the Choices standards are non-technical, outcome standards. The product standards were formally authored by a Scientific Committee with representatives from academia and government (Dutch Choices Foundation, 2018b), classifying them as de jure standards (Brunsson et al., 2012). The board of the Dutch Choices Foundation governing the standards consisted of representatives of the member firms with an independent chair. Membership of Choices was voluntary and the member firms themselves determined which and how many products they submitted for certification.
The programme was endorsed by the Dutch National Government and from 2011 onwards was the only front-of-pack health label allowed on food packaging in the Dutch market. In 2015 — just after a new version of the standards was introduced — a public debate about the legitimacy of the label started. In response, the Dutch Ministry of Health decided to reevaluate its endorsement of the label. In October 2016, the Ministry of Health officially retracted its support (Voedingsbeleid; Brief Regering; Uitfasering Vinkje, Innovatie En Communicatie over Gezonde Voeding, 2017). Due to EU regulation (European Parliament & Council, 2006), without that endorsement, the Choices label was no longer allowed to be used in the Dutch market and the firms were given until 2018 to remove the label from their packaging. The Choices Foundation was officially liquidated in October 2018 (Dutch Choices Foundation, 2018a).
3.2 Sample and data collection
Our database was built from multiple sources obtained through the Choices Foundation and triangulated with data from the member firms’ websites. Our dataset contains three levels.
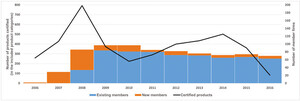
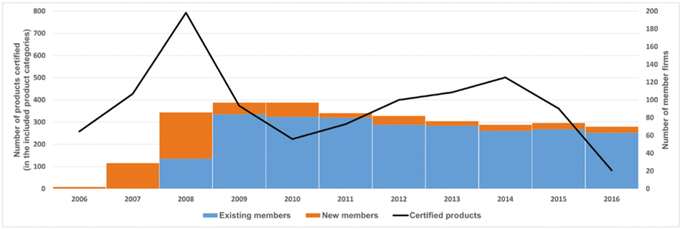
First, at the firm level, data on the membership and the firms’ characteristics were obtained from the membership registry of the Choices Foundation. Figure 2 shows how the membership of the Choices Foundation evolved from the start year 2006 until our final sample year 2015. Since many of the firms in our sample were small or medium-sized and privately owned, data on financial performance (e.g. total assets, return-on-assets) or product innovation (e.g. R&D budgets) were not available in the regular databases. Information on firm size and type was thus obtained from the registry of Choices membership fees. These fees were set annually determined by the revenues and type of firms, which contained six categories: three revenue categories for food product producers and three revenue categories for retailers (see Table 2 for definitions of categories). Data of caterers were excluded from the dataset, as this data was not systematically collected by the Foundation. To analyse the compliance behaviour before and after the revision of 2010, our sample focused on the firms that were a member at least one year before the revision and at least one year after the revision. In total, 76 firms were included in our sample.
Graph of the number of members of the Choices Foundation and the number of products certified in our sample.
Citation: International Food and Agribusiness Management Review 27, 4 (2024) ; 10.22434/ifamr1032
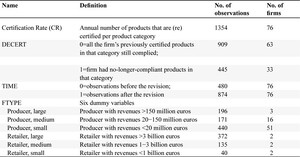
Definitions of the variables used in the analysis.
Citation: International Food and Agribusiness Management Review 27, 4 (2024) ; 10.22434/ifamr1032
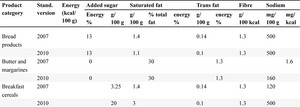
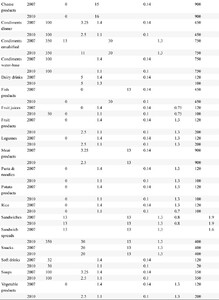
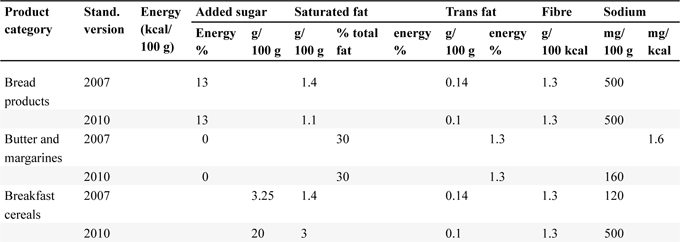
Second, the standards divided the products into 22 product categories each was assigned a standard level for up to six nutritional criteria (i.e. energy, added sugar, saturated fat, trans fat, fibre, and sodium). Five of these nutrients are seen as negative to human health and receive a maximum level. As fibre is seen as positive for human health, this nutrient received a minimum level. The Choices standards were revised three times: in 2007, 2010, and 2015. In this paper, we focus on the revision of 2010 with new standards published in July 2010. For the 2007 revision, the changes were only minimal and too few firms were participating in 2006 to get a large enough sample size before the revision. While the label was officially used on the Dutch market until 2018, data collection ended by the end of 2015. Between the launch of the new standards in Q2 of 2015 and the retraction of the support by the Ministry in Q3 of 2016, only a small number of products were certified using the new 2015 standards. Therefore, no representative sample after the revision of 2015 could be obtained. Using the officially published version of the standards, product-category level data on the allowed amount per nutrient were obtained for the 2007 and 2010 versions of the standards, which can be found in Table A1 in the Appendix.
Third, at the product level, data on the certified products and their composition was obtained through the Choices product database, containing the majority of the products certified by food producers and retailers. Total number of certified products in our sample is 3577.
The data from the three levels were aggregated into a dataset of 1354 firm-category-year observations. As the standards were revised on the product category level, the effects of the revisions can impact the firm’s certification rate differently per product category. Therefore, our observation unit was firm-category-year combinations i.e. observation i was the certification rate of firm j in product category k in year t.
During the data analysis, the research team kept close contact with the Choices Foundation to ensure any missing or ambiguous data was correctly interpreted. To interpret the results, the research team did a scan of news articles about the label published during the sample period. Additionally, interviews were held with eight member firms to understand their motives and internal procedures for certification.
3.3 Variables and analyses
To measure the compliance behaviour per firm, the annual number of new product certifications per product category was selected as a dependent variable: Certification Rate (CR). To take into account the dependency between the multiple observations per firm and product category, an ID-variable per firm-category combination was incorporated in the multi-level model as a random intercept (u0jk).
To test the hypotheses, we determined whether products of the firm in a product category lost their certification due to the revision. We compared all product compositions to the 2010 version of the standards. When a product no longer complies with the new standards, the Choices Foundation would inform the firm that this product is decertified, which acts as a signal to the firm that the standards in that category have become stricter and investment is needed to maintain compliance levels. To differentiate between firms, the dummy variable DECERT was created: ‘1’ when the firm had no-longer-compliant and thus decertified products in that product category; ‘0’ when all the firm’s previously certified products in that category still complied.
To measure the difference in certification rates before and after the standards’ revision, the dummy variable TIME was created: ‘0’ for the period before the revision and ‘1’ for the period after the revision. To test our hypotheses, an interaction variable of DECERT*TIME was added.
To control for R&D capacity, the model contains a variable for firm size and type (FTYPE) in the form of five dummy variables for the five firm categories and the category ‘Producer, large’ as the base category. We use these six categories as indicators for R&D capacity. Assuming that firms with larger revenue streams have larger R&D capacity and R&D capacity for product innovation of the producers is relatively higher than that of the retailers, we expect that in our sample the large producers have the highest R&D capacity.
The following model is used to test our hypotheses:
CRi = (β0 + u0jk) + β1(DECERTi) + β2(TIMEi) + β3 (DECERTi * TIMEi) + β4(FTYPEj) + εi (1)
Where CR is the product certification rate, DECERT is a dummy with 1 indicating firms with decertified products after standards’ revision, TIME is a dummy with 1 indicating the period after the standards’ revision, FTYPE is a set of dummy variables for six firm type categories.
For our Hypothesis, we are interested in β3, which we expect to be positive, meaning that firms with decertified products (DECERT=1) after the revisions (TIME=1) will increase their certification rates (CR). Definitions of the variables used in the analysis are given in Table 2.
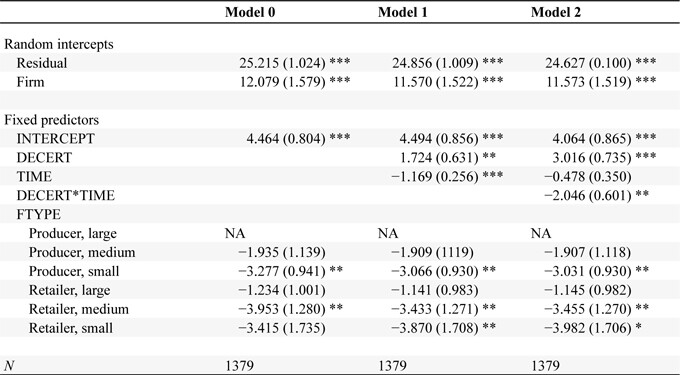
The analysis was conducted in SPSS using the mixed model setting for multi-level regressions. To control for influential observations, the Cook’s distances, Mahalanobis distances and leverage values were calculated, and the analysis was run with and without outliers of three standard deviations for CR. The Cook’s distances, Mahalanobis distances and leverage values showed no reasons for concern for influential observations. Concerning the outliers, the results presented below exclude outliers for CR. For results including outliers, see Table A2 in the Appendix. To assess the fit of the model, Akaike’s Information Criterion (AIC) with chi-square distribution was used, as recommended by Field (2013) for multi-level models.
4. Results
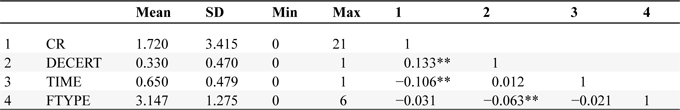
To explain the differences between firms, the firm-category observations with no longer compliant products (DECERT=1) will be named the decertified group, while the firm-category observations of which all products still complied (DECERT=0) after the standards’ revisions will be named the control group. Table 3 reports the univariate statistics and correlations for the variables used in the analysis. Figure 3 depicts the averages of the certification rates for the decertified group and control group for each year. Table 4 and Figure 4 present the findings of the multilevel regression, including the statistics concerning model fit. Table 5 shows the average certification rates per firm type, divided over the two groups.
Correlations and descriptive statistics for dependent and independent variables;
Citation: International Food and Agribusiness Management Review 27, 4 (2024) ; 10.22434/ifamr1032
Graph of the annual certification rate for the control group (all products complied after revisions) and the decertified group (one or more products were no longer compliant after revisions). To account for the overlap period of the old and new standards, the year 2009 includes products certified in 2010 and 2011 under the old standards.
Citation: International Food and Agribusiness Management Review 27, 4 (2024) ; 10.22434/ifamr1032
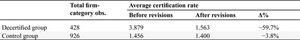
Before running statistical analyses, we first explored general differences between the decertified group and the control group, which can be seen in Tables 3 and 4. The decertified group counted 428 firm-category observations over the years (31.6% of full sample). When comparing the compliance behaviour of this group before and after the revision, the average certification rate of this group decreased with 59.7%. In comparison, the control group with 926 firm-category observations (68.4% of full sample) showed a decrease in certification rate of only 3.8% after the revision. Table 4 and Figure 3 — presenting the average certification rate per year of each group — provide the first indications of differences between the two groups. Before the standards’ revisions in 2010, the decertified group showed a much higher average certification rate than the control group. A possible explanation might have been that the firms in the decertified group were more motivated to be compliant and therefore had more products certified, but the certification rates after the revisions tell a different story. The total number of products certified by the decertified group is lower after the revisions, while the total number of products certified by the control group is higher after the revisions. Furthermore, after the revisions, both groups show a decrease in the certification rate. The decrease in the intervention group is much larger compared to the control group. The average certification rates of firms faced with decertified products are thus lower in the year after the revisions than before the revisions.
Descriptive statistics of sample per group (DECERT)
Citation: International Food and Agribusiness Management Review 27, 4 (2024) ; 10.22434/ifamr1032
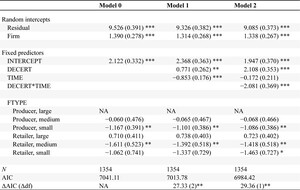
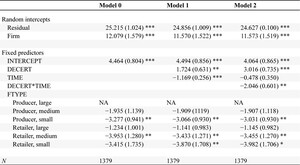
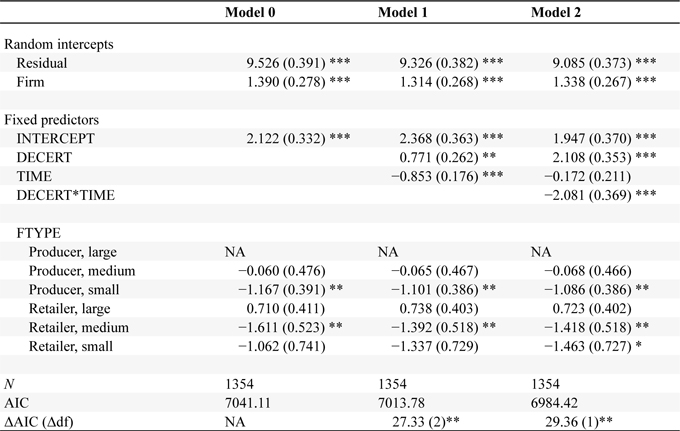
After the decrease in 2010, the certification rates of both groups slowly increased. While the control group reaches its pre-revisions certification rate, the decertified group never returns to the high certification rates from before the revisions. The differences between the two groups are confirmed in the multilevel analyses. In Table 5, the tested models are presented with Model 2 including all variables, the interaction variable DECERT*TIME, and a random intercept for the firm-category ID variable. This Model 2 shows a significantly better model fit than Model 0 and 1 (p<0.01) and better than an alternative model without a random intercept (not displayed,
Results of the multilevel analysis with independent variable Certification Rate
Citation: International Food and Agribusiness Management Review 27, 4 (2024) ; 10.22434/ifamr1032
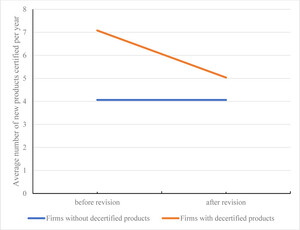
Graph depicting results of Model 2: the average annual certification rate for the control group and the intervention group before and after revisions (excl. control variables).
Citation: International Food and Agribusiness Management Review 27, 4 (2024) ; 10.22434/ifamr1032
Our results indicate that the revisions had a negative effect on the certification rates of the firms that were confronted with decertified products in the respective product category due to the new standards. In the decertified group, the results show clearly that the lenient standards before the revisions motivated them to submit more products in that category. However, this high level of compliance at the start did not guarantee long-term commitment to high compliance, as after the stricter standards the average certification rate dropped to the same level as the other categories. Therefore, any benefit of more lenient standards at the start is negated by de-certifications due to stricter standards and lower certification rates in the years after these revisions.
Table 6 was drawn up to investigate whether these effects were similar across firm types. The results indicate that for all categories, the decertified group show a larger decrease in certification rates than the firm-category observations without decertified products. This decrease seems to be the largest for small and medium retailers, who stopped submitting products in product categories in which they were faced with no longer compliant products due to the new standards. For small retailers, a similar decrease is also seen in the categories in which all products still complied. This would indicate that the small retailers decreased their compliance in general and were thus less committed to the standards in the period after the new standards. For the medium retailers, the certification rates were low in both periods and thus the commitment to the standards was low, to begin with.
Results of the multilevel analysis with independent variable Certification Rate
Citation: International Food and Agribusiness Management Review 27, 4 (2024) ; 10.22434/ifamr1032
Except for the large retailers, all firm types also show a decrease in the product categories in which all products still complied. This decrease can be explained by the initial peek in certifications when joining the programme. When joining the programme, the firm would first go through its existing portfolio to check which products complied with and certify these products. In contrast, large retailers are seen to increase their certification rate in the product categories in which all products still complied. A possible explanation for this increase might be one of their main competitors joining the programme in 2011 (after the 2010 revision so not included in our sample), increasing the pressure for compliance. This pressure, however, only led to an increase in the product categories in which all products still complied.
To check whether the divergent compliance behaviour of the retailers explained the overall effects found, the regression was re-run with only the producers. The results (not displayed) showed no major differences with the original sample: the effects of the variables DECERT, TIME and the interaction between these two variables were still significant and presented the same direction. Only the decrease in certification rates for the decertified group was a bit smaller: the combined effect of variables is −2.30 compared to −2.54 for the original sample.
The differences between firm types indicate that firms can respond differently to standards’ revisions depending on their size and position in the value chain. At the same time, the results confirm that the overall effect of decreasing certification rates when faced with decertified products is consistent across firms.
5. Discussion of the main findings
The present study was conducted to see whether the stepwise revision strategy from lenient to stricter standards is successful in maintaining the output legitimacy of voluntary standards. The results show that lenient standards at the beginning do boost the certification rates and thus the output legitimacy of the standards. However, the initial high compliance does not guarantee compliance after the revisions of the standards. When the standards are made stricter, the firms that are faced with decertified products were seen to significantly decrease their certification rates, rejecting our Hypothesis. The initial positive effect of lenient standards on compliance was thus negated by the decertified products and a decrease in compliance after the revisions.
Why did the stepwise revision strategy not succeed in maintaining the high certification rates present at the start? As we mentioned in our theoretical framework, the compliance rates after revision depend on the compliance profiles of the participating firms (Endenich et al., 2022). If the member firms perceived non-compliance as costly and thus that investment in maintaining compliance rates would outweigh these costs, a positive effect on the certification rate would have been found. Our study results show the opposite effect, letting us believe that several firms were symbolic adopters or at least selective decoupled (Oliver, 1991; Pache and Santos, 2010; Slager et al., 2021), meaning that they were not willing to make the higher investment needed to maintain their compliance rates.
Another possible explanation could be that the non-compliant behaviour was not as visible as assumed with front-of-pack labels (Wijen, 2014). Although the Choices’ standards concerned a visible front-of-pack label, the visibility of the firms’ non-compliance could have been limited because several food firms chose to not participate, including large international brand owners. This meant that on the shelf, non-compliant products could not be distinguished by the consumer from products of non-participating firms. Furthermore, if a product was no longer compliant due to the standards’ revisions, this was not specifically communicated. The compliance behaviour of the individual member firms was not disclosed to the public but also not to their own members. Thus external and internal actors needed to monitor the thousands of certified products before and after the revision and check whether the concerned firms were still participating, to be able to have insight into the compliance behaviour of the individual member firms. Due to this invisibility, coercive pressure for higher compliance of individual firms — normally exerted by civil society or government (Hahn and Albert, 2017; Kourula et al., 2019; Kourula and Laasonen, 2010) — was decreased and the mimetic pressure among firms was fully dependent on the firms’ monitoring of competitor certifications and thus less strong (Heras-Saizarbitoria and Boiral, 2013).
Without the pressure of these stakeholders, the only benefit left for maintaining compliance was possible increased sales. These sales depend on whether consumers favour the certified product over other products or are willing to pay a premium for a certified product. Regarding consumer preference for certified products, the evidence on the effects of front-of-pack health labels on consumer purchase behaviour is inconclusive (Dean et al., 2014). Regarding the premium, a series of so-called ‘price wars’ between the Dutch supermarkets in the last decade have significantly reduced the average product price in the Dutch food industry (Pinckaers, 2016; Schelfaut, 2019). This race to the bottom might have demotivated firms to ask for premium prices. Additionally, the resulting lower margins on products decreased the room for additional investment in product reformulation. Since sales data were not available, we cannot draw any definite conclusions about the damage obtained through decreased sales of decertified products. Even if consumer pressure was present, our findings suggest that the consumer demand on the product level was not a large enough incentive for firms to maintain their compliance rates after the standards became stricter.
5.1 Contribution to the literature
With these findings, we contribute to the literature in two ways. First, our study shows that a stepwise revision strategy for voluntary standards does not always stimulate innovation and investment by firms to maintain their compliance (Guston, 2008; Stilgoe et al., 2013; Voegtlin and Scherer, 2017). Starting with lenient standards can boost compliance at the start, but without clear benefits for maintaining this compliance, the compliance will drop after introducing stricter standards. Without this maintained compliance, the objective of the stepwise strategy — to ensure output legitimacy while at the same time ensuring support from critical societal actors (Botzem and Dobusch, 2012; Mena and Palazzo, 2012) — will not be achieved.
One main condition for such compliance is behavioural visibility, which brings us to our second contribution. In our case, participation and compliance were two separate behaviours: a firm could participate independently of how many of its products complied. This situation allows for symbolic participation (Christmann and Taylor, 2006; Schuler and Christmann, 2011; Wijen, 2014). In this aspect, our case is not an exception. Product-level or process-level certification is a common type of standardization, especially in the field of voluntary responsible business standards (Rasche et al., 2013). Our results show that when compliance is only visible at the product level and not at the firm level, firms tend to not maintain their compliance after stricter standards. As our study did not allow us to compare this scenario with a context in which the firm-level compliance was visible, we propose that this behavioural visibility at the firm level is an important driver for firms to comply with product-level standards. Only transparency on the compliance behaviour of the whole firm allows stakeholders to put pressure and expose symbolic participation or greenwashing. As firms are sensitive to this pressure (DiMaggio and Powell, 1983; Haack et al., 2012), transparency is shown to be important for maintaining the output legitimacy of voluntary standards.
5.2 Implications for practice
Our findings also have implications for practice, especially for policymakers and organisations responsible for voluntary standards. Although voluntary standards have become increasingly popular for governing corporate social responsibilities, their legitimacy is often subject to public debate. In managing this legitimacy, the focus is often on input legitimacy: are the standards developed through a transparent process that includes all necessary stakeholders? This input legitimacy is important, but the output legitimacy should not be forgotten. While the standards in our case study were revised to maintain input legitimacy, the results show that the stricter standards had a negative effect on the compliance of a large part of the affected firms and thus the output legitimacy. This result leads us to two recommendations.
First, until this study, the compliance behaviour of firms participating in the Choices standards was never analysed. Although one aim of these responsible business standards was to stimulate firms to produce healthier products, the effects of the standards on product innovation and general compliance were not measured systematically. We, thus, recommend that policymakers and other stakeholders involved in the development of voluntary standards make clear agreements with the standard-setter on how the compliance behaviour of individual firms will be measured and how the results of these measurements will be communicated. Only with agreement on these measurements and the transparent communication of the results can output legitimacy of the standards be maintained.
Second, when deciding to use a stepwise revision strategy, the standard-setter should first determine what the main incentives are for firms to commit to stricter standards and whether the benefits of compliance with the standards outweigh the costs of behavioural change. This cost-benefit analysis is crucial because while altruistic motives are present in any industry, our current very competitive markets do not allow firms to completely ignore their bottom line.
5.3 Limitations of the study
Before acting upon these implications, however, several limitations of our study need to be taken into account. Our study is built on a single case in a specific context. The generalizability to other contexts might be limited and thus replication studies need to be conducted. These replication studies can also address other limitations of our dataset. First, while the Choices database did register the certification date of a product, the exit date was not consistently recorded. Therefore, products could not be followed over time and we were not able to distinguish new certifications from recertifications, limiting the specificity of our dependent variable. Second, data on the uncertified products in portfolios of member firms or even the relative number of certified products in these portfolios could not be obtained, which limited our ability to more specifically measure the impact of the revisions on the full R&D capacity of the firms. Third, product data of non-member firms was not available over the full sample period. Private databases that collect data on the nutritional composition of food products either started after 2010 or were incomplete. This limitation hindered us from also investigating the reasons for the non-participation of these firms and thus including the other compliance profiles in our study.
Finally, the type of revisions of the investigated product standards caused a limitation, which could also appear in other studies. For revisions, theoretically, three options are possible: (a) the standards become stricter meaning that maximum thresholds are decreased and/or minimum thresholds are increased; (b) the standards stay the same; (c) the standards become less strict meaning that maximum thresholds are increased and/or minimum thresholds are decreased. However, as seen in Table A1 in the Appendix, the Choices standards did not only change in level but also the measurement unit (e.g. for sodium mg/100 g of product to mg/kcal of product). Whether these changes in measurement units would have made the standards stricter or less strict is dependent on the composition of the food product, not allowing us to draw conclusions regarding standard revisions per category. If the measurement units had stayed the same, we could have made a distinction between the types of revisions and used that to further specify our models. In any case, we would still argue to use the decertified products as a variable, as a firm will only receive a signal of standards becoming stricter if their products get decertified.
Acknowledgements
The Dutch Choices Foundation partially financed this study and provided us access to the data. The foundation did not influence the content or outcome of this study or the writing of the article. The three authors declare no potential conflicts of interest concerning the research, authorship, and/or publication of this article. The study in this paper was funded by the NWO (The Netherlands Organisation for Scientific Research), under the grant programme Responsible Innovation (MVI) (grant number: 313-99-302), and the Dutch Choices Foundation. We are grateful for their support.
References
Aragòn-Correa, J.A., A.A. Marcus and D. Vogel. 2020. The effects of mandatory and voluntary regulatory pressures on firms’ environmental strategies: a review and recommendations for future research. Academy of Management Annals 14 (1): 339–365. https://doi.org/10.5465/annals.2018.0014
Arenas, D., L. Albareda and J. Goodman. 2020. Contestation in multi-stakeholder initiatives: enhancing the democratic quality of transnational governance. Business Ethics Quarterly 30 (2): 169–199. https://doi.org/10.1017/beq.2019.29
Boström, M. 2006. Regulatory credibility and authority through inclusiveness: standardization organizations in cases of eco-labelling. Organization 13 (3): 345–367. https://doi.org/10.1177/1350508406063483
Botzem, S. and L. Dobusch. 2012. Standardization cycles: a process perspective on the formation and diffusion of transnational standards. Organization Studies 33 (5–6): 737–762. https://doi.org/10.1177/0170840612443626
Brunsson, N., and B. Jacobsson. 2002. A world of standards. Oxford University Press, Oxford. https://doi.org/10.1093/acprof:oso/9780199256952.001.0001
Brunsson, N., A. Rasche and D. Seidl. 2012. The dynamics of standardization: three perspectives on standards in organization studies. Organization Studies 33(5–6): 613–632. https://doi.org/10./0170840612450120
Bundy, J., C. Shropshire and A.K. Buchholtz. 2013. Strategic cognition and issue salience: toward an explanation of firm responsiveness to stakeholder concerns. Academy of Management Review 38(3): 352–376. https://doi.org/10.5465/amr.2011.0179
Buttriss, J. L. 2013. Food reformulation: the challenges to the food industry. Proceedings of the Nutrition Society 72(1): 61–69. https://doi.org/10.1017/S0029665112002868
Christmann, P. and G. Taylor. 2006. Firm self-regulation through international certifiable standards: Determinants of symbolic versus substantive implementation. Journal of International Business Studies 37 (6): 863–878. https://doi.org/10.1057/palgrave.jibs.8400231
Dangelico, R. M., P. Pontrandolfo and D. Pujari. 2013. Developing sustainable new products in the textile and upholstered furniture industries: role of external integrative capabilities. Journal of Product Innovation Management 30 (4): 642–658. https://doi.org/10.1111/jpim.12013
Dean, M., M. Spence, C. Hodgkins and M.M.M. Raats. 2014. Front-of-pack (FOP) labelling of foods and beverages. In: Berryman, P. (eds.): Advances in Food and Beverage Labelling: Information and Regulations. Woodhead Publishing, Cambridge, pp. 113–131. https://doi.org/10.1533/9781782420934.2.113
DiMaggio, P. J. and W. W. Powell. 1983. The iron cage revisited: institutional isomorphism and collective rationality in organizational fields. American Sociological Review 48 (2): 147–160. https://doi.org/10.2307/2095101
Durand, R., O. Hawn and I. Ioannou. 2019. Willing and Able: A general model of organizational responses to normative pressures. Academy of Management Review 44 (2): 299–320. https://doi.org/10.5465/amr.2016.0107
Dutch Choices Foundation. (2018a). Stichting Ik Kies Bewust wordt opgeheven. Available online at https://www.hetvinkje.nl/nieuws/actueel/stichting-ik-kies-bewust-wordt-opgeheven/
Dutch Choices Foundation. (2018b). Wetenschappelijke commissie. Available online at https://www.hetvinkje.nl/organisatie/wetenschap/
Egyedi, T. M. and K. Blind. 2008. The dynamics of standards. Edward Elgar, Cheltenham.
Endenich, C., R. Hahn, D. Reimsbach and C. Wickert. 2022. Wait-and-see-ism as partial adoption of management practices: The rise and stall of integrated reporting. Strategic Organization 21 (3): 566–595. https://doi.org/10.1177/14761270221078605
European Parliament and European Council. 2006. Regulation (EC) 1924/2006 on nutrition and health claims made on foods. Official Journal of the European Communities L404 (1924): 1–15.
Ferraro, F., D. Etzion and J. Gehman. 2015. Tackling grand challenges pragmatically: robust action revisited. Organization Studies 36 (3): 363–390. https://doi.org/10.1177/0170840614563742
Feunekes, G.I.J., I.A. Gortemaker, A.A. Willems, R. Lion and M. van den Kommer. 2008. Front-of-pack nutrition labelling: Testing effectiveness of different nutrition labelling formats front-of-pack in four European countries. Appetite 50 (1): 57–70. https://doi.org/10.1016/j.appet.2007.05.009
Field, A. 2013. Discovering statistics using IBM SPSS Statistics. SAGE, London.
Flynn, A. and N. Hacking. 2019. Setting standards for a circular economy: a challenge too far for neoliberal environmental governance? Journal of Cleaner Production 212: 1256–1267. https://doi.org/10.1016/j.jclepro.2018.11.257
Garst, J., V. Blok, L. Jansen and O.S.W.F. Omta. 2017. Responsibility versus profit: the motives of food firms for healthy product innovation. Sustainability 9 (12): 2286. https://doi.org/10.3390/su9122286
Garst, J., V. Blok, O. Branzei, L. Jansen and O.S.W.F. Omta. 2021. Toward a value-sensitive absorptive capacity framework: navigating intervalue and intravalue conflicts to answer the societal call for health. Business & Society 60 (6): 1349–1386. https://doi.org/10.1177/0007650319876108
Grinbaum, A. and Groves, C. 2013. What Is “responsible” about responsible innovation? understanding the ethical issues. In: Owen, R., J. Bessant and M. Heintz (eds.), Responsible innovation. Wiley, Hoboken, NJ, pp. 119–142. https://doi.org/10.1002/9781118551424.ch7
Guston, D. H. (2008). Innovation policy: Not just a jumbo shrimp. Nature 454 (7207): 940–941. https://doi.org/10.1038/454940a
Haack, P., D. Schoeneborn and C. Wickert. 2012. Talking the talk, moral entrapment, creeping commitment? exploring narrative dynamics in corporate responsibility standardization. Organization Studies 33 (5–6): 815–845. https://doi.org/10.1177/0170840612443630
Hahn, T. and N. Albert. 2017. Strong reciprocity in consumer boycotts. Journal of Business Ethics 145 (3): 509–524. https://doi.org/10.1007/s10551-015-2870-3
Hanseth, O. and B. Bygstad. 2015. Flexible generification: ICT standardization strategies and service innovation in health care. European Journal of Information Systems 24 (6): 645–663. https://doi.org/10.1057/ejis.2015.1
Heras-Saizarbitoria, I. and O. Boiral. 2013. ISO 9001 and ISO 14001: Towards a research agenda on management system standards. International Journal of Management Reviews 15 (1): 47–65. https://doi.org/10.1111/j.1468-2370.2012.00334.x
Knai, C., M. Petticrew, M.A. Durand, E. Eastmure, L. James, A. Mehrotra, C. Scott and N. Mays. 2015. Has a public-private partnership resulted in action on healthier diets in England? An analysis of the Public Health Responsibility Deal food pledges. Food Policy 54: 1–10. https://doi.org/10.1016/j.foodpol.2015.04.002
Kourula, A. and S. Laasonen. 2010. Nongovernmental organizations in business and society, management, and international business research. Business & Society 49 (1): 35–67. https://doi.org/10.1177/0007650309345282
Kourula, A., J. Moon, M.-L. Salles-Djelic, and C. Wickert. 2019. New roles of government in the governance of business conduct: implications for management and organizational research. Organization Studies 40 (8): 1101–1123. https://doi.org/10.1177/0170840619852142
Levy, D., J. Reinecke and S. Manning. 2016. The political dynamics of sustainable coffee: contested value regimes and the transformation of sustainability. Journal of Management Studies 53 (3): 364–401. https://doi.org/10.1111/joms.12144
Mena, S. and G. Palazzo. 2012. Input and Output Legitimacy of Multi-Stakeholder Initiatives. Business Ethics Quarterly 22 (3): 527–556. https://doi.org/10.5840/beq201222333
Mitchell, R.K., B.R. Agle and D.J. Wood. 1997. Toward a theory of stakeholder identification and salience: defining the principle of who and what really counts. Academy of Management Review 22 (4): 853–886. https://doi.org/10.5465/AMR.1997.9711022105
Moog, S., A. Spicer and S. Böhm. 2015. The politics of multi-stakeholder initiatives: the crisis of the Forest Stewardship Council. Journal of Business Ethics 128 (3): 469–493. https://doi.org/10.1007/s10551-013-2033-3
Oliver, C. 1991. Strategic responses to institutional processes. Academy of Management Review 16 (1): 145–179. https://doi.org/10.5465/amr.1991.4279002
Pache, A. C. and F. Santos, 2010. When worlds collide: The internal dynamics of organizational responses to conflicting institutional demands. Academy of Management Review 35 (3): 455–476. https://doi.org/10.5465/AMR.2010.51142368
Pache, A. C. and F.M. Santos. 2021. When worlds keep on colliding: exploring the consequences of organizational responses to conflicting institutional demands. Academy of Management Review 46 (4): 640–659. https://doi.org/10.5465/amr.2021.0197
Pesch, R., H. Endres and R.B. Bouncken. 2021. Digital product innovation management: balancing stability and fluidity through formalization. Journal of Product Innovation Management 38 (6): 726–744. https://doi.org/10.1111/jpim.12609
Rasche, A., F.G.A. de Bakker and J. Moon. 2013. Complete and partial organizing for corporate social responsibility. Journal of Business Ethics 115 (4): 651–663. https://doi.org/10.1007/s10551-013-1824-x
Reinecke, J., S. Manning and O. von Hagen. 2012. The emergence of a standards market: multiplicity of sustainability standards in the global coffee industry. Organization Studies 33 (5–6): 791–814. https://doi.org/10.1177/0170840612443629
Sandholtz, K.W. 2012. Making standards stick: a theory of coupled vs. decoupled compliance. Organization Studies 33 (5–6): 655–679. https://doi.org/10.1177/0170840612443623
Scherer, A.G. and G. Palazzo. 2011. The new political role of business in a globalized world: a review of a new perspective on CSR and its implications for the firm, governance, and democracy. Journal of Management Studies 48 (4): 899–931. https://doi.org/10.1111/j.1467-6486.2010.00950.x
Scherer, A.G., A. Rasche, G. Palazzo and A. Spicer. 2016. Managing for political corporate social responsibility: new challenges and directions for PCSR 2.0. Journal of Management Studies 53 (3): 273–298. https://doi.org/10.1111/joms.12203
Scholtens, B. 2006. Bedrijven komen met “gezond-logo” voor voeding. De Volkskrant. Available online at https://advance.lexis.com/api/document?collection=news&id=urn:contentItem:4K16-97S0-TWYV-31SJ-00000-00000&context=1516831
Schuler, D.A. and P. Christmann. 2011. The effectiveness of market-based social governance schemes: the case of fair trade coffee. Business Ethics Quarterly 21 (1): 133–156. https://doi.org/10.5840/beq20112116
Sharma, L.L., S.P. Teret and K.D. Brownell. 2010. The food industry and self-regulation: Standards to promote success and to avoid public health failures. American Journal of Public Health 100 (2): 240–246. https://doi.org/10.2105/AJPH.2009.160960
Slager, R., J.P. Gond and D. Crilly. 2021. Reactivity to sustainability metrics: a configurational study of motivation and capacity. Business Ethics Quarterly 31 (2): 275–307. https://doi.org/10.1017/beq.2020.20
Slager, R., J.P. Gond and J. Moon. 2012. Standardization as institutional work: the regulatory power of a responsible investment standard. Organization Studies 33 (5–6): 763–790. https://doi.org/10.1177/0170840612443628
Stilgoe, J., R. Owen and P. Macnaghten. 2013. Developing a framework for responsible innovation. Research Policy 42 (9): 1568–1580. https://doi.org/10.1016/j.respol.2013.05.008
Stubbs, W. 2017. Sustainable entrepreneurship and B Corps. Business Strategy and the Environment 26 (3): 331–344. https://doi.org/10.1002/bse.1920
Timmermans, S. and S. Epstein, 2010. A world of standards but not a standard world: toward a sociology of standards and standardization. Annual Review of Sociology 36 (1): 69–89. https://doi.org/10.1146/annurev.soc.012809.102629
Trieu, K., B. Neal, C. Hawkes, E. Dunford, N. Campbell, R. Rodriguez-Fernandez, B. Legetic, L. McLaren, A. Barberio and J. Webster. 2015. Salt reduction initiatives around the world — a systematic review of progress towards the global target. PLoS ONE 10 (7): e0130247. https://doi.org/10.1371/journal.pone.0130247
van den Ende, J., G. van de Kaa, S. den Uijl and H.J. de Vries. 2012. the paradox of standard flexibility: the effects of co-evolution between standard and interorganizational network. Organization Studies 33 (5–6): 705–736. https://doi.org/10.1177/0170840612443625
Van Kleef, E. and H. Dagevos. 2015. The growing role of front-of-pack nutrition profile labeling: a consumer perspective on key issues and controversies. Critical Reviews in Food Science and Nutrition 55 (3): 291–303. https://doi.org/10.1080/10408398.2011.653018
Vigneau, L., M. Humphreys and J. Moon. 2015. How Do Firms Comply with International Sustainability Standards? Processes and Consequences of Adopting the Global Reporting Initiative. Journal of Business Ethics 131 (2): 469–486. https://doi.org/10.1007/s10551-014-2278-5
Voedingsbeleid; Brief Regering; Uitfasering Vinkje, Innovatie En Communicatie over Gezonde Voeding, Pub. L. No. kst-31532, 2017 184. 2017. Kamerstuk. Available online at https://www.ndfr.nl/content/kst-31532-31184
Voegtlin, C. and A.G. Scherer. 2017. Responsible innovation and the innovation of responsibility: governing sustainable development in a globalized world. Journal of Business Ethics 143 (2): 227–243. https://doi.org/10.1007/s10551-015-2769-z
Wijen, F. 2014. Means versus ends in opaque institutional fields: trading off compliance and achievement in sustainability standard adoption. Academy of Management Review 39 (3): 302–323. https://doi.org/10.5465/amr.2012.0218
Wood, D.J., R.K. Mitchell, B.R. Agle and L.M. Bryan. 2021. Stakeholder identification and salience after 20 years: progress, problems, and prospects. Business & Society 60 (1): 196–245. https://doi.org/10.1177/0007650318816522
Appendix A: A1. Product standards of the Choices front-of-pack health label for food products
Standards of the Choices programme per product category
Citation: International Food and Agribusiness Management Review 27, 4 (2024) ; 10.22434/ifamr1032
A2. Multilevel model with outliers
Results of the multilevel analysis including outliers (dependent variable: Certification Rate)
Citation: International Food and Agribusiness Management Review 27, 4 (2024) ; 10.22434/ifamr1032
Graph depicting results of Model 2* with outliers: the average annual certification rate for the control group and the intervention group before and after revisions (excl. control variables).
Citation: International Food and Agribusiness Management Review 27, 4 (2024) ; 10.22434/ifamr1032
Corresponding author:
Please note that while the food label was on the market until 2018, our sample stops at 2015. The collection of data stopped because in 2015 just after a new version of the standards were introduced, a public debate about the legitimacy of the label started. In response, the Dutch Ministry of Health decided to reevaluate their support to the label and in 2016 decided to withdraw that support. The firms were given until 2018 to remove the label from their packaging. After the debate in 2015 started, only a very small number of products were newly certified and from 2016 all data collection was stopped.
In this paper, we define compliance as developing products that meet voluntary standards, following similar uses of the concept by Oliver (1991) and Pache and Santos (2010). Our use of compliance is in contrast to the definition used by Durand et al (2019), who refer to compliance only in meeting mandatory standards set in hard laws.


