Abstract
Type-2 diabetes mellitus (T2DM) is associated with a reduction of butyrate-producing gut bacteria. d-allulose and erythritol are low-no-calorie sweeteners (LNCS) used as sugar substitutes to reduce high free sugar intakes associated with non-communicable diseases, including T2DM. This is the first study to investigate the impact of representative and physiologically relevant doses of d-allulose and erythritol on the human gut microbiota of T2DM (
1 Introduction
Type-2 diabetes mellitus (T2DM) is a global public health issue, with considerable negative impact on quality of life and health expenditure. Modifiable risk factors are often targeted in the management of T2DM such as diet, physical activity, alcohol, and smoking (Kolb and Martin, 2017; Zhang et al., 2020). More recently, the gut microbiota, and specifically butyrate-producing gut microbiota, has been associated with the pathophysiology of T2DM (Cunningham et al., 2021; Gurung et al., 2020). A consistent finding observed in multiple cohorts across various geographical locations is the reduction of butyrate-producing bacteria in individuals with T2DM (Chen et al., 2021; Karlsson et al., 2013; Larsen et al., 2010; Qin et al., 2012). Butyrate, along with other short-chain fatty acids (SCFAs) like acetate and propionate, is produced through the fermentation of unabsorbed food components by the microbiota in the large intestine and exerts several beneficial effects on the host such as improved gut barrier integrity, glucose homeostasis, lipid metabolism, appetite regulation, and immune function (Koh et al., 2016; Morrison and Preston, 2016; Tan et al., 2014).
High free sugar intake is associated with an increased risk of developing various non-communicable diseases, including T2DM (Huang et al., 2023). The World Health Organization (WHO) has recommended reducing the intake of free sugars to <10% of daily energy intake with a further target of <5% of daily energy intake for additional health benefits (WHO, 2015). Achieving such reductions is challenging and will require a multifactorial approach, including reducing portion sizes, promoting healthier dietary choices, and reformulating foods and beverages (Gallagher et al., 2021). Foods contributing most to free sugar intakes are typically packaged and commercially produced foods (Azaïs-Braesco et al., 2017), and therefore product reformulation is an effective strategy to reduce free sugar intakes in line with public health recommendations. Low-no-calorie sweeteners (LNCS) provide sweetness without the addition of appreciable energy and can help maintain the palatability of reformulated products whilst facilitating substantial sugar reduction. Reducing sugar is a complex task as sugar provides many functions including texture, mouthfeel, bulk, colour, flavour, preservative, and humectancy (Cooper, 2017). LNCS can replace some of the functions of sugars, but there may remain some practical challenges to reproduce a broad range of other qualities, like the texture of the full-sugar products. The increased range of available LNCS is a useful tool in product reformulation as LNCS can be used synergistically in blends to achieve the desired sensory profile (Jang et al., 2021). As many different LNCS exist, with diverse physical and caloric compositions, sensory properties, and pharmacokinetics, it is important to examine individual LNCS to gain insights into their compound-specific effects on the host (Van den Abbeele et al., 2023a).
Among the different types of LNCS, are the sweeteners erythritol (a polyol) and d-allulose (a rare sugar). Both erythritol and d-Allulose are suitable alternatives to sucrose, with a relative sweetness of 70% (Moon et al., 2010; Zhang et al., 2023), very low energy densities (d-allulose: 0.4 kcal/g, erythritol: 0 kcal/g; US Food and Drug Administration (FDA), 2020, Code of Federal Regulations, 2024), specific functionalities such as adding bulk and texture (Bolger et al., 2021; Grembecka, 2015), while demonstrating good tolerability in both adults and children (Han et al., 2018; Jacqz-Aigrain et al., 2015; Risso et al., 2024; Storey et al., 2007). Acute intake of d-allulose and erythritol does not increase blood glucose and insulin concentrations (Ishikawa et al. 1996; Iida et al., 2008; Teysseire et al., 2023). Moreover, adding d-allulose to sucrose lowers the peak rise in glucose and insulin compared with sucrose alone (Au-Yeung et al., 2023). Witkowski and Nemet et al. (2023) demonstrated that higher blood erythritol concentrations were associated with an increased risk of major adverse cardiovascular events in adults with high prevalence of cardiovascular disease and risk factors. However, important confounders were not accounted for in the analysis including participants’ ethnicity, socio-economic status, alcohol consumption and their diet. Blending erythritol and d-allulose increases sweetness synergism and positive sensory properties combined with minimal off-notes such as bitterness and astringency (Jang et al., 2021). d-allulose and erythritol are designated as “generally recognized as safe” (GRAS) by the FDA, and erythritol is an authorized food additive in the European Union following safety evaluations by the European Food Safety Authority (EFSA), demonstrating their safety as food and drink ingredients (EFSA, 2015, 2023; FDA, 2001, 2011).
There are numerous studies on the effects of LNCS on the gut microbiota, which have demonstrated differential effects according to the type of LNCS (Conz et al., 2023; Plaza-Diaz et al., 2020; Ruiz-Ojeda et al., 2019; Van den Abbeele et al., 2023a). However, very few studies have examined the effect of d-allulose and erythritol on the human gut microbiota. Moreover, no study has included individuals with T2DM who may demonstrate a different gut microbiota response to d-allulose and erythritol due to compositional changes in the gut microbiota compared to healthy individuals. Previous studies on d-allulose and erythritol and the gut microbiota have largely used animal models or in vitro single-strain cultures which are less relevant to the human gut microbiota (Han et al., 2020a–c; Iida et al., 2010; Matsuo et al., 2003; Rugji et al., 2022). To our knowledge, only three published studies have examined the effect of erythritol on human gut microbiota using in vitro models (Arrigoni et al., 2005; Hiele et al. 1993; Mahalak et al., 2020), and there are no published studies on the effect of d-allulose on human gut microbiota. The reported findings from these in vitro studies are conflicting, which may be due to methodological heterogeneity. The in vitro studies also have methodological limitations including short-term (<24 h) batch fermentation models that are less representative of human physiological conditions (Pérez-Burillo et al., 2021) or pooled human faecal samples for inoculum thereby eliminating interpersonal variation (Aguirre et al., 2014; Van den Abbeele et al., 2023b). Previous in vitro studies have used a wide variation of test doses and do not report a rationale for dose selection such as average dietary intakes, usage levels, acceptable daily intakes, and gastrointestinal tolerance. Moreover, the in vitro studies do not adjust the dose based on absorption levels in the upper gastrointestinal tract (GIT), which may provide physiologically irrelevant dosages.
To address the limitations and gaps in the evidence base, this study is the first study to investigate the impact of representative and physiologically relevant doses of d-allulose and erythritol on the human gut microbiota and metabolite production in adults with T2DM and co-living healthy adults using the ex vivo Systemic Intestinal Fermentation Research (SIFR®) technology. This SIFR® is validated, such that it predicts in vivo responses of the microbial community to dietary modulation in human clinical trials (down to species level) due to its accurate preservation of in vivo-derived microbiota (Van den Abbeele et al., 2023b).
2 Material and methods
LNCS: type and dose
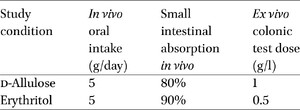
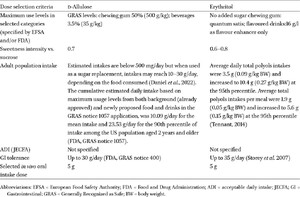
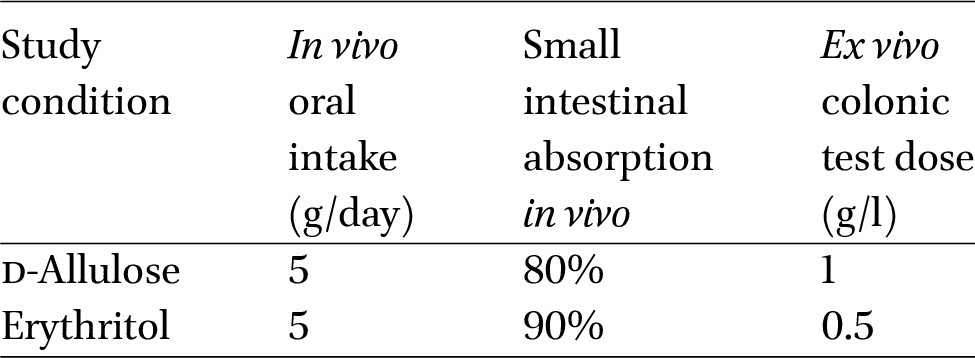
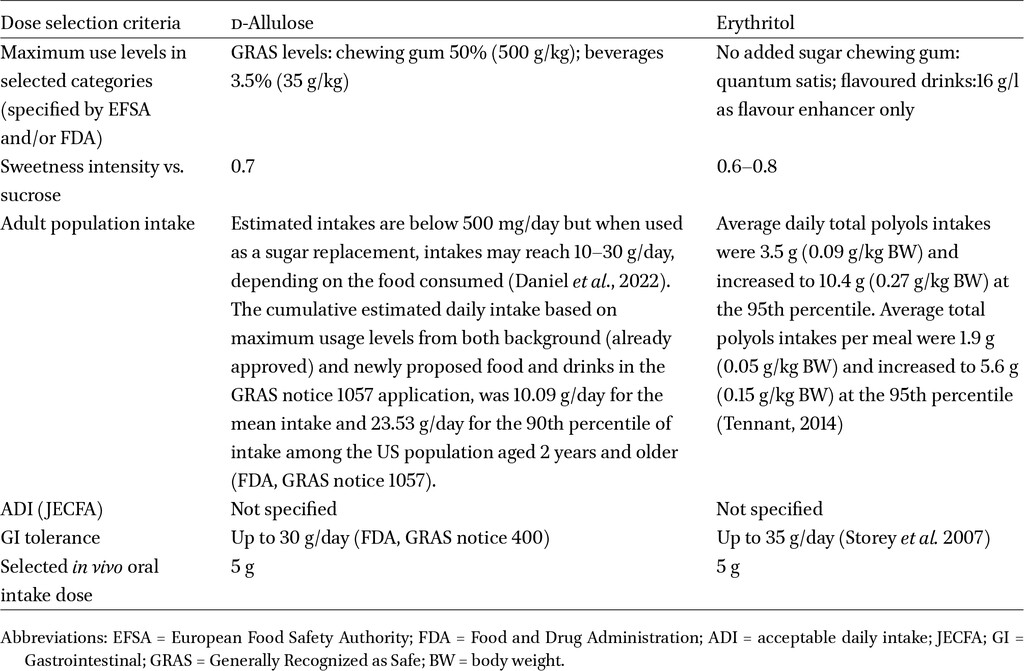
This study is a follow-up of an earlier study that examined the effect of a broad spectrum of LNCS (Van den Abbeele et al., 2023a). Two additional LNCS were examined in this study: d-allulose and erythritol, in comparison to a no-substrate control (NSC). d-allulose (DOLCIA PRIMA®) and erythritol (ERYTESSE™) were obtained from Tate & Lyle PLC. Dose selection was based on a literature review performed prior to the study to identify in vivo and ex vivo test doses that are representative of real-world usage and intake and were physiologically relevant. To identify the in vivo oral intake dose (g/d), the following criteria were considered: maximum use levels set by ESFA and FDA, adult estimated daily intake, acceptable daily intake (Joint FAO/WHO Expert Committee on Food Additives), and gastrointestinal tolerance (Table A1 in the Appendix). Therefore, representative in vivo oral intakes were selected (g/day; Table 1). The in vivo oral intake dose was adjusted for the portion of d-allulose and erythritol absorbed in the upper GIT to calculate the proportion of the oral intake dose that reaches the colon. This adjustment determined the ex vivo colonic test dose used in the colonic incubations, as shown in Table 1. For d-allulose, previous studies indicate urinary excretion rates ranging from 66-86% after ingestion of doses between 5-20 g/day (Iida et al., 2010; Williamson et al., 2014). Accordingly, this study assumed that 80% of d-allulose is absorbed in the upper GIT, resulting in, 20% reaching the colon. For erythritol, previous studies indicate urinary excretion rates ranging from 78%-90% after ingestion of doses between 18 g-60 g/day (Noda et al. 1994; Bornet et al. 1996). Toxicokinetic studies included in EFSA’s scientific opinion of the safety of erythritol indicate that 80-90% of an oral dose is eliminated in the urine within 24 h (EFSA, 2015). Thus, the present study assumed that 90% of erythritol is absorbed in the upper GIT, resulting in 10% reaching the colon.

In vivo oral intake dose (g/day), in vivo small intestinal absorption (%), and ex vivo colonic test doses (g/l) for d-allulose and erythritol
Citation: Beneficial Microbes 16, 5 (2025) ; 10.1163/18762891-bja00071
Study design
Digestion in the upper GIT and colonic fermentation of d-allulose and erythritol were examined using the SIFR® model. d-Allulose, erythritol, and water with any test product was exposed to oral, gastric, and small intestinal digestion based on the INFOGEST 2.0 digestion methodology (Brodkorb et al., 2019) with modifications to ensure that this method was compatible with the subsequent colonic fermentation (Van den Abbeele et al., 2023c). Colonic incubations of the NSC, d-allulose, and erythritol were conducted for 12 participants and samples were taken at 0 h (NSC only), 6 h, 24 h and 48 h. For the colonic incubations, the ex vivo colonic dose (1 g/l of d-allulose, 0.5 g/l erythritol) was added as a single dose at baseline (0 h). Colonic incubations followed the same methodology reported by Van den Abbeele et al. (2023a), (2023b) which is reported here in brief. Individual bioreactors were managed simultaneously in a bioreactor management device (Cryptobiotix, Ghent, Belgium). The individual bioreactors had 5 ml of faecal inoculum-nutritional medium blend supplemented with digested d-allulose or erythritol obtained from the small intestinal digestion. Each bioreactor was sealed and subsequently rendered anaerobic. The nutritional medium was prepared using blend M0017 (Cryptobiotix). Following this, the bioreactors were incubated at 37 °C for 48 h under continuous agitation (140 rpm) (MaxQ 6000, Thermo Fisher Scientific, Merelbeke, Belgium). For each donor, a NSC incubation was conducted concurrently to the d-allulose and erythritol incubations. The NSC ensured that differences observed between the NSC and d-allulose and erythritol incubations could be attributed to the presence of d-allulose and erythritol. NSC colonic incubations were run in technical triplicate for quality control (QC). Six biological replicates (=different test subjects) were tested for each donor group in all conditions.
The faecal sample collection process was approved by the University Hospital Ghent Ethics Committee (reference: BC09977). Participants were required to sign an informed consent form and donate their faecal sample for the study. The donor selection criteria were as follows: 25–65 years of age, no gastrointestinal disorders, no probiotic use, no use of antibiotics during the previous 6 months, no smoking, consumption of <3 units/d of alcohol, a body mass index of <30. This study used faecal samples from six pairs of co-living human adults that had a similar diet to reduce the variation in baseline gut microbiota composition caused by different long-term diets (Leeming et al., 2019). From each pair, one donor was diagnosed with T2DM. There were 4 males and 2 females in the healthy donor group and 2 males and 4 females in the group of donors with T2DM.
Fermentation outcomes
Gas pressure was measured in the closed bioreactors. Gas pressure was measured with a custom-developed bioreactor management device (Cryptobiotix) and the full bioreactor content was sampled (5 ml). The gas pressure was measured with a needle that was attached to a pressure meter and was measured in the headspace of the reactor, before liquid sampling. Following this, liquid samples were obtained and analysed. One hundred and twenty samples were analysed (3 study conditions, 12 donors, 3 time points in addition to 0 h samples of the NSC for the 12 donors as the levels of lactate and SCFA were the same at 0 h in the study conditions). Twenty-four samples were also analyzed for QC purposes (2 additional replicates of the NSC at 48 h for each of the 12 donors). This provided a total of
Microbial composition analysis
One hundred and twenty samples were analysed (3 study conditions, 12 donors, 3 time points in addition to 0 h samples of the NSC for the 12 donors as the microbiota composition at 0 h were the same in the study conditions). Abundances (%; shallow shotgun sequencing; Supplementary material, 5.54 M reads per sample (average)) were corrected with total cell counts per sample (cells/ml; flow cytometry) to generate estimated cell counts/ml. A bacterial cell pellet was attained by centrifugation (5 min at
Fermentation kinetics of erythritol and d-allulose
After removing insoluble particles and surfactants present in the faecal fermentation samples, the samples were diluted 11-fold in buffer consisting of 10 mM ammonium formate and 0.1% formic acid. Before analysis, stable isotope-labelled standards were added to the diluted samples. Liquid chromatography–mass spectrometry (LC-MS) was applied on filtered supernatants (0.22 μm filter, stored at −80 °C) to quantify d-allulose and erythritol in the study conditions where they were dosed to understand the time intervals during which they were fermented, following the methodology report by (Van den Abbeele et al., 2023a). There was background detection for d-allulose, such that there was an interference with other hexoses that are part of the background medium (likely fructose). Nevertheless, dosing with d-allulose increased the detection of the metabolite identified as d-allulose/hexose, well above levels of the background medium. Moreover, background hexoses were rapidly fermented within 6 h of incubation in the NSC (see Figure 1A) unlike d-allulose. As the only difference between NSC and d-allulose is the presence of d-allulose, this suggests the specific detection of d-allulose from 6 h onwards. A Thermo Scientific Vanquish UHPLC (Thermo Scientific, Germering, Germany) coupled to an Orbitrap Exploris 240 Mass Spectrometer (Thermo Scientific, Bremen, Germany), with an electrospray ionisation source was used to conduct LC-MS analysis. The analysis was conducted in negative and positive ionisation mode. Ultra-performance liquid chromatography was conducted by employing a modified protocol reported by Doneanu (2011). Compound Discoverer 3.3 (Thermo Scientific) was used for peak area extraction and preprocessing as well as a manual extraction utilizing Skyline 21.1 in-house library (MacCoss Lab Software; Adams et al., 2020). Compounds were identified at different confidence levels: level 1 (accurate mass, retention times, and MS/MS spectra), level 2a (accurate mass and retention times), level 2b (accurate mass and MS/MS spectra) and level 3 (accurate mass). Retention times were compared to authentic in-house standards and accurate mass included an accepted deviation of 3 ppm. A QC sample (pooled aliquots of all samples) was run every mixed injection to verify technical variability.
Statistical analysis
Statistical analyses were conducted using R (www.r-project.org; version 4.2.2). Repeated measures ANOVA analysis (paired testing among the 12 donors) was used to assess statistical differences between d-allulose and erythritol compared to the NSC at each time point (6 h, 24 h, 48 h) on metabolites and microbial taxa and p-values were corrected using the Benjamini-Hochberg method (Benjamini and Hochberg 1995). Three approaches were taken in the microbial composition analysis. Firstly, log10-transformed values were used in the statistical analysis. Secondly, a taxonomic group value less than the limit of detection (LOD) was deemed equal to the overall LOD (Van den Abbeele et al., 2023b). Thirdly, to remove species with a low relative abundance and to prevent extreme p-value corrections, a cut-off was established to retain the 100 most abundant species in the analysis. The inclusion threshold for the 100th species was set at 0.20%, meaning that a species needed to have an average abundance of 0.20% in the samples to be retained among the top 100 species. This same threshold was also applied at the family level. For brevity, treatment effects on microbial families and species at 48 h are reported. Correlations between metabolites and microbial taxa at 48 h were identified using Regularised Canonical Correlation Analysis (rCCA) rCCA was performed using the mixOmics R package and the estimation of penalisation parameters was done using the shrinkage method following a central log-ratio transformation of the microbiota matrix. To generate the correlation matrix, the first three components of the rCCA were used (Rohart et al., 2017; version 6.20.3).
3 Results
Fermentation kinetics of erythritol and d-allulose
LC-MS analysis allowed for the detection of d-allulose and erythritol in the study arms where they were dosed (with a bacterial cell density: 109 cells/ml) to elucidate the fermentation kinetics. Figure 1A and B shows the concentration (peak area) of d-allulose and erythritol respectively at 6, 24 and 48 h for the whole sample. d-Allulose was fermented between 6-24 h. Erythritol was fermented more slowly with a high concentration still evident at 24 h. Erythritol was mostly fermented between 24–48 h by most participants. Erythritol was fermented within 24 h in two healthy participants.
Concentration (peak area) of (A) d-allulose and (B) erythritol at 0 (NSC only) 6, 24, and 48 h of incubation for the whole sample (n = 12) following treatment with erythritol or d-allulose. There was background detection for d-allulose, such that there was an interference with other hexoses that are part of the background medium. H = healthy participants; T2DM = Type 2 diabetic participants; NSC = no-substrate control.
Citation: Beneficial Microbes 16, 5 (2025) ; 10.1163/18762891-bja00071
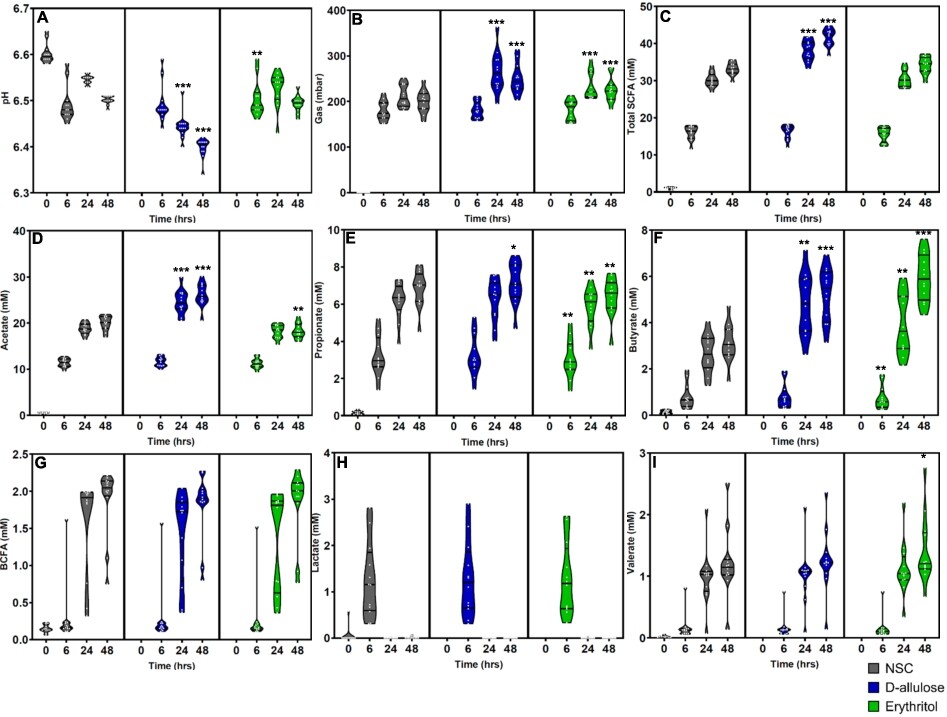
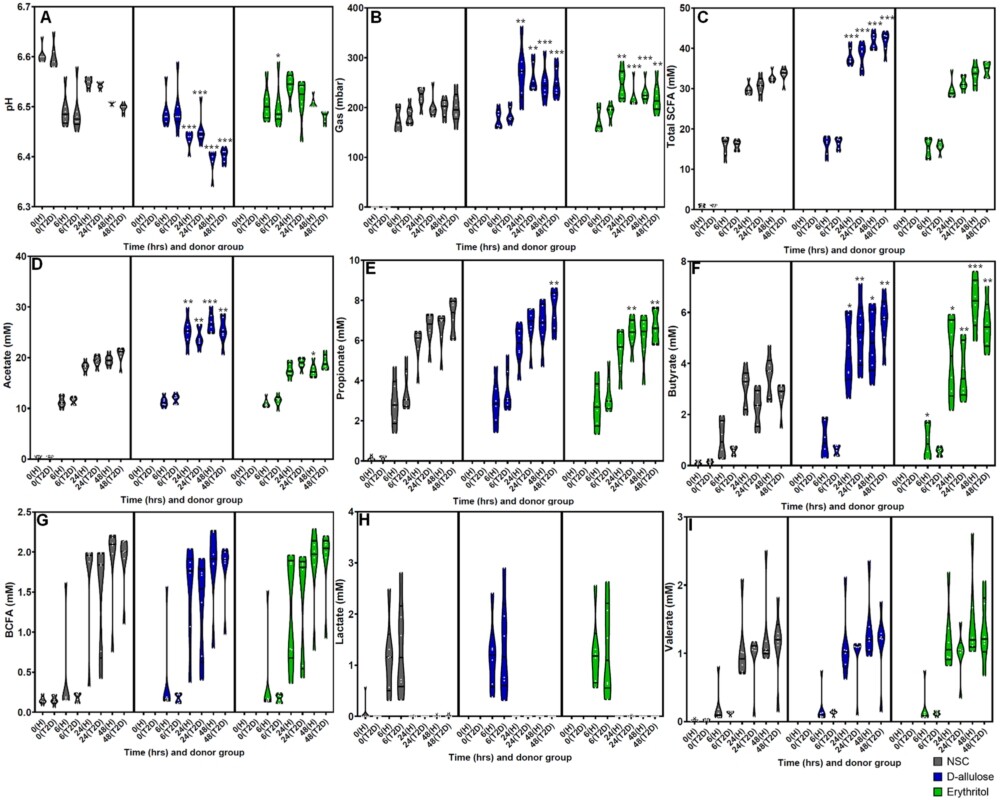
(A) pH, (B) gas (mbar), (C) total SCFAs (mM), (D) acetate (mM), (E) propionate (mM), (F) butyrate (mM), (G) BCFA (mM), (H) lactate (mM), and (I) valerate (mM) levels after 0 (NSC only) 6, 24, and 48 h of incubation with erythritol or d-allulose for the whole sample (n = 12). Statistical differences between test products vs. the NSC are indicated by *(0.01
Citation: Beneficial Microbes 16, 5 (2025) ; 10.1163/18762891-bja00071
Effects of erythritol and d-allulose on fermentation outcomes
The effects of erythritol and d-allulose on fermentation parameters are shown in Figures 2A–I for the whole sample and by donor group in Figure A2 in the Appendix. The whole-sample analysis demonstrated that d-allulose significantly decreased pH, increased gas production, and increased total SCFA production compared to the NSC at 24 and 48 h (Figure 2A–C). The same significant effects were demonstrated in healthy participants and participants with T2DM in the analysis by donor group (Figures A2A–C in the Appendix). There was a significant increase in total SCFAs after d-allulose treatment, which was largely driven by a significant increase in acetate and butyrate production at both 24 and 48 h compared to the NSC in the analysis of the whole sample (Figure 2D,F). These effects of d-allulose on acetate and butyrate were consistent across healthy participants and participants with T2DM in the donor-specific analysis (Figure A2D,F in the Appendix). There was also a significant increase in propionate after d-allulose treatment at 48 h compared to the NSC in the analysis of the whole sample and in participants with T2DM in the analysis by donor group (Figure 2E and Figure A2E in the Appendix).
At 6 h, erythritol treatment resulted in a significant increase in pH compared to the NSC in the whole-sample analysis (Figure 2A) and in participants with T2DM in the donor-specific analysis (Figure A2A in the Appendix). Erythritol significantly increased gas production at 24 and 48 h compared to the NSC in the analysis of the whole sample (Figure 2B), in healthy participants and in participants with T2DM in the analysis by donor group (Figure A2B in the Appendix). Erythritol had no effect on total SCFA concentration at any time point across all analyses (Figure 2C and Figure A2C in the Appendix). However, the analysis of individual SCFAs demonstrated significant effects of erythritol treatment. Similar to the effects of d-allulose treatment, erythritol significantly increased butyrate at 24 and 48 h after treatment compared with the NSC in the whole-sample analysis (Figure 2F). In the donor-specific analysis, the significant increase in butyrate production from erythritol treatment vs. the NSC was consistent across healthy participants and participants with T2DM at 24 h and 48 h (Figure A2F in the Appendix). Acetate production significantly decreased at 48 h following erythritol treatment compared to the NSC in the whole-sample analysis (Figure 2D) and in healthy participants in the donor-specific analysis (Figure A2D in the Appendix). Propionate production significantly decreased at 6, 24, and 48 h following erythritol treatment compared to the NSC in the whole-sample analysis (Figure 2E) and in participants with T2DM in the donor-specific analysis at 24 and 48 h (Figure A2E in the Appendix).
There were no effects of either d-allulose or erythritol treatment on BCFA, lactate, and valerate production across all analyses, excluding a significant increase in valerate at 48 h following erythritol treatment compared to the NSC in the whole-sample analysis (Figure 2G–I and Figure A2G–I in the Appendix).
Effects of erythritol and d-allulose on microbial composition: phylum-, family- and species-level
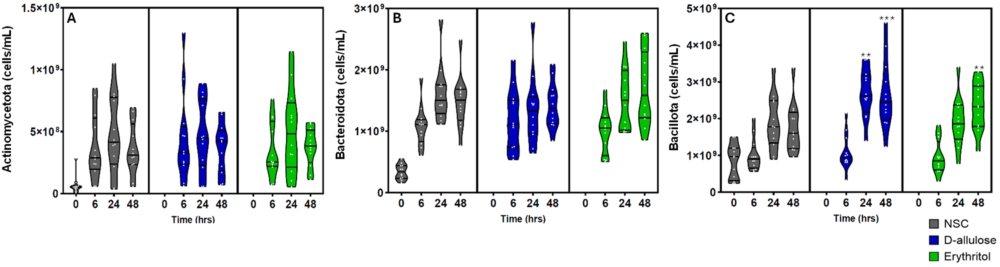
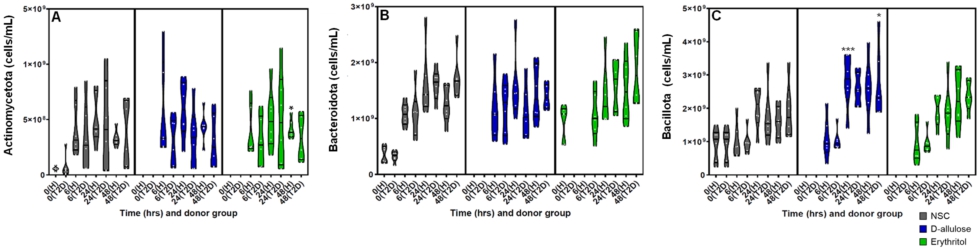
There were three main phyla detected across the adult donors: Actinomycetota, Bacteroidota, and Bacillota. As a result, a targeted analysis was performed for each of these three phyla. At the phylum level, both d-allulose and erythritol significantly increased Bacillota compared with the NSC. d-Allulose significantly increased Bacillota at 24 and 48 h and erythritol significantly increased Bacillota at 48 h compared to the NSC in the whole-sample analysis (Figure A3C in the Appendix). In the analysis by donor group, d-allulose significantly increased Bacillota in healthy participants at 24 h and in participants with T2DM at 48 h compared to the NSC (Figure A3C in the Appendix). In the analysis by donor group, there were no significant effects of erythritol on Bacillota (Figure A4C in the Appendix). There were no effects of d-allulose and erythritol on Actinomycetota and Bacteroidota across all analyses, excluding a significant increase in Actinomycetota following erythritol treatment compared to the NSC at 48 h in healthy participants in the donor-specific analysis (Figures A3A,B and A4A,B in the Appendix).
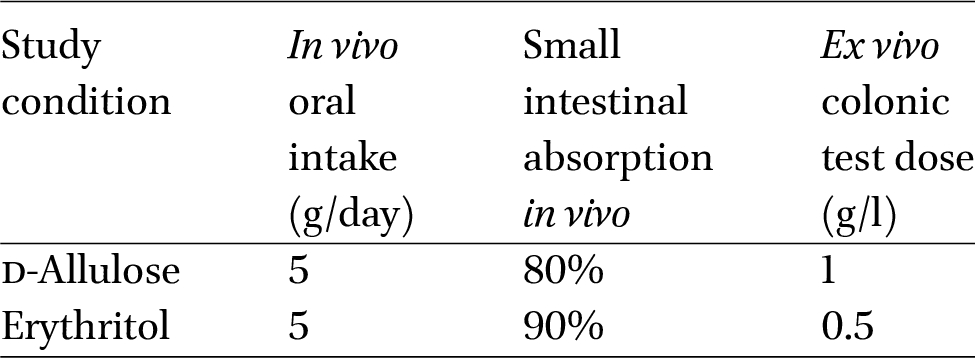
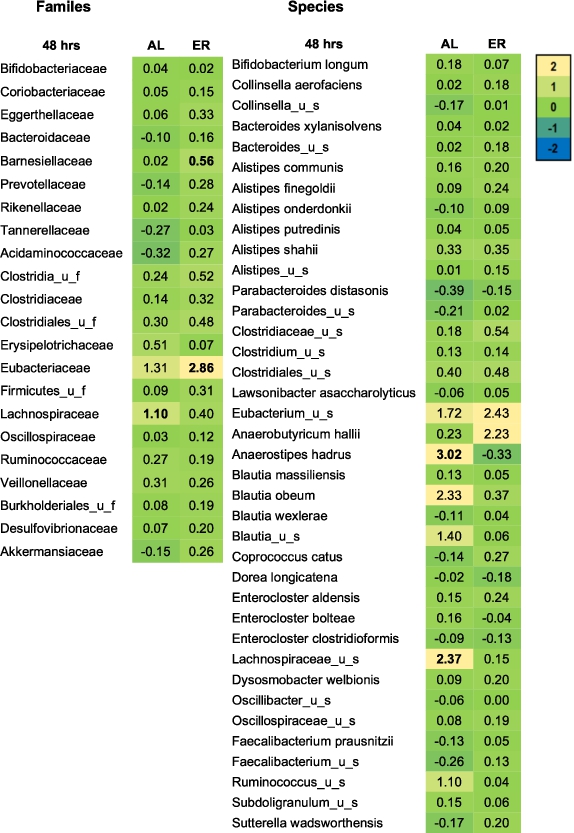
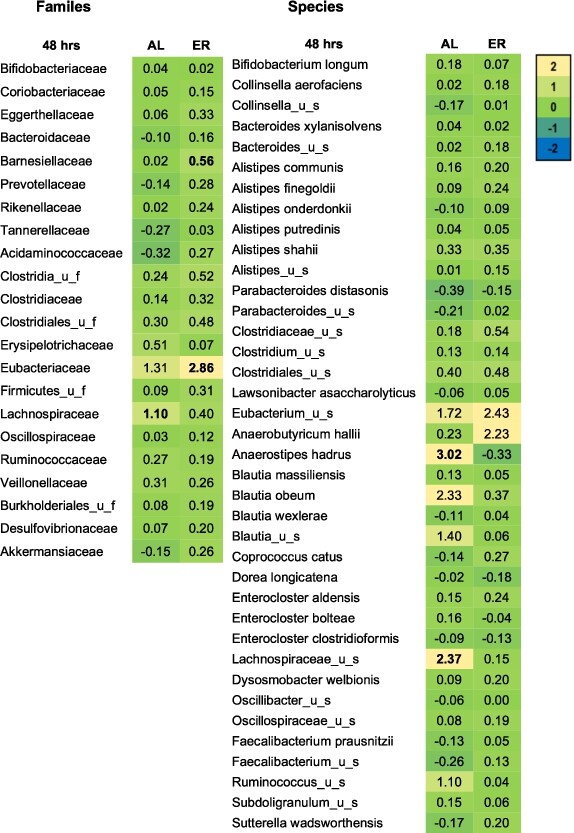
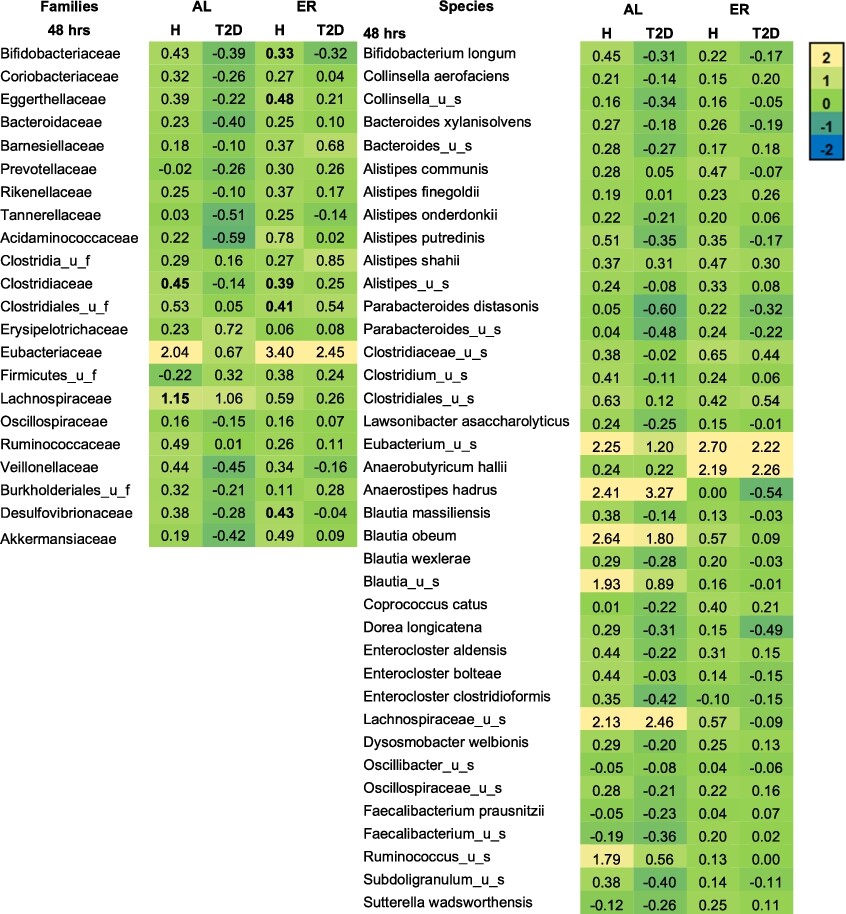
Microbial families and species expressed as log2 (treatment/NSC) that were significantly affected after 48 h of colonic incubations with erythritol or d-allulose compared to the NSC (FDR = 0.10) for the whole sample (n = 12). Significant differences between test products vs. the NSC are indicated in bold. Abbreviations: AL = d-allulose; ER = erythritol; u_f = unclassified family; u_s = unclassified species.
Citation: Beneficial Microbes 16, 5 (2025) ; 10.1163/18762891-bja00071
Figure 3 shows the treatment effects on microbial families and species in the whole-sample analysis at 48 h compared to the NSC. d-allulose significantly increased the Lachnospiraceae family at 48 h in the whole-sample analysis (Figure 3) and in healthy participants in the donor-specific analysis compared to the NSC (Figure A5 in the Appendix). The increase in Lachnospiraceae family at 48 h was due to the specific and significant increase of two species: Anaerostipes hadrus and Lachnospiraceae_ unclassified_species (
Erythritol significantly increased the Eubacteriaceae and Barnesiellaceae families at 48 h in the whole-sample analysis compared to the NSC (Figure 3). In the donor-specific analysis, erythritol also significantly increased Bifidobacteriaceae, Eggerthellaceae, Clostridiaceae, Clostridiales_unclassified_family (
Effects of erythritol and d-allulose on microbial species and related SCFA production
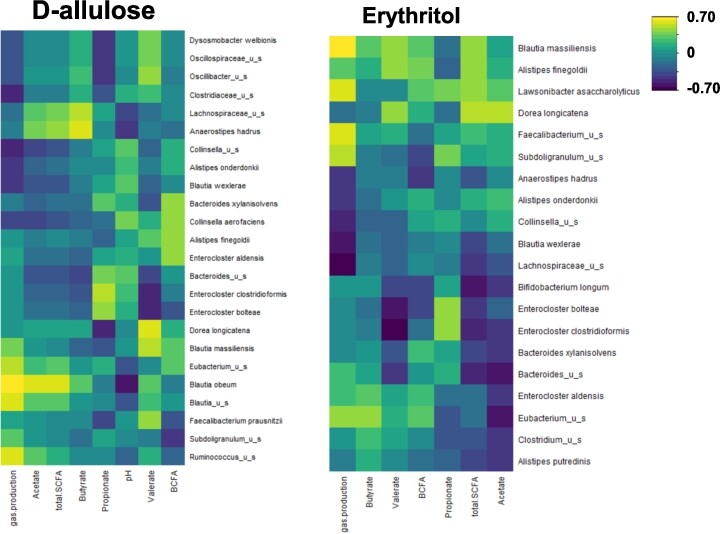
Correlations between fermentation parameters (gas production, SCFA, and BCFA) and microbial composition at 48 h are shown in Figure 4. There was a strong correlation between both Anaerostipes hadrus and Lachnospiraceae_u_s and butyrate production following d-allulose treatment. There was also a marked correlation between Blautia obeum and acetate production following d-allulose treatment. Following erythritol treatment, there was a correlation between Eubacterium_u_s and butyrate production.
Regularized Canonical Correlation Analysis (rCCA) between fermentation parameters (gas production, SCFA and BCFA) and microbial composition at 48 h after treatment with d-allulose or erythritol for the whole sample (
Citation: Beneficial Microbes 16, 5 (2025) ; 10.1163/18762891-bja00071
4 Discussion
This study is the first study to investigate the impact of representative and physiologically relevant doses of d-allulose and erythritol on the gut microbiota and metabolite production in adults with T2DM and co-living healthy adults using a validated ex vivo methodology. The results of this study provide important insights into the compound-specific effects of d-allulose and erythritol on the gut microbiota, two LNCS that are unexplored in the current literature in adults with T2DM and co-living healthy adults.
This study revealed that d-allulose significantly increased the abundance of specific gut microbial families and species (Lachnospiraceae family, and the species Anaerostipes hadrus and Lachnospiraceae_u_s) in the whole sample analysis of both healthy individuals and those with T2DM. However, when analyzing by donor group, the effects on species were not significant, making the relevance of the findings for the individual donor groups unclear. The d-allulose induced-increase in Anaerostipes hadrus and Lachnospiraceae_u_s was correlated with butyrate production. However, due to the exploratory nature of the rCCA analysis, statistical significance was not determined, only the strength of the correlations. Anaerostipes hadrus are a known butyrate-producing member of the microbiota (Allen-Vercoe et al., 2012). d-allulose increased butyrate and acetate production between 24–48 h in both healthy individuals and those with T2DM. Studies in animal models (mice and rats) have demonstrated increases in cecal SCFAs with d-allulose consumption (Matsuo et al., 2003, 2024), but no effects on faecal SCFAs (Han et al., 2020b). SCFAs are rapidly absorbed in the large intestine and therefore faecal SCFA concentrations are a less accurate reflection of SCFA production and may account for the null findings observed by Han et al. (2020b). Another rare sugar (d-tagatose) has also been shown to increase butyrate production in an in vitro study using human faecal samples (Venema et al., 2005).
This study demonstrated that erythritol significantly increased butyrate and gas production 24–48 h after treatment in both healthy individuals and co-living individuals with T2DM, but significantly decreased acetate and propionate production. Erythritol significantly increased Eubacteriaceae and Barnesiellaceae families in the whole sample analysis of both healthy individuals and those with T2DM. However, there were no significant effects of erythritol on microbial species. Two early in vitro studies suggest that the gut microbiota does not ferment erythritol (Hiele et al. 1993; Arrigoni et al., 2005). However, in both studies the erythritol dose was low (e.g., 50–100 mg). For example, data from an 24 h in vitro fermentation using human faecal samples indicated no effects of erythritol on pH, gas production, and SCFAs compared to a control condition and there was no substrate degradation of erythritol (Arrigoni et al., 2005). A more recent in vitro study using human faecal samples demonstrated no effect of 0.42 g/day of erythritol (dosed at 6.2 mg/kg based on an adult of average weight of 68 kg) on microbial community composition or alpha diversity and beta diversity (Mahalak et al., 2020). However, butyric and pentanoic acid production was significantly increased vs. the control condition, suggesting that erythritol is fermented by the gut microbiota (Mahalak et al., 2020). In the current study, LC-MS analysis of erythritol suggests that it is degraded by the gut microbiota in most individuals between 24–48 h. Moreover, the significant increase in butyrate and gas production and increase in abundance of specific microbial families suggests that it is fermented by the gut microbiota. Whilst further studies are needed to confirm the findings, the results of the current study indicate that d-allulose increases butyrate and acetate production and erythritol increases butyrate production 24–48 h after treatment. The findings also indicate that d-allulose significantly increased the abundance of specific microbial families and species, while erythritol only significantly increased the abundance of specific microbial families.
The butyrate-production kinetics were different for d-allulose and erythritol, such that d-allulose treatment significantly increased butyrate to a greater degree within 24 h whereas erythritol treatment significantly increased butyrate to a greater degree between 24–48 h. This corresponds with the observed fermentation kinetics of d-allulose and erythritol. d-allulose was fermented between 6-24 h whilst erythritol was fermented more slowly, mostly between 24–48 h. However, erythritol was fermented within 24 hours in two healthy participants. In these individuals, their microbiota may be adapted to degrading erythritol due to habitual consumption of erythritol. However, data on habitual erythritol or other LNCS consumption was not collected for the current study. This suggests complementary effects of d-allulose and erythritol on butyrate production kinetics. A blend of erythritol and d-allulose may also increase the likelihood of sweetness synergism and positive sensory properties combined with weak bitterness (Jang et al., 2021). Moreover, in people with T2DM, an acute dose of d-allulose has been shown to reduce postprandial glucose response following an oral glucose tolerance test (OGTT) (Noronha et al., 2018) and chronic consumption of erythritol for four weeks improved small vessel endothelial function and aortic stiffness (Flint et al., 2014). Due to the very low energy density of d-allulose and erythritol, they can be incorporated into the diet at doses that would confer benefits to butyrate production without adding substantial calories. However, a small amount of additional energy will be derived from SCFA production (estimated as 0.24 kcal/g for d-allulose and 0.03 kcal/g for erythritol for the current study). The current study did not examine the effect of d-allulose and erythritol as a blend and therefore, further research is needed to confirm the combined effect on the gut microbiota and fermentation metabolites as well as gastrointestinal tolerance. Additionally, synbiotic approaches, in which d-allulose are co-administered with the microbiota species utilizing each substrate could be explored in future research as an approach to increase butyrate production in individuals with T2DM.
Restoration of butyrate levels in the large intestine through the intake of d-allulose and erythritol might be a novel approach for the treatment of T2DM, alongside lifestyle modification and glucose lowering drugs (Arora and Tremaroli, 2021). Butyrate is the primary energy source for colonocytes (Koh et al., 2016). SCFAs also signal through free fatty acid receptors 2 and 3 (FFAR2/3; type of G-coupled protein receptors), which are widely expressed in diverse cell types in human, and therefore are key signaling molecules between the gut microbiota and the host (Koh et al., 2016; Mishra et al., 2020). Butyrate plays a role in glucose homeostasis (Arora and Tremaroli, 2021; Mayorga-Ramos et al., 2022; Puddu et al., 2014). A genetically influenced shift in the gut microbiome towards increased production of butyrate was associated with improved insulin response after an OGTT in normoglycemic individuals (Sanna et al., 2019). Anaerostipes hadrus, a species significantly increased by d-allulose treatment in the current study at 48 h compared to the NSC, was associated with an increase in serum butyrate and increased insulin sensitivity following an OGTT in healthy individuals (Cui et al., 2022). In diabetic db/db mice, targeted delivery of butyrate to the colon using high-amylose maize starch as a carrier improved insulin sensitivity, as shown by significantly lower Homeostatic Model Assessment of Insulin Resistance values, whereas high-amylose maize starch alone had no significant effect compared to control mice (Pedersen et al., 2023). In enteroendocrine cells, butyrate activates the FFAR2 and 3, stimulating the release of peptide YY and glucagon like peptide-1 thereby affecting glucose regulation and satiety (Christiansen et al., 2018; Larraufie et al., 2018; Nøhr et al., 2013). Within the systemic circulation, butyrate can modulate β-cell function in the pancreas via FFAR2/3, monocarboxylate transporters, and inhibition of histone deacetylases (Mayorga-Ramos et al., 2022). However, the effects of butyrate in the systemic circulation are likely to be limited because only very low concentrations of colon-derived butyrate reach the systemic circulation (van der Beek et al., 2015; Boets et al., 2017).
The International Scientific Association for Probiotics and Prebiotics (ISAPP) defines a prebiotic as a substrate that is selectively utilized by host microorganisms conferring a health benefit (Gibson et al., 2017; Hutkins et al., 2025). ISAPP states that evidence for selective utilization, in the context of the prebiotic definition, can range from narrow to broad changes in taxa and may be reflected in changes in microbial metabolic activity (Hutkins et al., 2025). In the current study, d-allulose significantly increased the abundance of particular microbial families and species and erythritol significantly increased the abundance of particular microbial families, which suggest that they are utilized by specific host microorganisms (Hutkins et al., 2025). However, human clinical studies are required to establish the effects on the gut microbiota in vivo and to demonstrate an associated health benefit to confirm prebiotic effects consistent with the ISAPP definition (Hutkins et al., 2025). The potential associated health benefits may include butyrate-mediated effects on glycaemic control and insulin sensitivity (Arora and Tremaroli, 2021; Mayorga-Ramos et al., 2022). While the correlations observed in the current study suggest that microbial species were related to butyrate and acetate production following d-allulose treatment, further research is needed to confirm that the d-allulose-induced increase in butyrate and acetate is directly due to an increase in specific microbial species. Additionally, more research is required to determine the effect of erythritol on the abundance of microbiota at the species level, as the current study only observed a significant increase at the family level and there were no significant effects at the species level. Previous studies in mice have demonstrated potential prebiotic effects of d-allulose. In particular, two previous studies have demonstrated that d-allulose modulates specific microbiota species and these changes were correlated with improvements in high fat diet-induced obesity and fasting blood glucose (Han et al., 2020a, 2020b). Moreover, synbiotic mixtures combining two probiotic species with d-allulose as a prebiotic suppressed diet-induced obesity in mice via the regulation of lipid metabolism (Choi et al., 2018). This highlights the potential prebiotic effects of these substances, warranting further investigation in future studies.
The limitations of this study should be considered when interpreting the findings. Despite the high predictivity of the ex vivo methodology to in vivo human clinical trials (Van den Abbeele et al., 2023b), these findings need to be replicated in both acute and chronic human clinical studies. The use of an ex vivo methodology which lacks a host compartment precluded the examination of interactions between the host and the microbiome. Therefore, potential microbiota-mediated health effects should be investigated in future human clinical studies. While the SIFR® technology is able to predict microbial changes upon repeated intake over weeks, further studies are needed to examine the impact of such chronic effects of d-allulose and erythritol consumption (alone and in combination) on physiological effects related to glucose homeostasis in human trials.
5 Conclusion
To conclude, this study suggests that representative and physiologically relevant doses of d-allulose and erythritol significantly increase butyrate and significantly increase the abundance of particular microbial families or species. The findings indicate that d-allulose significantly increased the abundance of specific microbial families and species, while erythritol only significantly increased the abundance of specific microbial families, which suggests they are and utilized as growth substrates through fermentative breakdown by host microorganisms. The health benefits could follow from the production of SCFAs, and particularly from the production of butyrate. These findings suggest a potential prebiotic effect of d-allulose and erythritol which warrants further investigation in future studies. Combining d-allulose and erythritol could be a promising strategy to reduce free sugar intakes and increase butyrate production in individuals with T2DM and healthy individuals, which may result in benefits related to glycemic control.
Corresponding author; e-mail: katie.adolphus@tateandlyle.com
Supplementary material
Supplementary material is available online at: https://doi.org/10.6084/m9.figshare.28760066
Authors’ contribution
Conceptualization: DR, KK, PVDA, IL, AB; methodology, data collection, data analysis: PVDA, AB, JP, SD; writing-original draft preparation: KA; writing- review and editing: KA, PVDA, JP, SD, AB, IL, KK, DR. All authors read and approved the final manuscript.
Conflict of interest
This research was funded by Tate & Lyle PLC, UK. KA, KK, and DR are employees of Tate & Lyle PLC, London, UK. IL was an employee of Tate & Lyle PLC, London, UK. While the authors participated in the design of this study, the interpretation of the data and the production of the manuscript, they did not participate in the collection and analyses of data. DR, IL, KK, PVDA, AB are inventors named on a pending patent application which includes portions of the research.
Funding
This research was funded by Tate & Lyle PLC, UK.
References
Adams, K.J., Pratt, B., Bose, N., Dubois, L.G., St John-Williams, L., Perrott, K.M., Ky, K., Kapahi, P., Sharma, V., MacCoss, M.J., Moseley, M.A., Colton, C.A., MacLean, B.X., Schilling, B., Thompson, J.W. and Alzheimer’s Disease Metabolomics Consortium, 2020. Skyline for small molecules: a unifying software package for quantitative metabolomics. Journal of Proteome Research 19(4): 1447-1458.
Agarwal, K., Maki, K.A., Vizioli, C., Carnell, S., Goodman, E., Hurley, M., Harris, C., Colwell, R., Steele, K. and Joseph, P.V., 2022. The Neuro-Endo-Microbio-Ome Study: A pilot study of neurobiological alterations pre- versus post-bariatric surgery. Biological Research for Nursing 24(3): 362-378.
Aguirre, M., Ramiro-Garcia, J., Koenen, M.E. and Venema, K., 2014. To pool or not to pool? Impact of the use of individual and pooled faecal samples for in vitro fermentation studies. Journal of Microbiological Methods 107: 1-7.
Allen-Vercoe, E., Daigneault, M., White, A., Panaccione, R., Duncan, S.H., Flint, H.J., O’Neal, L. and Lawson, P.A., 2012. Anaerostipes hadrus comb. nov., a dominant species within the human colonic microbiota; reclassification of Eubacterium hadrum Moore et al. 1976. Anaerobe 18(5): 523-529.
Arora, T. and Tremaroli, V., 2021. Therapeutic Potential of Butyrate for Treatment of Type-2 diabetes. Frontiers in Endocrinology 12: 761834.
Arrigoni, E., Brouns, F. and Amadò, R., 2005. Human gut microbiota does not ferment erythritol. The British Journal of Nutrition 94(5): 643-646.
Au-Yeung, F., Jenkins, A.L., Prancevic, S., Vissers, E., Campbell, J.E. and Wolever, T.M.S., 2023. Comparison of postprandial glycemic and insulinemic response of allulose when consumed alone or when added to sucrose: A randomized controlled trial. Journal of Functional Foods 105: 105569.
Azaïs-Braesco, V., Sluik, D., Maillot, M., Kok, F. and Moreno, L.A., 2017. A review of total & added sugar intakes and dietary sources in Europe. Nutrition Journal 21: 6.
Bates, D., Mächler, M., Bolker, B. and Walker, S., 2015. Fitting linear mixed-effects models using lme4. Journal of Statistical Software 67(1): 1-48.
Benjamini, Y. and Hochberg, Y., 1995. Controlling the False Discovery Rate: A Practical and Powerful Approach to Multiple Testing. Journal of the Royal Statistical Society: Series B (Methodological) 57: 289-300.
Boets, E., Gomand, S.V., Deroover, L., Preston, T., Vermeulen, K., De Preter, V., Hamer, H.M., Van den Mooter, G., De Vuyst, L., Courtin, C.M., Annaert, P., Delcour, J.A. and Verbeke, K.A., 2017. Systemic availability and metabolism of colonic-derived short-chain fatty acids in healthy subjects: a stable isotope study. Journal of Physiology 595: 541-555. https://doi.org10.1113/JP272613.
Bolger, A.M., Rastall, R.A., Oruna-Concha, M.J. and Rodriguez-Garcia, J., 2021. Effect of d-allulose, in comparison to sucrose and d-fructose, on the physical properties of cupcakes. LWT 150: 111989.
Bornet, F.R., Blayo, A., Dauchy, F. and Slama, G., 1996. Plasma and urine kinetics of erythritol after oral ingestion by healthy humans. Regulatory Toxicology and Pharmacology 24: S280-S285.
Brodkorb, A., Egger, L., Alminger, M., Alvito, P., Assunção, R., Balance, S., Bohn, T., Bourlieu-Lacanal, C., Boutrou, R., Carrière, F., Clemente, A., Corredig, M., Dupont, D., Dufour, C., Edwards, C., Golding, M., Karakaya, S., Kirkhus, B., Le Feunteun, S., Lesmes, U., Macierzanka, A., Mackie, A.R., Martins, C., Marze, S., McClements, D.J., Ménard, O., Minekus, M., Portmann, R., Santos, C.N., Souchon, I., Singh, R.P., Vegarud, G.E., Wickham, M.S.J., Weitschies, W. and Recio, I., 2019. INFOGEST static in vitro simulation of gastrointestinal food digestion. Nature Protocols 14: 991-1014.
Brumfield, K.D., Cotruvo, J.A., Shanks, O.C., Sivaganesan, M., Hey, J., Hasan, N.A., Huq, A., Colwell, R.R. and Leddy, M.B., 2021. Metagenomic sequencing and quantitative real-time PCR for fecal pollution assessment in an urban watershed. Frontiers in Water 3: 626849.
Chen, Z., Radjabzadeh, D., Chen, L., Kurilshikov, A., Kavousi, M., Ahmadizar, F., Ikram, M.A., Uitterlinden, A.G., Zhernakova, A., Fu, J., Kraaij, R. and Voortman, T., 2021. Association of insulin resistance and type-2 diabetes with gut microbial diversity: a microbiome-wide analysis from population studies. JAMA Network Open 4: e2118811.
Choi, B.R., Kwon, E.Y., Kim, H.J. and Choi, M.S., 2018. Role of synbiotics containing d-allulose in the alteration of body fat and hepatic lipids in diet-induced obese mice. Nutrients 19: 1797.
Christiansen, C.B., Gabe, M.B.N., Svendsen, B., Dragsted, L.O., Rosenkilde, M.M. and Holst, J.J., 2018. The impact of short-chain fatty acids on GLP-1 and PYY secretion from the isolated perfused rat colon. American Journal of Physiology Gastrointestinal and Liver Physiology 315: G53-G65.
Code of Federal Regulations, 2024. Title 21 – Food and Drugs. §101.9 Nutrition labeling of food. Available online at https://www.ecfr.gov/current/title-21/chapter-I/subchapter-B/part-101/subpart-A/section-101.9 (accessed 6 February 2024).
Conz, A., Salmona, M. and Diomede, L., 2023. Effect of non-nutritive sweeteners on the gut microbiota. Nutrients 15: 1869.
Cooper, J.M., 2017. The challenges of reformulation for sugars reduction. Food Science and Technology 31: 38-41.
Cui, J., Ramesh, G., Wu, M., Jensen, E.T., Crago, O., Bertoni, A.G., Gao, C., Hoffman, K.L., Sheridan, P.A., Wong, K.E., Wood, A.C., Chen, Y.-D.I., Rotter, J.I., Petrosino, J.F., Rich, S.S. and Goodarzi, M.O., 2022. Butyrate-producing bacteria and insulin homeostasis: the microbiome and insulin longitudinal evaluation study (MILES). Diabetes 71: 2438-2446.
Cunningham, A.L., Stephens, J.W. and Harris, D.A., 2021. Gut microbiota influence in type-2 diabetes mellitus (T2DM). Gut Pathogens 13: 50.
Daniel, H., Hauner, H., Hornef, M. and Clavel, T., 2022. Allulose in human diet: the knowns and the unknowns. The British Journal of Nutrition 128: 172-178.
Doneanu, C.E., Chen, W. and Mazzeo, J.R., 2011. UPLC/MS monitoring of water-soluble vitamin Bs in cell culture media in minutes. Water Appl. Note, 720004042en. Available online at https://www.waters.com/waters/library.htm?locale=en_US&lid=134636355 (accessed 26 July 2023).
European Food Safety Authority (EFSA), 2015. Scientific Opinion on the safety of the proposed extension of use of erythritol (E 968) as a food additive. EFSA Journal 13: 4033.
European Food Safety Authority (EFSA), 2023. Re-evaluation of erythritol (E968) as a food additive. EFSA Journal 21: e8430.
Flint, N., Hamburg, N.M., Holbrook, M., Dorsey, P.G., LeLeiko, R.M., Berger, A., de Cock, P., Bosscher, D. and Vita, J.A., 2014. Effects of erythritol on endothelial function in patients with type-2 diabetes mellitus: a pilot study. Acta Diabetologica 51: 513-5216. https://doi.org/10.1007/s00592-013-0534-2.
Food and Drug Administration (FDA), 2001. GRAS notice 76: Erythritol. Available online at https://www.cfsanappsexternal.fda.gov/scripts/fdcc/index.cfm?set=GRASNotices&id=76&sort=GRN_No&order=DESC&startrow=1&type=basic&search=erythritol (accessed 19 January, 2024).
Food and Drug Administration (FDA), 2011. GRAS notice 400: D-psicose. Available online at https://www.cfsanappsexternal.fda.gov/scripts/fdcc/index.cfm?set=GRASNotices&id=400&sort=GRN_No&order=DESC&startrow=1&type=basic&search=D%2Dpsicose (accessed 21 January 2024).
Food and Drug Administration (FDA), 2020. Guidance for industry: the declaration of allulose and calories from allulose on nutrition and supplement facts labels. Available online at https://www.fda.gov/regulatory-information/search-fda-guidance-documents/guidance-industry-declaration-allulose-and-calories-allulose-nutrition-and-supplement-facts-labels (accessed 6 February 2024).
Gallagher, A.M., Ashwell, M., Halford, J.C.G., Hardman, C.A., Maloney, N.G. and Raben, A., 2021. Low-calorie sweeteners in the human diet: scientific evidence, recommendations, challenges and future needs. A symposium report from the FENS, 2019 conference. Journal of Nutritional Science 25: e7.
Gibson, G.R., Hutkins, R., Sanders, M.E., Prescott, S.L., Reimer, R.A., Salminen, S.J., Scott, K., Stanton, C., Swanson, K.S., Cani, P.D., Verbeke, K. and Reid, G., 2017. Expert consensus document: the International Scientific Association for Probiotics and Prebiotics (ISAPP) consensus statement on the definition and scope of prebiotics. Nature Reviews Gastroenterology & Hepatology 14: 491-502.
Grembecka, M., 2015. Sugar alcohols—their role in the modern world of sweeteners: a review. European Food Research and Technology 241: 1-14.
Gurung, M., Li, Z., You, H., Rodrigues, R., Jump, D.B., Morgun, A. and Shulzhenko, N., 2020. Role of gut microbiota in type-2 diabetes pathophysiology. EBioMedicine. 51: 102590.
Han, Y., Choi, B.R., Kim, S.Y., Kim, S.B., Kim, Y.H., Kwon, E.Y. and Choi, M.S., 2018. Gastrointestinal tolerance of d-allulose in healthy and young adults. A non-randomized controlled trial. Nutrients 10: 2010.
Han, Y., Kwon, E.-Y. and Choi, M.-S., 2020a. Anti-diabetic effects of allulose in diet-induced obese mice via regulation of mRNA expression and alteration of the microbiome composition. Nutrients 12: 2113.
Han, Y., Park, H., Choi, B.-R., Ji, Y., Kwon, E.-Y. and Choi, M.-S., 2020b. Alteration of microbiome profile by d-allulose in amelioration of high-fat-diet-induced obesity in mice. Nutrients 12: 352.
Han, Y., Yoon, J. and Choi, M.-S., 2020c. Tracing the anti-inflammatory mechanism/triggers of d-allulose: a profile study of microbiome composition and mRNA expression in diet-induced obese mice. Molecular Nutrition and Food Research 64: 1900982.
Hasan, N.A., Young, B.A., Minard-Smith, A.T., Saeed, K., Li, H., Heizer, E.M., McMillan, N.J., Isom, R., Abdullah, A.S., Bornman, D.M., Faith, S.A., Choi, S.Y., Dickens, M.L., Cebula, T.A. and Colwell, R.R., 2014. Microbial community profiling of human saliva using shotgun metagenomic sequencing. PLoS ONE 9: e97699.
Hiele, M., Ghoos, Y., Rutgeerts, P. and Vantrappen, G., 1993. Metabolism of erythritol in humans: comparison with glucose and lactitol. The British Journal of Nutrition 69(1): 169-176.
Hourigan, S.K., Subramanian, P., Hasan, N.A., Ta, A., Klein, E., Chettout, N., Huddleston, K., Deopujari, V., Levy, S., Baveja, R., Clemency, N.C., Baker, R.L., Niederhuber, J.E. and Colwell, R.R., 2018. Comparison of infant gut and skin microbiota, resistome and virulome between neonatal intensive care unit (NICU) Environments. Frontiers in Microbiology 9: 1361.
Huang, Y., Chen, Z., Chen, B., Li, J., Yuan, X., Li, J., Wang, W., Dai, T., Chen, H., Wang, Y., Wang, R., Wang, P., Guo, J., Dong, Q., Liu, C., Wie, Q., Cao, D. and Liu, L., 2023. Dietary sugar consumption and health: umbrella review. British Medical Journal 381: e071609.
Hutkins, R., Walter, J., Gibson, G.R., Bedu-Ferrari, C., Scott, K., Tancredi, D.J., Wijeyesekera, A. and Sanders, M.E., 2025. Classifying compounds as prebiotics – scientific perspectives and recommendations. Nature Reviews Gastroenterology & Hepatology 22: 54-70. https://doi.org/10.1038/s41575-024-00981-6.
Iida, T., Hayashi, N., Yamada, T., Yoshikawa, Y., Miyazato, S., Kishimoto, Y., Okuma, K., Tokuda, M. and Izumori, K., 2010. Failure of d-psicose absorbed in the small intestine to metabolize into energy and its low large intestinal fermentability in humans. Metabolism: Clinical and Experimental 59: 206-214.
Iida, T., Kishimoto, Y., Yoshikawa, Y., Hayashi, N., Okuma, K., Tohi, M., Yagi, K., Matsuo, T. and Izumori, K., 2008. Acute D-psicose administration decreases the glycemic responses to an oral maltodextrin tolerance test in normal adults. Journal of Nutritional Science and Vitaminology 54: 511-514.
Ishikawa, M., Miyashita, M., Kawashima, Y., Nakamura, T., Saitou, N. and Modderman, J., 1996. Effects of oral administration of erythritol on patients with diabetes. Regulatory Toxicology and Pharmacology 24: S303-S308.
Jacqz-Aigrain, E., Kassai, B., Cornu, C., Cazaubiel, J.M., Housez, B., Cazaubiel, M., Prével, J.M., Bell, M., Boileau, A. and de Cock, P., 2015. Gastrointestinal tolerance of erythritol-containing beverage in young children: a double-blind, randomised controlled trial. European Journal of Clinical Nutrition 69: 746-751.
Jang, Y., Chung, S., Kim, S. and Park, S., 2021. Searching for optimal low calorie sweetener blends in ternary and quaternary system. Food Quality and Preference 90: 104184.
Kalan, L.R., Meisel, J.S., Loesche, M.A., Horwinski, J., Soaita, I., Chen, X., Uberoi, A., Gardner, S.E. and Grice, E.A., 2019. Strain- and species-level variation in the microbiome of diabetic wounds is associated with clinical outcomes and therapeutic efficacy. Cell Host & Microbe 25: 641-655.
Karlsson, F., Tremaroli, V., Nielsen, J. and Bäckhed, F., 2013. Assessing the human gut microbiota in metabolic diseases. Diabetes 62: 3341-3349.
Koh, A., De Vadder, F., Kovatcheva-Datchary, P. and Bäckhed, F., 2016. From dietary fiber to host physiology: short-chain fatty acids as key bacterial metabolites. Cell 165: 1332-1345.
Kolb, H. and Martin, S., 2017. Environmental/lifestyle factors in the pathogenesis and prevention of type-2 diabetes. BMC Medicine 15: 131.
Larraufie, P., Martin-Gallausiaux, C., Lapaque, N., Dore, J., Gribble, F.M., Reimann, F. and Blottiere, H.M., 2018. SCFAs strongly stimulate PYY production in human enteroendocrine cells. Scientific Reports 8: 74.
Larsen, N., Vogensen, F.K., van den Berg, F.W., Nielsen, D.S., Andreasen, A.S., Pedersen, B.K., Al-Soud, W.A., Sørensen, S.J., Hansen, L.H. and Jakobsen, M., 2010. Gut microbiota in human adults with type-2 diabetes differs from non-diabetic adults. PLoS ONE 5: e9085.
Leonard, M.M., Valitutti, F., Karathia, H., Pujolassos, M., Kenyon, V., Fanelli, B., Troisi, J., Subramanian, P., Camhi, S., Colucci, A., Serena, G., Cucchiara, S., Trovato, C.M., Malamisura, B., Francavilla, R., Elli, L., Hasan, N.A., Zomorrodi, A.R., Colwell, R., Fasano, A. and CD-GEMM Team, 2021. Microbiome signatures of progression toward celiac disease onset in at-risk children in a longitudinal prospective cohort study. Proceedings of the National Academy of Sciences of the United States of America 118: e2020322118.
Lüdecke, D., 2018. ggeffects: Tidy data frames of marginal effects from regression models. Journal of Open Source Software 3(26): 772.
Mahalak, K.K., Firrman, J., Tomasula, P.M., Nuñez, A., Lee, J.J., Bittinger, K., Rinaldi, W. and Liu, L.S., 2020. Impact of steviol glycosides and erythritol on the human and cebus apella gut microbiome. Journal of Agricultural and Food Chemistry 68: 13093-13101.
Matsuo, T., Tanaka, T., Hashiguchi, M., Izumori, K. and Suzuki, H., 2003. Metabolic effects of D-psicose in rats: studies on faecal and urinary excretion and caecal fermentation. Asia Pacific Journal of Clinical Nutrition 12: 225-231.
Matsuo, T., Higaki, S., Inai, R., Takata, G., Mochizuki, S., Yoshihara, A. and Akimitsu, K., 2024. Effects of dietary allitol and D-allulose on body fat accumulation and cecal short-chain fatty acid production in rats fed a high-fat diet. Journal of Oleo Science 1: 1329-1337.
Mayorga-Ramos, A., Barba-Ostria, C., Simancas-Racines, D. and Guamán, L.P., 2022. Protective role of butyrate in obesity and diabetes: New insights. Frontiers in Nutrition 9: 1067647.
Mishra, S.P., Karunakar, P., Taraphder, S. and Yadav, H., 2020. Free fatty acid receptors 2 and 3 as microbial metabolite sensors to shape host health: pharmacophysiological view. Biomedicines 8: 154.
Moon, H.J., Jeya, M., Kim, I.W. and Lee, J.K., 2010. Biotechnological production of erythritol and its applications. Applied Microbiology and Biotechnology 86: 1017-1025.
Morrison, D.J. and Preston, T., 2016. Formation of short chain fatty acids by the gut microbiota and their impact on human metabolism. Gut Microbes 7: 189-200.
Noda, K., Nakayama, K. and Oku, T., 1994. Serum glucose and insulin levels and erythritol balance after oral administration of erythritol in healthy subjects. European Journal of Clinical Nutrition 48: 286-292.
Nøhr, M.K., Pedersen, M.H., Gille, A., Egerod, K.L., Engelstoft, M.S., Husted, A.S., Sichlau, R.M., Grunddal, K.V., Seier Poulsen, S., Han, S., Jones, R.M., Offermanns, S. and Schwartz, T.W., 2013. GPR41/FFAR3 and GPR43/FFAR2 as cosensors for short-chain fatty acids in enteroendocrine cells vs FFAR3 in enteric neurons and FFAR2 in enteric leukocytes. Endocrinology 154: 3552-3564.
Noronha, J.C., Braunstein, C.R., Glenn, A.J., Khan, T.A., Viguiliouk, E., Noseworthy, R., Blanco Mejia, S., Kendall, C.W.C., Wolever, T.M.S., Leiter, L.A. and Sievenpiper, J.L., 2018. The effect of small doses of fructose and allulose on postprandial glucose metabolism in type-2 diabetes: A double-blind, randomized, controlled, acute feeding, equivalence trial. Diabetes Obesitas Metabolism 20: 2361-2370. https://doi.org/10.1111/dom.13374
Oliphant, K. and Allen-Vercoe, E., 2019. Macronutrient metabolism by the human gut microbiome: major fermentation by-products and their impact on host health. Microbiome 7: 91.
Pedersen, S., Schultz, M., Prause, C., Sørensen, J., Størling, T.M., Mariño, E. and Billestrup, N., 2023. Targeted delivery of butyrate improves glucose homeostasis, reduces hepatic lipid accumulation and inflammation in db/db mice. International Journal of Molecular Sciences 24: 4533.
Pérez-Burillo, S., Molino, S., Navajas-Porras, B., Valverde-Moya, Á.J., Hinojosa-Nogueira, D., López-Maldonado, A., Pastoriza, S. and Rufián-Henares, J., 2021. An in vitro batch fermentation protocol for studying the contribution of food to gut microbiota composition and functionality. Nature Protocols 16: 3186-3209.
Plaza-Diaz, J., Pastor-Villaescusa, B., Rueda-Robles, A., Abadia-Molina, F. and Ruiz-Ojeda, F.J., 2020. Plausible biological interactions of low- and non-calorie sweeteners with the intestinal microbiota: an update of recent studies. Nutrients 12: 1153.
Puddu, A., Sanguineti, R., Montecucco, F. and Viviani, G.L., 2014. Evidence for the gut microbiota short-chain fatty acids as key pathophysiological molecules improving diabetes. Mediators of Inflammation: 162021.
Qin, J., Li, Y., Cai, Z., Li, S., Zhu, J., Zhang, F., Liang, S., Zhang, W., Guan, Y., Shen, D., Peng, Y., Zhang, D., Jie, Z., Wu, W., Qin, Y., Xue, W., Li, J., Han, L., Lu, D., Wu, D., Dai, Y., Sun, X., Li, Z., Tang, A., Zhong, S., Li, X., Chen, W., Xu, R., Wang, M., Feng, Q., Gong, M., Yu, J., Zhang, Y., Zhang, M., Hansen, T., Sanchez, G., Raes, J., Falony, G., Okuda, S., Almeida, M., LeChatelier, E., Renault, P., Pons, N., Batto, J.-M., Zhang, Z., Chen, H., Yang, R., Zheng, W., Li, S., Yang, H., Wang, J., Ehrlich, S.D., Nielsen, R., Pedersen, O., Kristiansen, K. and Wang, J., 2012. A metagenome-wide association study of gut microbiota in type-2 diabetes. Nature 490: 55-60.
Regnat, K., Mach, R.L. and Mach-Aigner, A.R., 2018. Erythritol as sweetener-wherefrom and whereto? Applied Microbiology And Biotechnology 102: 587-595.
Risso, D., Dunn-Galvin, G., Saxena, S., Doolan, A., Spence, L. and Karnik, K., 2024. Gastrointestinal tolerance of d-allulose in children: an acute, randomised, double-blind, placebo-controlled, cross-over study. Food & Function 15: 411-418.
Rohart, F., Gautier, B., Singh, A. and Ka, L.C., 2017. mixOmics: An R package for ‘omics feature selection and multiple data integration. PLoS Computational Biology 13: e1005752.
Ruiz-Ojeda, F.J., Plaza-Dı́az, J., Sáez-Lara, M.J. and Gil, A., 2019. Effects of sweeteners on the gut microbiota: a review of experimental studies and clinical trials. Advances in Nutrition. 10: S31-S48.
Sanna, S., van Zuydam, N.R., Mahajan, A., Kurilshikov, A., Vich Vila, A., Võsa, U., Mujagic, Z., Masclee, A.A.M., Jonkers, D., Oosting, M., Joosten, L.A.B., Netea, M.G., Franke, L., Zhernakova, A., Fu, J., Wijmenga, C. and McCarthy, M.I., 2019. Causal relationships among the gut microbiome, short-chain fatty acids and metabolic diseases. Nature Genetics 51: 600-605.
Shetty, S.A., Zuffa, S., Bui, T.P.N., Aalvink, S., Smidt, H. and De Vos, W.M., 2018. Reclassification of Eubacterium hallii as Anaerobutyricum hallii gen. nov., comb. nov., and description of Anaerobutyricum soehngenii sp. nov., a butyrate and propionate-producing bacterium from infant faeces. International Journal of Systematic and Evolutionary Microbiology 68: 3741-3746.
Storey, D., Lee, A., Bornet, F. and Brouns, F., 2007. Gastrointestinal tolerance of erythritol and xylitol ingested in a liquid. European Journal of Clinical Nutrition 61: 349-354.
Tan, J., McKenzie, C., Potamitis, M., Thorburn, A.N., Mackay, C.R. and Macia, L., 2014. The role of short-chain fatty acids in health and disease. Advances in Immunology 121: 91-119.
Tennant, D.R., 2014. Potential intakes of total polyols based on UK usage survey data. Food additives & contaminants Part A, Chemistry, Analysis, Control, Exposure & Risk Assessment 31: 574-586.
Teysseire, F., Bordier, V., Budzinska, A., Van Oudenhove, L., Weltens, N., Beglinger, C., Wölnerhanssen, B.K. and Meyer-Gerspach, A.C., 2023. Metabolic effects and safety aspects of acute d-allulose and erythritol administration in healthy subjects. Nutrients 15: 458.
Van den Abbeele, P., Poppe, J., Deyaert, S., Laurie, I., Gravert, T.K.O., Abrahamsson, A., Baudot, A., Karnik, K. and Risso, D., 2023a. Low-no-calorie sweeteners exert marked compound-specific impact on the human gut microbiota ex vivo. International Journal of Food Sciences and Nutrition 74: 630-644.
Van den Abbeele, P., Deyaert, S., Thabuis, C., Perreau, C., Bajic, D., Wintergerst, E., Joossens, M., Firrman, J., Walsh, D. and Baudot, A., 2023b. Bridging preclinical and clinical gut microbiota research using the ex vivo SIFR(®) technology. Frontiers in Microbiology 14: 1131662.
Van den Abbeele, P., Detzel, C., Rose, A., Deyaert, S., Baudot, A. and Warner, C., 2023c. Serum-derived bovine immunoglobulin stimulates SCFA production by specific microbes in the ex vivo SIFR® technology. Microorganisms 11: 659. https://doi.org/10.3390/microorganisms11030659.
van der Beek, C.M., Bloemen, J.G., van den Broek, M.A., Lenaerts, K., Venema, K., Buurman, W.A. and Dejong, C.H., 2015. Hepatic uptake of rectally administered butyrate prevents an increase in systemic butyrate concentrations in humans. Journal of Nutrition 145: 2019-2024. https://doi.org/10.3945/jn.115.211193
Venema, K., Vermunt, S.H.F. and Brink, E.J., 2005. D-Tagatose increases butyrate production by the colonic microbiota in healthy men and women. Microbial Ecology in Health and Disease 17: 47-57.
Williamson, P., Schunk, T., Woodyer, R., Chiuu, D., Song, Q., Atiee, G. and Unger, S., 2014. A single-dose, microtracer study to determine the mass balance of orally administered, 14C-labeled sweetener in healthy adult men (LB450). FASEB Journal 28: LB450.
Witkowski, M., Nemet, I., Alamri, H., Wilcox, J., Gupta, N., Nimer, N., Haghikia, A., Li, X.S., Wu, Y., Saha, P.P., Demuth, I., König, M., Steinhagen-Thiessen, E., Cajka, T., Fiehn, O., Landmesser, U., Tang, W.H.W. and Hazen, S.L., 2023. The artificial sweetener erythritol and cardiovascular event risk. Nature Medicine 29: 710-718. https://doi.org/10.1038/s41591-023-02223-9
World Health Organization (WHO), 2015. Guideline: sugars intake for adults and children. https://www.who.int/publications/i/item/9789241549028 (accessed 19 January 2024).
Yuma, T., Tokuda, M., Nishimoto, N., Yokoi, H. and Izumori, K., 2023. Allulose for the attenuation of postprandial blood glucose levels in healthy humans: a systematic review and meta-analysis. PLoS ONE 18: e0281150.
Zhang, W., Chen, D., Chen, J., Xu, W., Chen, Q., Wu, H., Guang, C. and Mu, W., 2023. d-allulose, a versatile rare sugar: recent biotechnological advances and challenges. Critical Reviews in Food Science and Nutrition 63: 5661-5679.
Zhang, Y., Pan, X.F., Chen, J., Xia, L., Cao, A., Zhang, Y., Wang, J., Li, H., Yang, K., Guo, K., He, M. and Pan, A., 2020. Combined lifestyle factors and risk of incident type-2 diabetes and prognosis among individuals with type-2 diabetes: a systematic review and meta-analysis of prospective cohort studies. Diabetologia 63: 21-33.
Appendix
Summary of the dose selection criteria to identify in vivo test doses of d-allulose and erythritol
Citation: Beneficial Microbes 16, 5 (2025) ; 10.1163/18762891-bja00071
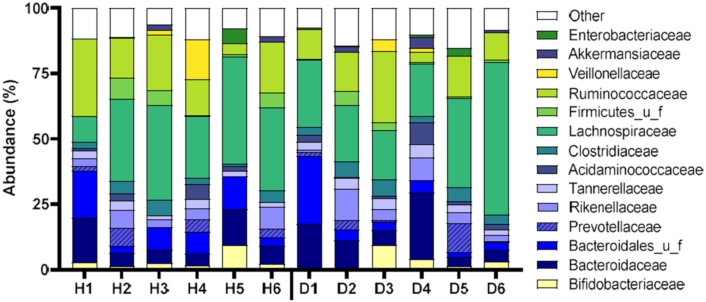
Abundances (%) of the key families of the different fecal microbiota of the participants with type-2 diabetes mellitus (D1–D6) and healthy participants (H1–H6) at 0 h. H = healthy; D = type-2 diabetes mellitus.
Citation: Beneficial Microbes 16, 5 (2025) ; 10.1163/18762891-bja00071
(A) pH, (B) gas (mbar), (C) total SCFA (mM), (D) acetate (mM), (E) propionate (mM), (F) butyrate (mM), (G) BCFA (mM), (H) lactate (mM), and (I) valerate (mM) levels after 0 (NSC only) 6, 24 and 48 h of incubation with erythritol or d-allulose by donor group (
Citation: Beneficial Microbes 16, 5 (2025) ; 10.1163/18762891-bja00071
(A) Actinomycetota (cells/ml), (B) Bacteroidota (cells/ml) and (C) Bacillota (cells/ml) after 0 (NSC only) 6, 24, and 48 h of incubation with erythritol or d-allulose for the whole sample (n = 12). Statistical differences between test products vs. the NSC are indicated by *(0.01
Citation: Beneficial Microbes 16, 5 (2025) ; 10.1163/18762891-bja00071
(A) Actinomycetota (cells/mL), (B) Bacteroidota (cells/ml) and (C) Bacillota (cells/ml) after 0 (NSC only) 6, 24 and 48 h of incubation with erythritol or d-allulose by donor group (
Citation: Beneficial Microbes 16, 5 (2025) ; 10.1163/18762891-bja00071
Microbial families and species expressed as log2 (treatment/NSC) that were significantly affected 48 h of colonic incubations with erythritol or d-allulose compared to the NSC (FDR = 0.10) by donor group (
Citation: Beneficial Microbes 16, 5 (2025) ; 10.1163/18762891-bja00071


