Abstract
Sleep quality and duration can be impacted by diet, and has been linked to gut microbiota composition and function as the result of communication via the microbiota-gut-brain axis. As one strategy to improve sleep quality could be through the modulation of the gut microbiome, we assessed the effects of a dairy-based product containing whey protein, galacto-oligosaccharides, tryptophan, vitamins and minerals after a 3 weeks intervention on gut microbiota composition and (gut-brain related) functions on basis of 67 healthy subjects with moderate sleep disturbances. Associations of the gut microbiota with sleep quality and with response/non-response to the treatment were revealed by shotgun metagenomics sequencing of faecal DNA samples, and subsequent analyses of microbiota taxonomy and generic functionality. A database of manually curated Gut-Brain Modules (GBMs) was applied to analyse specific microbial functions/pathways that have the potential to interact with the brain. A moderate discriminating effect of the DP treatment on gut microbiota composition was revealed which could be mainly attributed to a decrease in Pseudomonas resinovorans, Flintibacter sp. KGM00164, Intestinimonas butyriciproducens, and Flavonifractor plautii. As interindividual variance in microbiota composition could have given rise to a heterogenous responsiveness of the subjects in the intervention group, we zoomed in on the differences between responders and non-responders. A significant difference in baseline microbiota composition between responders and non-responders was apparent, showing lower Bifidobacterium longum and Bifidobacterium adolescentis, and higher Faecalibacterium prausnitzii relative abundances in responders. The findings provide leads with respect to the effectiveness and potential underlying mechanisms of mode of action in sleep improvement that could support future nutritional interventions to aid sleep improvement.
1 Introduction
Good sleep quality is of crucial importance for our overall health and well-being (Chattu et al., 2018), while the prevalence of insufficient sleep and daytime sleepiness is globally on the rise (Haarhuis et al., 2022). Therefore, there is an urgent need for interventions that support a good night of sleep. Although a multifactorial approach is likely important, one strategy with great potential is modulation of the gut microbiota as there is credible evidence for bidirectional communication between human gut microbiota and the brain, also known as the microbiota-gut-brain axis. Multiple studies have shown an association of sleep quality with gut microbiota composition and diversity in humans and animals (Benedict et al., 2016; Cryan et al., 2019; Han et al., 2022; Matenchuk et al., 2020; Smith et al., 2019). The underlying mechanisms remain to be revealed although several potential pathways have been proposed. The immune- and neuroendocrine system, the vagus nerve, bacterial metabolites, and circadian rhythm are considered to play a role in the bidirectional communication underlying the microbiota-gut-brain axis, and therefore likely also in sleep physiology (Cryan et al., 2019; Han et al., 2022). Several gut microbiota species have been shown to produce neurotransmitters like serotonin, γ-aminobutyric acid (GABA), dopamine, and more generic metabolites that have been linked with sleep are short chain fatty acids (SCFAs, e.g. acetate, butyrate, propionate) and secondary bile acids (Haarhuis et al., 2022; Han et al., 2022).
There is evidence from multiple studies that gut microbiota modulation via pre- pro- and postbiotics can improve sleep quality and stress in healthy subjects (Haarhuis et al., 2022). We have previously reported that a whey protein-galacto-oligosaccharides (GOS)-based product enriched with tryptophan, a tryptic casein hydrolysate, magnesium, zinc, niacin, vitamin B6, and vitamin D3 (dairy-based product; DP) improved self-reported sleep quality (PSQI; Pittsburgh Sleep Quality Index) in apparently healthy Dutch adults with mild-moderate sleep disturbances (Schaafsma et al., 2021). As this supplement contains the prebiotic GOS, it is expected that part of this effect might be explained by modulation of the gut microbiota.
To study the effects of the DP on the gut microbiota in more detail and to gain potential mechanistic insights, full shotgun metagenomics sequencing and microbiota analysis was performed on the faecal samples as obtained in a clinical trial with the DP (Schaafsma et al., 2021). This specifically included the analysis of microbial pathways that have the potential to underly the interaction with the brain, on basis of so-called bioinformatic gut-brain-modules (GMBs) (Valles-Colomer et al., 2019). To investigate the potential role of the gut microbiota in the efficacy of the intervention regarding sleep quality, a responder/non-responder analysis was also performed in which the microbiota composition and function at baseline were determined.
2 Materials and methods
Study design
In a cross-over RCT (three weeks intervention; three weeks washout), adults (n = 70; 30-50 years) with moderate sleep disturbances (Pittsburgh Sleep Quality Index (PSQI) > 9) consumed products 1 h before bed-time (Schaafsma et al., 2021). Faecal samples (DP n = 35; Placebo n = 34) were only collected from the study participants in the first intervention period at baseline (day 0) and after 3 weeks (day 21). Therefore, subjects that received DP in the second intervention period could not be included in the responder/non-responder analyses. A total of 134 faecal samples were sequenced from the intention-to-treat (ITT) set: 33 subjects in the treatment group (DP; dairy-based product containing whey protein, GOS, tryptophan, vitamins and minerals) and 34 subjects in the placebo (skimmed milk powder) group, sampled at day 0 and day 21. The composition of the DP and placebo is specified in Schaafsma et al. (2021). Baseline PSQI scores of the subjects were divided into 3 groups: ‘Good sleepers’ (PSQI scores lower than the median across all subjects at day 0), ‘Median sleepers’ (scores equal to the median), and ‘Bad sleepers’ (scores equal higher than median).
For the responder versus non-responder analysis, ‘responders’ were defined as subjects that showed an improvement in sleep (a decrease in PSQI score) when taking the intervention product in the first intervention period but did not show an improvement when taking the placebo in the second intervention period (n = 15); ‘non-responders’ were defined as subjects who did not show any improvement in PSQI scores after taking either the intervention product in the first intervention period or the placebo in the second intervention period (n = 8). Subjects that showed a response to both the intervention product in the first period and to the placebo in the second period (n = 6), or showed no response to the intervention product in the first period, but did show a response to placebo in the second intervention period (n = 4), were not considered true responders/non-responders and were excluded from the responder versus non-responder analysis.
DNA extraction, library preparation and sequencing
Fecal sampling, storage, and DNA extraction were performed as described previously (Schaafsma et al., 2021). DNA libraries were prepared by Baseclear (Leiden, the Netherlands) with the use of the Nextera XT DNA Library Preparation kit (Illumina, San Diego, CA, USA), according to the manufacturer’s instructions. Sequencing was performed on an Illumina NovaSeq 6000 to obtain at least 5 GB data per sample. Paired FASTQ read sequence files of 2 × 150 bp were generated using bcl2fastq version 2.20 (Illumina). Initial quality assessment was based on data passing the Illumina Chastity filtering. Subsequently, reads containing PhiX control signal were removed using Baseclear’s in-house filtering protocol. In addition, reads containing (partial) adapters were clipped (up to a minimum read length of 50 bp). The second quality assessment was based on the remaining reads using the FastQC quality control tool v0.11.5 (Andrews et al., 2010). Raw sequencing data has been submitted to the European Nucleotide Archive (study accession PRJEB50505).
Microbiota composition and functional pathways
Adaptor removal was performed using cutadapt v2.10 with Trim galore v0.6.6 (Martin, 2011)and quality trimming was performed using fastp v.0.20 keeping reads that had a mean Q score of at least 15 (Chen et al., 2018). Trimmed reads that were at least 70 bp long were mapped against the human genome (GRCh38) using bowtie2 v2.4.1. Alignment results were processed using samtools v1.10 (Li et al., 2009), bedtools v2.29 (Quinlan and Hall, 2010) and sambamba v0.6.6 (Tarasov et al., 2015) in order to remove human host reads and to obtain clean reads. For inference of microbial composition and functional pathways, clean reads were subsampled to 10 million read pairs per sample using seqtk v1.3. Microbial composition was inferred using kraken2 v2.1.1 (Wood et al., 2019) and bracken v2.6.0 (Lu et al., 2017). MetaCyc pathways abundances were obtained using HUMAnN v3.0.0 (Beghini et al., 2021) and converted to copies per million (CPM). The workflow was implemented in Snakemake v5.31.0 (Molder et al., 2021).
Shotgun assembly and profile Hidden Markov Models (pHMM) screening
For assembly, clean reads were subsampled to 10 million read pairs per sample. Subsequently, reads from all samples were co-assembled using megahit v1.2.9 (Li et al., 2015). Contig counts per sample were obtained using SqueezeMeta v1.3.0 (Tamames and Puente-Sanchez, 2018) for all contigs at least 1000 bp long. Each of these contigs was screened with HMMER v3.3.2 (Eddy, 2011) using 303 pHMMs contained in the curated gut-brain modules (GBMs) (Valles-Colomer et al., 2019). These pHMMs were either extracted from or reconstructed based on data (multiple sequence alignments) from KOFAM (Aramaki et al., 2020), TIGRFAM (Li et al., 2021), EGGNOG (Huerta-Cepas et al., 2019) and COG (Tatusov et al., 2000) databases. Per sample contig counts and per contig pHMM hit counts were integrated to obtain per sample pHMM hit counts, which were subsequently converted to per sample abundances of microbial GBMs (Darzi et al., 2016).
Faecal organic acid analysis by HPLC
For organic acid analysis, faecal samples were prepared according to a modified and previously described method (Gommers et al., 2019). 250 mg of homogenised faecal sample was diluted with 1 ml of 1M perchloric acid (HClO4) to extract the organic acids. Lipids and proteins in the faecal sample were removed by centrifugation for 5 min at 20,000
Microbiome diversity and statistical analysis
Alpha-diversity was assessed using the Shannon index calculated with the vegan v.2.5-7 R package (Dixon, 2003). Beta-diversity was quantified using Bray-Curtis dissimilarity calculated using vegan’s vegdist function. Principal Coordinate Analysis was performed on Bray-Curtis distances using the ape v5.5. R package (Paradis and Schliep, 2019). PERMANOVA analyses were performed on the Bray-Curtis distance matrixes using the adonis function of the vegan R package with 10,000 permutations to estimate the proportion of beta-diversity explained by time point, treatment group, and treatment-time interaction, after adjusting for subject age, gender, and BMI. The global change in time in microbial composition was visualised using multilevel Principal Component Analysis (PCA) was performed on centre log-ratio (CLR)-transformed species-level relative abundances using the ‘Subject’ term for the multilevel decomposition for repeated measurements. The CLR-transformation and multilevel PCA were performed using the mixOmics v6.17.26 R package (Rohart et al., 2017).
The effect on the microbiota of the intervention product (DP) compared to the placebo was assessed using linear mixed models (LMMs) implemented using the lme4 v1.1-14 (Bates et al., 2015) and lmerTest v3.1-3 (Kuznetsova et al., 2017) packages. LMMs were constructed with the general formula: Outcome ∼ Treatment * Time + Gender + BMI + Age + (1|Subject), where the primary effect of interest was the interaction effect between Treatment and Time (i.e. ‘did the outcome change differently in time in the treatment group compared to the placebo group?’). Subject was included in the model as random effect to account for the repeated-measures design. Where microbial taxa relative abundances were modelled as outcomes, the abundances were log10-transformed. Cross-sectional correlations were assessed using Spearman’s rho. Pairwise group comparisons were performed using Mann-Whitney U tests. Multiple comparison adjustment was performed using the False Discovery Rate (FDR) controlling procedure of Benjamini-Hochberg to limit the FDR to 5%, unless stated otherwise (Benjamini and Hochberg, 1995). For Bifidobacterium as taxon of primary interest, multiple comparison adjustment was not applied. All taxa that passed a minimal abundance threshold were analysed (the threshold was at least 0.2% mean relative abundance for species, at least 0.5% for genera). All visualisations were produced using ggplot2 v3.3.5 (Wickham, 2016) and ComplexHeatmap v2.11.0 (Gu et al., 2016), and all the analyses were performed using R v4.1.1 (R_Core_Team, 2021).
3 Results
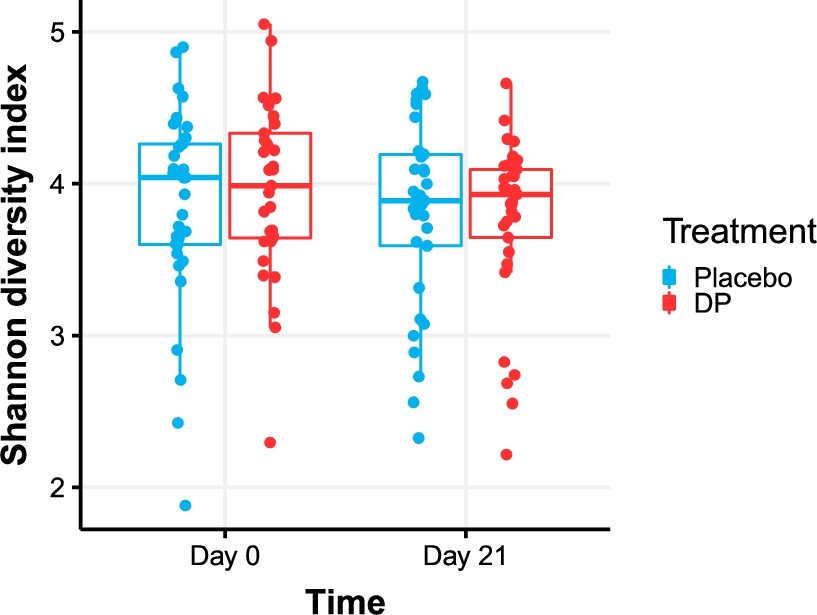
Alpha-diversity
Alpha-diversity as quantified using the Shannon index did not significantly change between day 0 and day 21 (

Shannon diversity in the DP treatment and placebo group at day 0 and day 21.
Citation: Beneficial Microbes 15, 4 (2024) ; 10.1163/18762891-bja00017
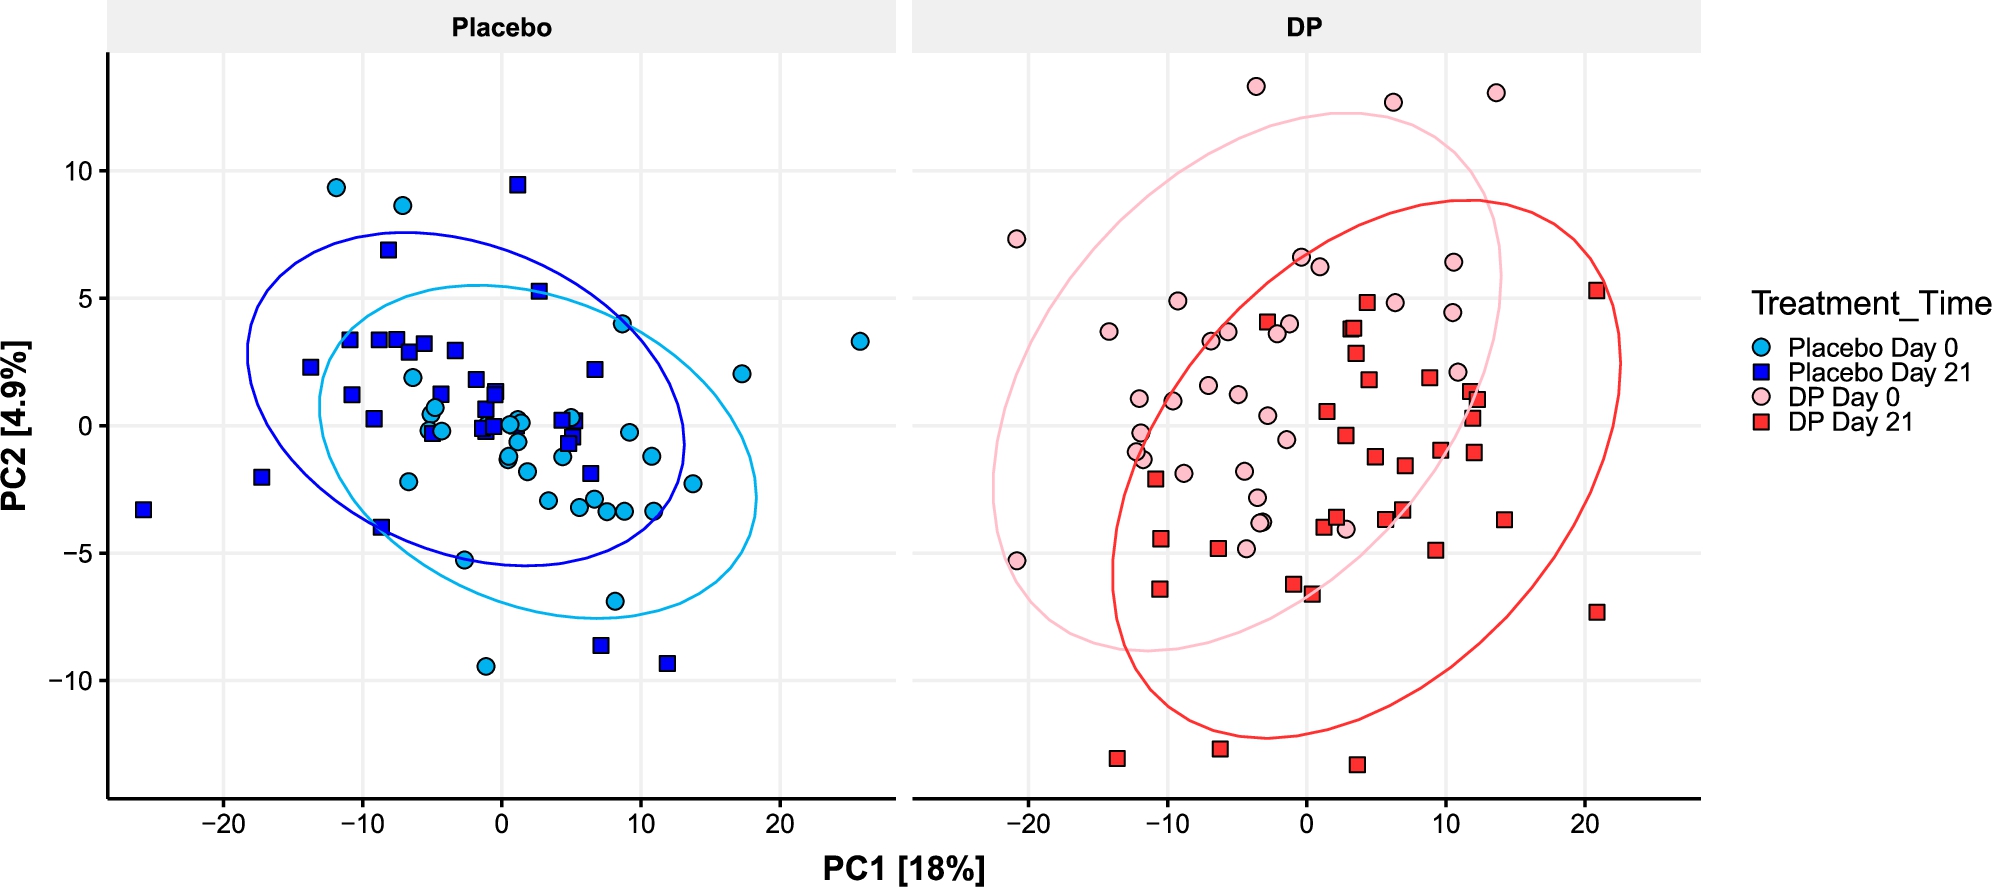
Beta-diversity
Most of the variance in Bray-Curtis dissimilarity modelled using PERMANOVA was explained by the subject (82%,
Multilevel (inter-individual variance was first removed from the ordination) PCA plot of microbial species relative abundance. For visualisation purposes samples were split into two panels, but ordination was performed on all samples together.
Citation: Beneficial Microbes 15, 4 (2024) ; 10.1163/18762891-bja00017
The link between beta-diversity and three PSQI score groups (good, median and bad sleepers), as examined using PERMANOVA, did not explain any significant variance in beta-diversity at day 0 (
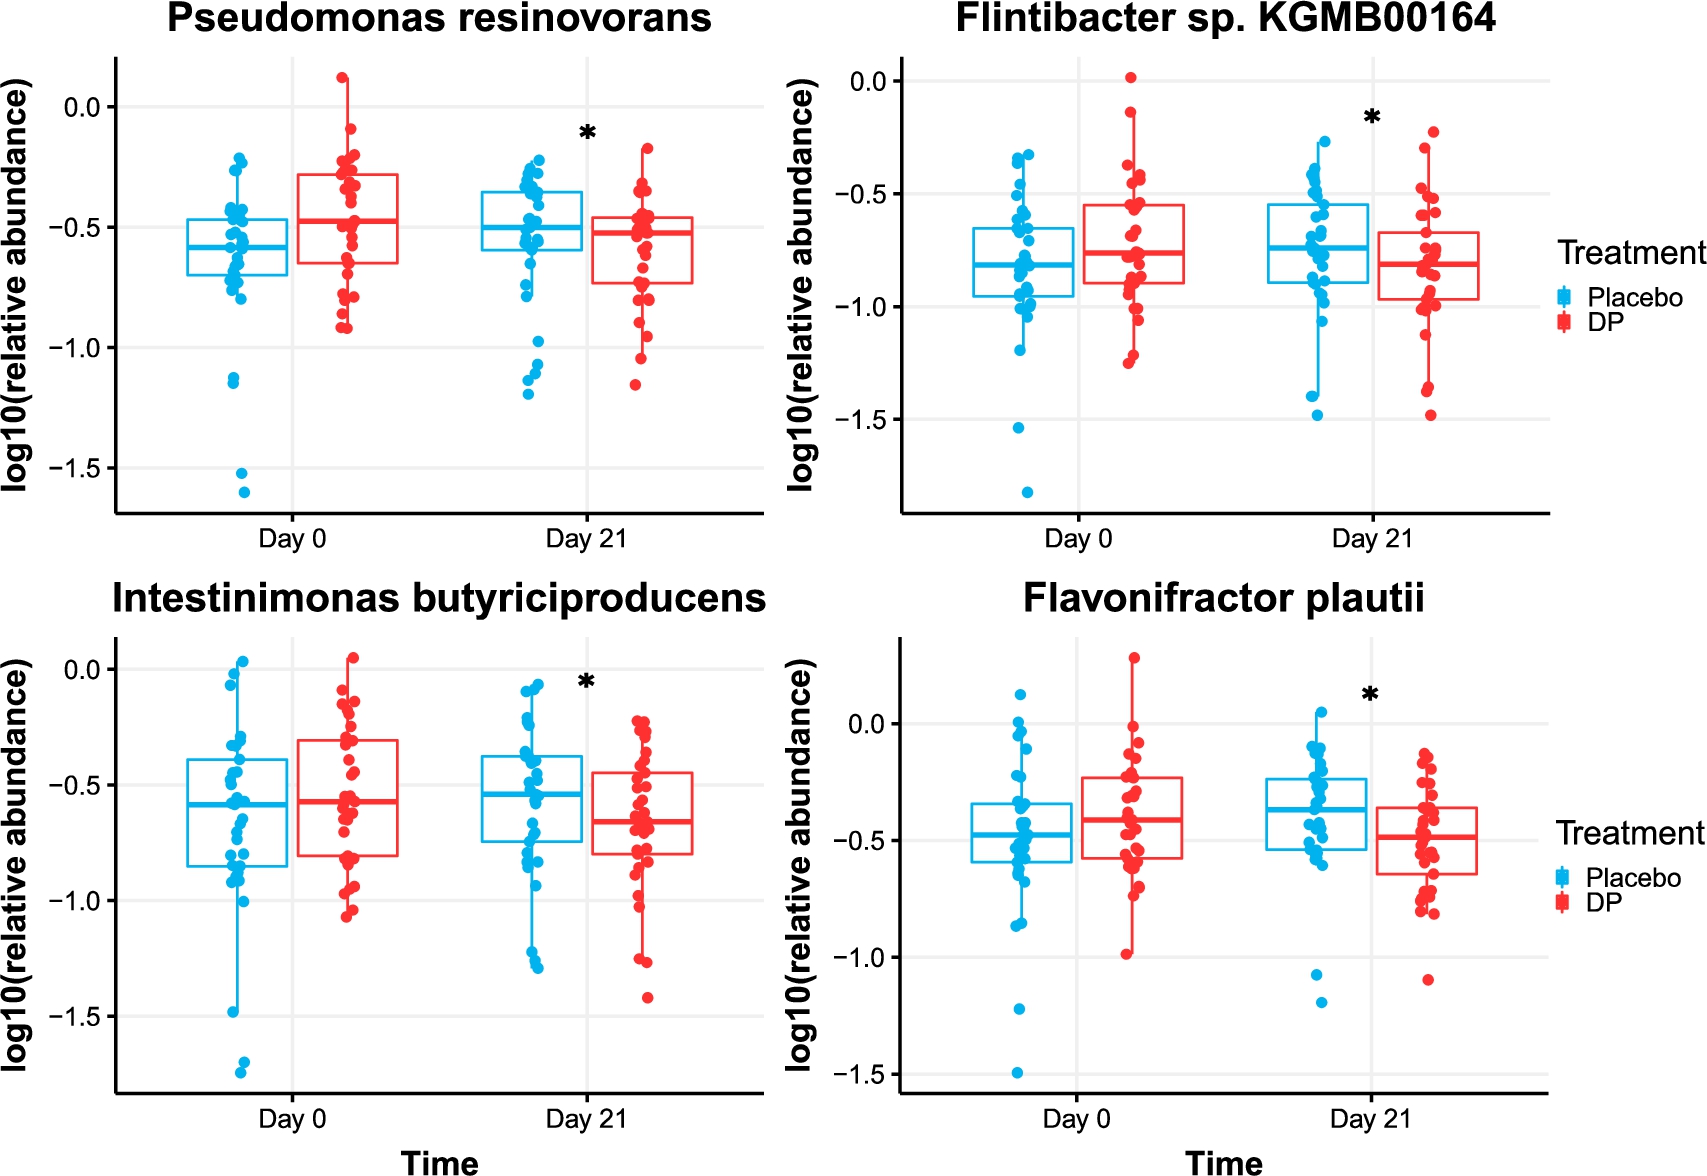
Differential effect of the treatment on microbial taxa and function
Four microbiota species were shown to be differentially affected by the treatment as compared to placebo: Pseudomonas resinovorans, Flintibacter sp. KGMB00164, Intestinimonas butyriciproducens, and Flavonifractor plautii (all
Relative abundance (
Citation: Beneficial Microbes 15, 4 (2024) ; 10.1163/18762891-bja00017
On the functional level, there was no effect of treatment on general (MetaCyc) pathways relative abundance. With respect to the curated Gut-Brain Modules (GBMs), the 56 GBMs in the collection, 50 GMBs had sufficient coverage from pHMM screening hits to be quantified (>60% coverage). Acetate Synthesis III was the only GBM that showed a different temporal pattern, a small decrease in the treatment group as compared to the placebo group (
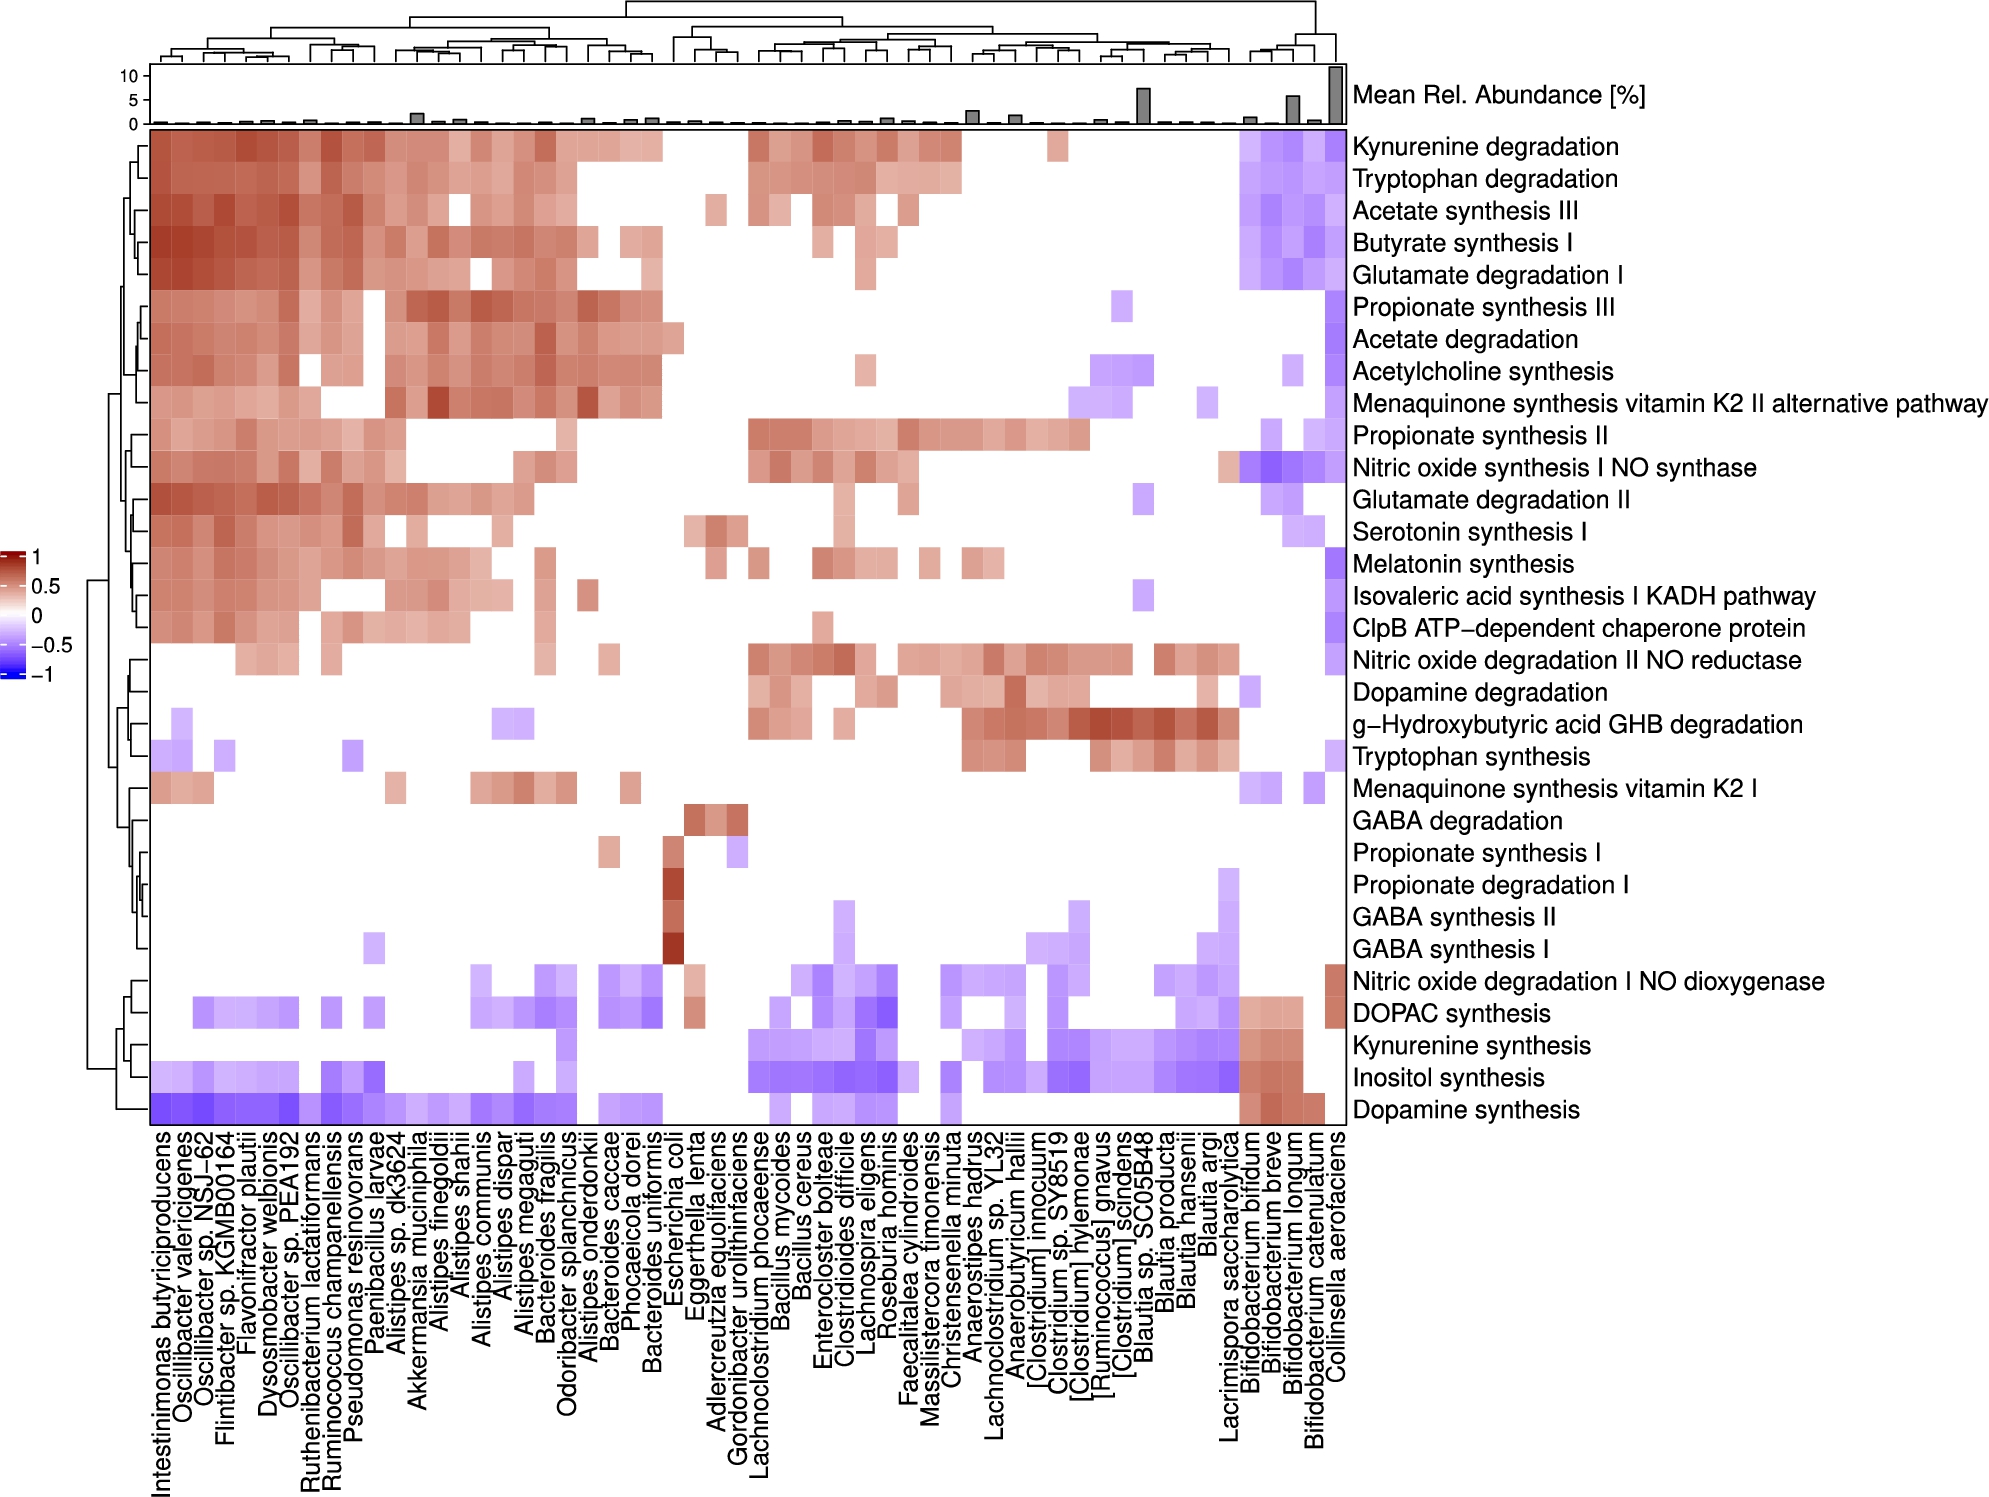
No correlations were found between any of the 50 quantified GBMs and PSQI scores at baseline (
Correlations between GBMs and microbial species abundances at baseline (day 0). Heatmap shows Spearman’s rho coefficients. Annotation on top of the heatmap shows the mean relative abundance of microbial species in these subjects. Both pathways and species are positioned using hierarchical clustering (features with similar correlation profiles are placed closer together).
Citation: Beneficial Microbes 15, 4 (2024) ; 10.1163/18762891-bja00017
Baseline differences between responders and non-responders
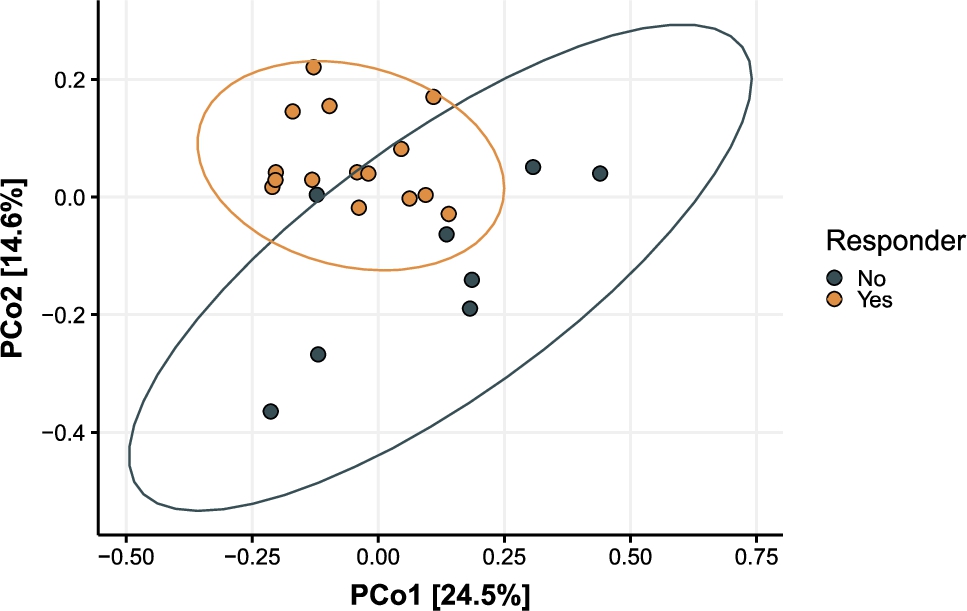
As indicated above, most of the variance in Bray-Curtis dissimilarity was explained by the subject. As this interindividual variance in microbiota composition could have given rise to a heterogenous responsiveness of the subjects in the intervention group, we zoomed in on the differences between responders and non-responders. There were 15 subjects that showed an improvement in PSQI scores after taking the intervention product, but who did not show an improvement after taking the placebo in the subsequent period (responders), whereas 8 subjects did not show any improvement in PSQI scores after taking either the intervention product nor after taking the placebo (non-responders). The baseline (i.e. before treatment) characteristics of the 15 responders were compared to those of the 8 non-responders. Baseline PSQI scores were not significantly different between responders and non-responders (
Plot of PCoA on Bray-Curtis dissimilarity at baseline (day 0). Colours show non-responders (grey) and responders (orange). Numbers in square brackets on the x- and y-axis show the amount of variance explained by the first two principal coordinates.
Citation: Beneficial Microbes 15, 4 (2024) ; 10.1163/18762891-bja00017
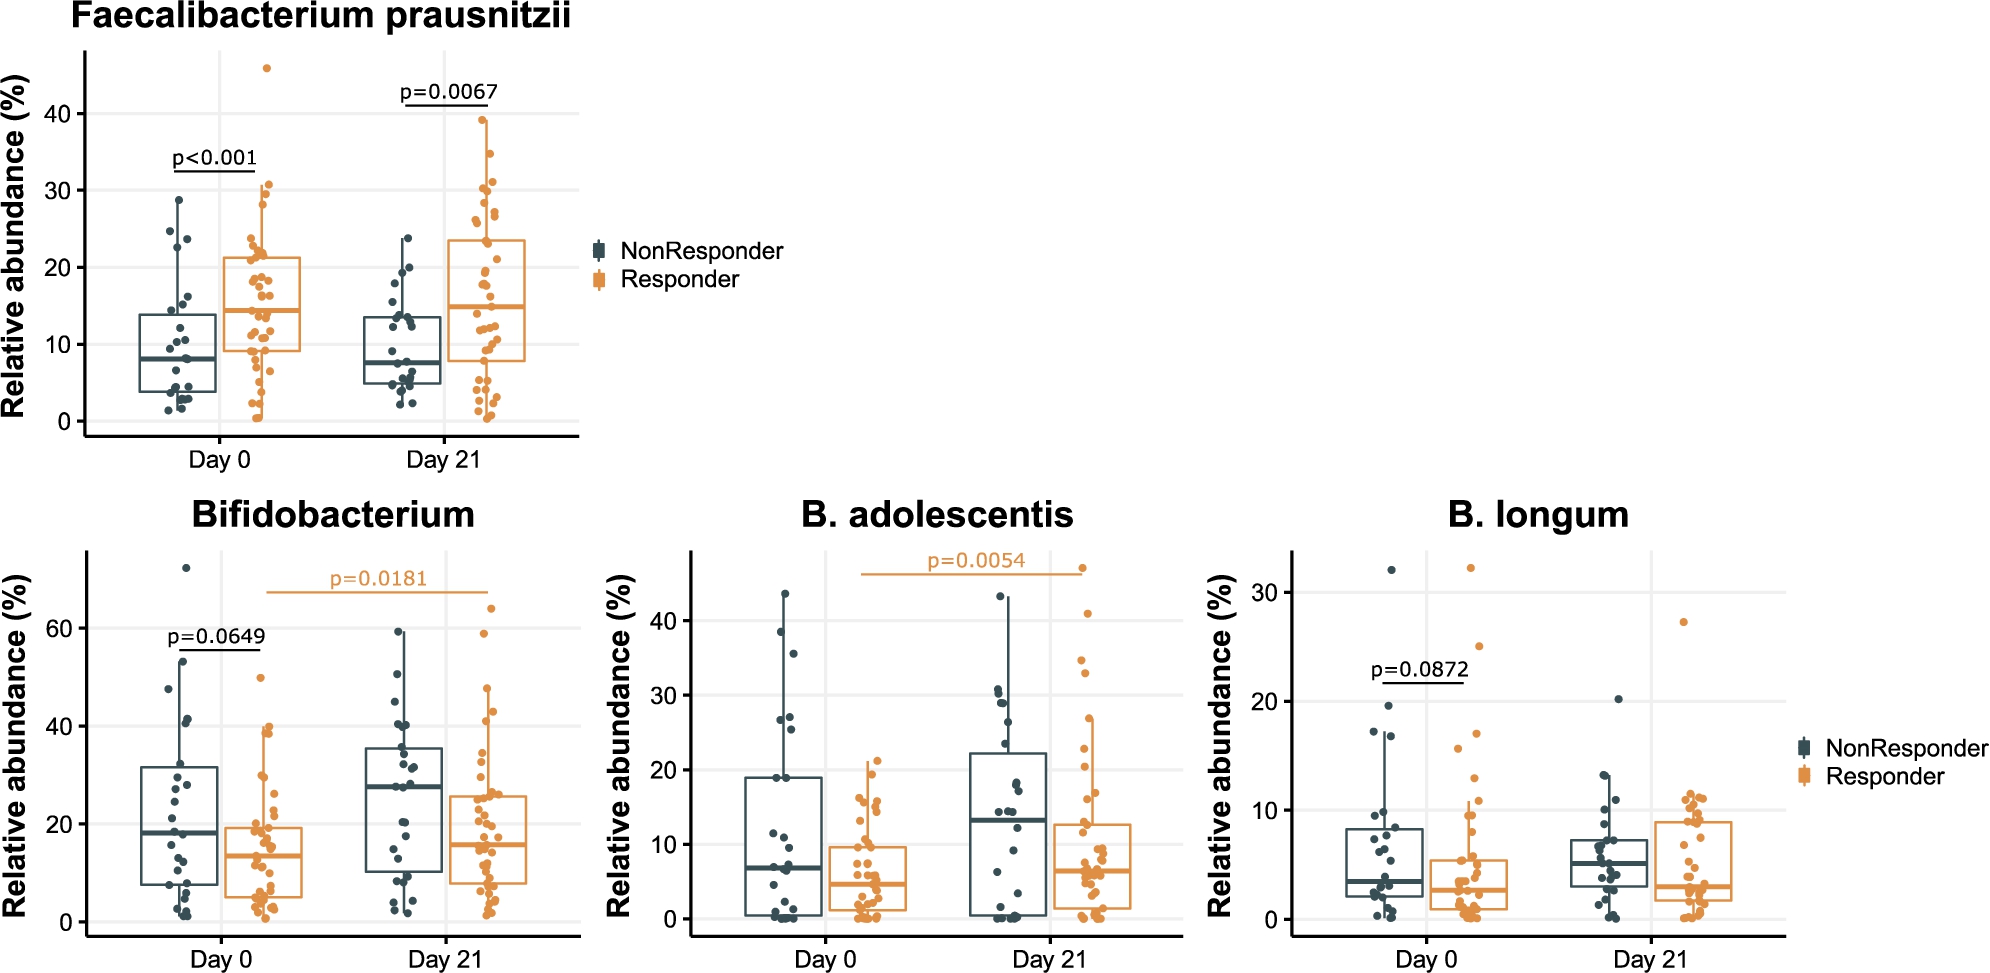
The microbiota composition and functionality of responders and non-responders were significantly different at baseline. The (relative) abundance of Faecalibacterium prausnitzii was significantly different unadjusted
Relative abundance of Faecalibacterium prausnitzii, Bifidobacterium, Bifidobacterium longum and Bifidobacterium adolescentis at baseline (day 0) and at day 21 in responders as compared to non-responders. P-values shown (when <0.1) are the unadjusted p-values of a Mann-Whitney U test (in black) or Wilcoxon signed rank test (in orange).
Citation: Beneficial Microbes 15, 4 (2024) ; 10.1163/18762891-bja00017
The relative abundance of Bifidobacterium was not significantly different at baseline between responders and non-responders, although there was a trend of lower Bifidobacterium genus (unadjusted
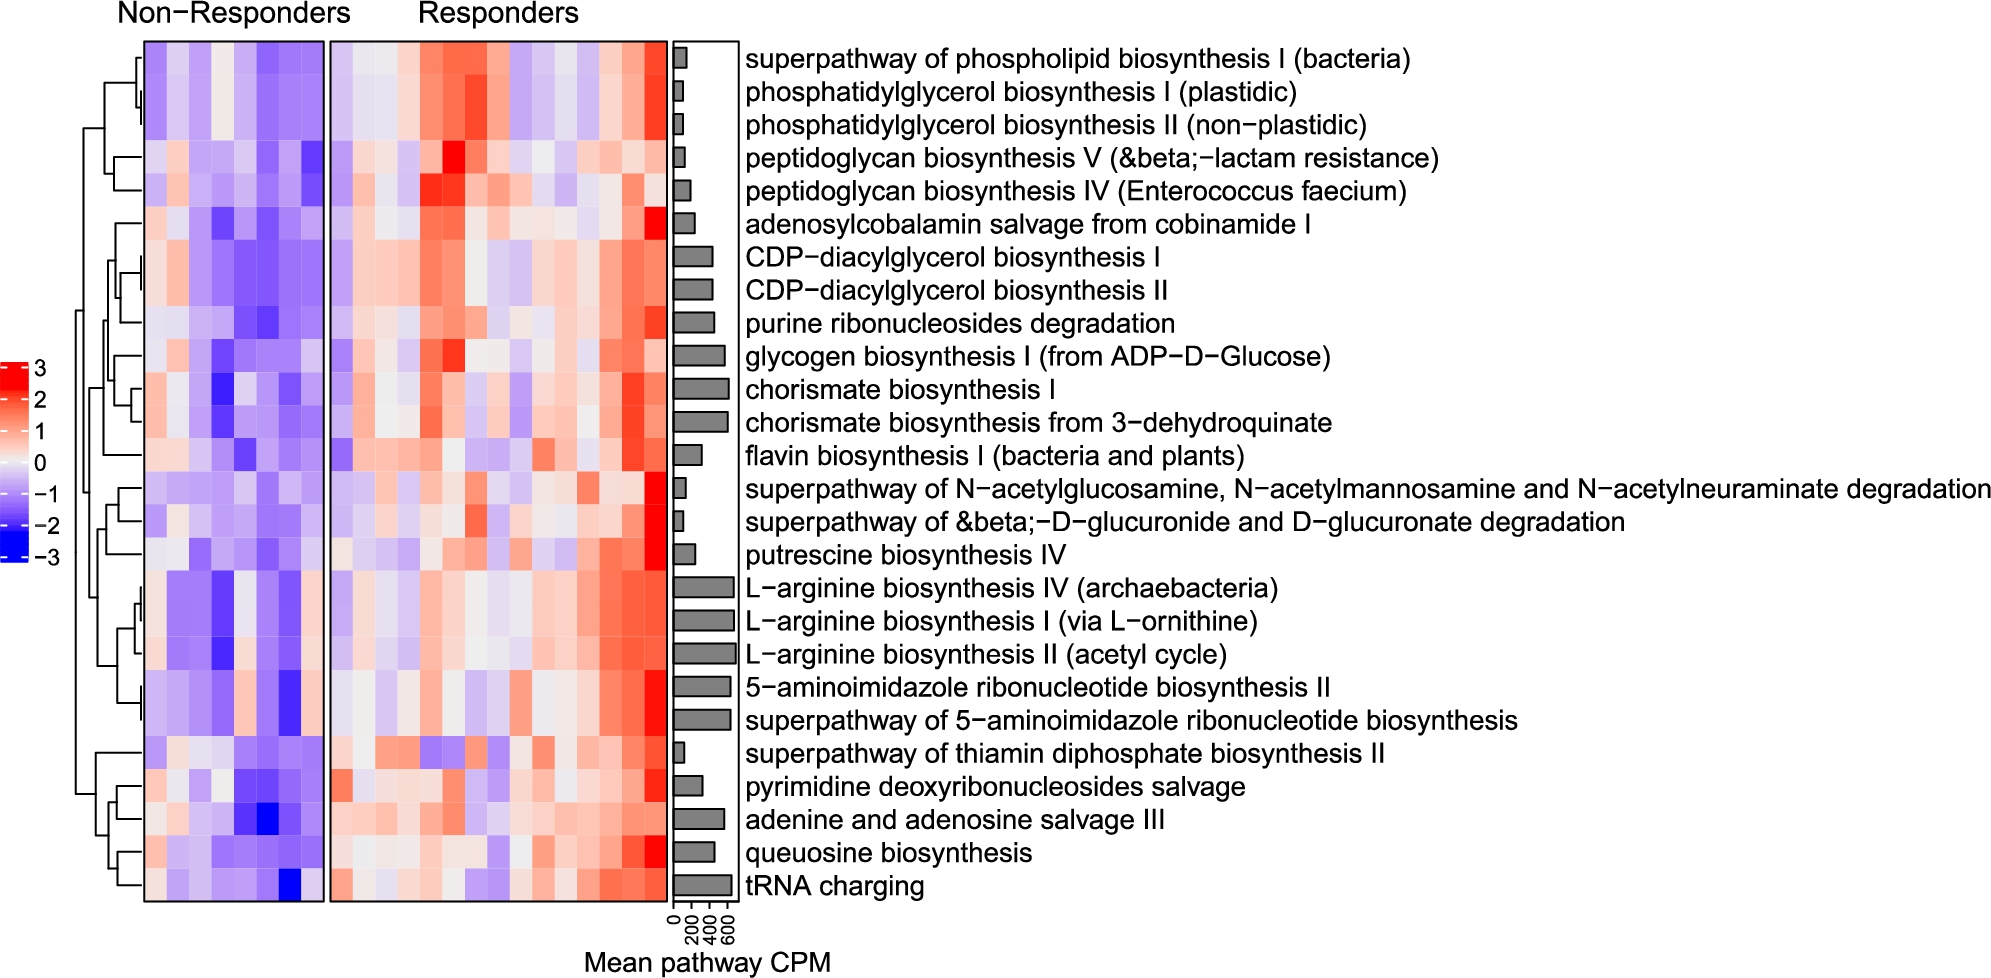
Significant differences were also observed on basis of the microbial pathway profiles of responders and non-responders at baseline. The abundance of 26 MetaCyc pathways were significantly higher in responders at baseline (Figure 7). There were no significant correlations between pathways and PSQI scores at baseline (all
MetaCyc pathways that are significantly different between responders and non-responders at baseline. Pathway abundances are scaled across subjects to zero-mean unit-variance. Annotation on the right side of the heatmap shows mean pathway abundance across all subjects in counts per million. Pathways are positioned using hierarchical clustering (pathways with similar abundance profiles are placed closer together).
Citation: Beneficial Microbes 15, 4 (2024) ; 10.1163/18762891-bja00017
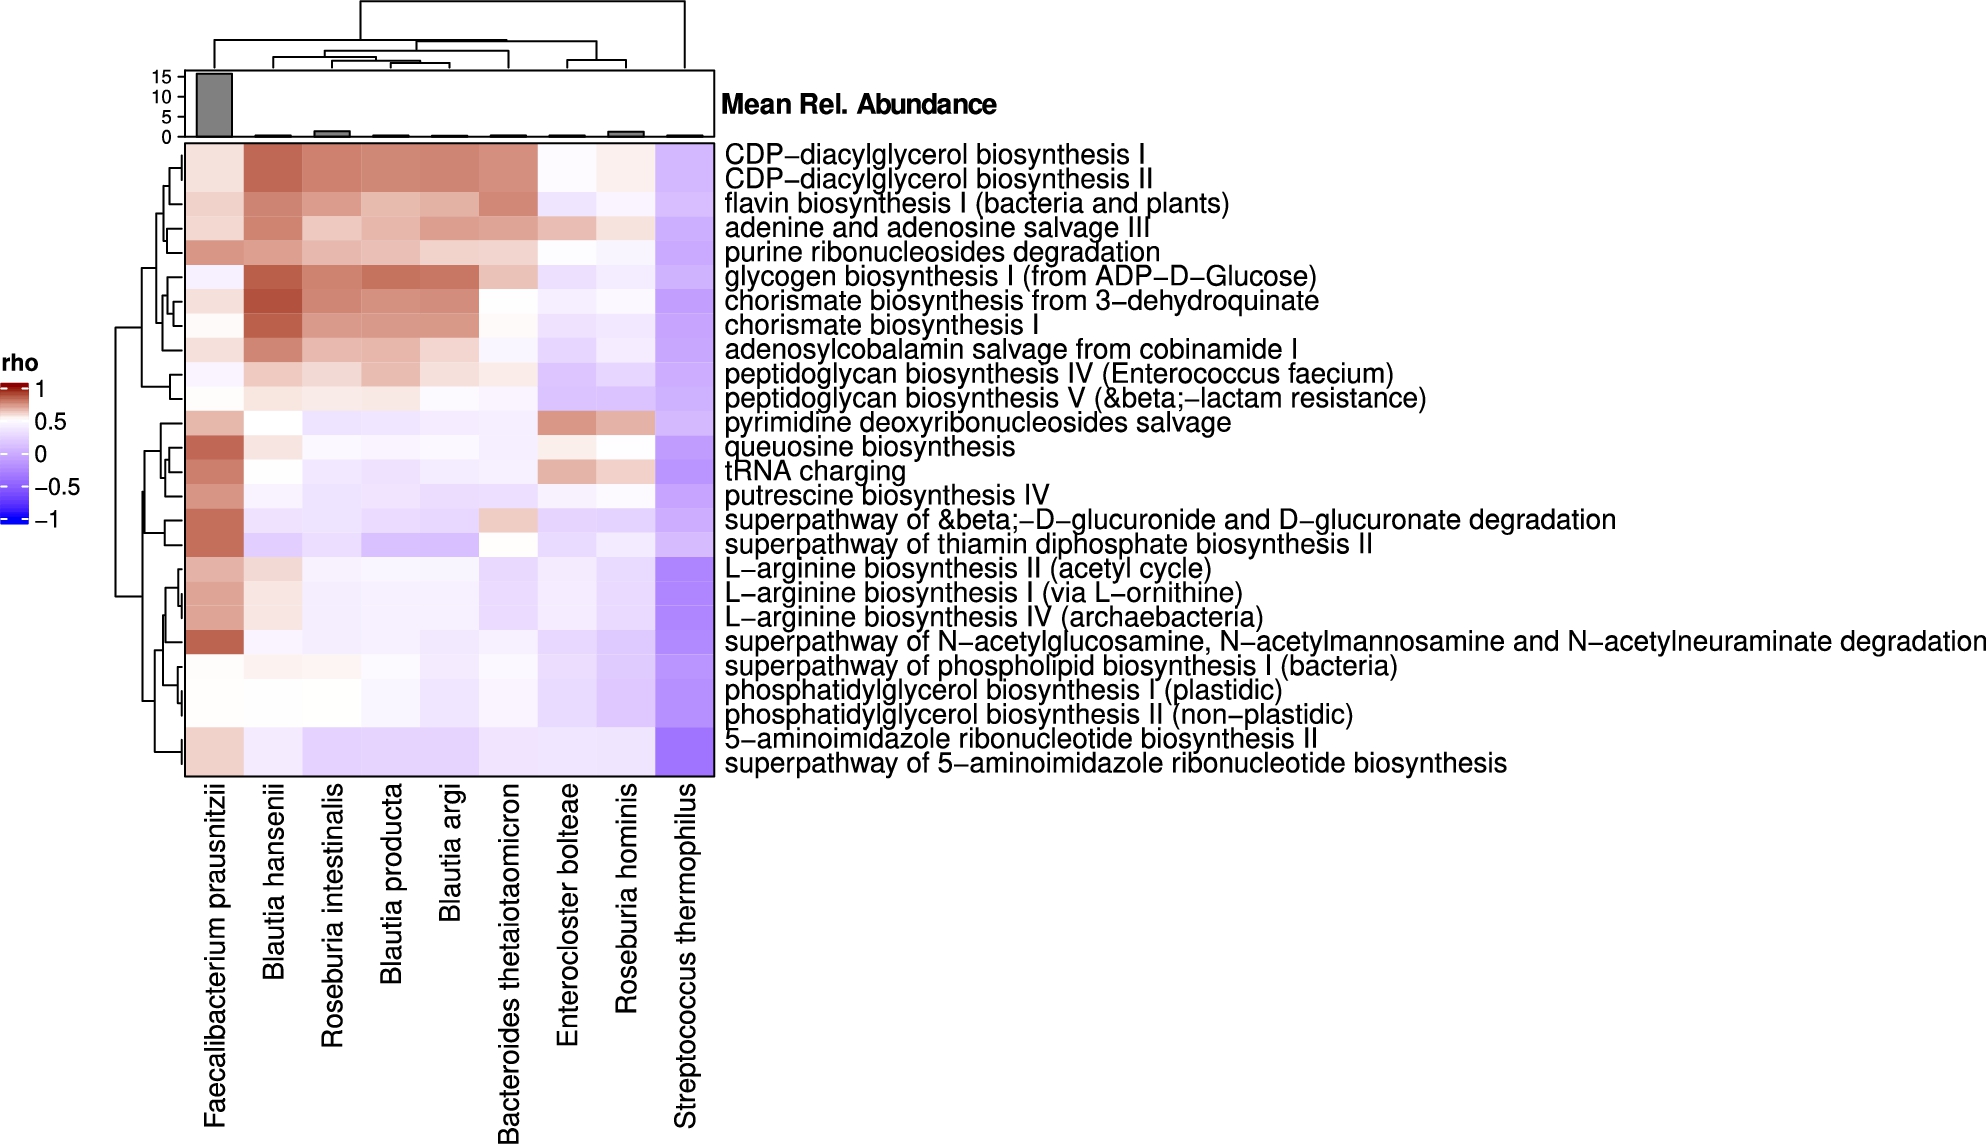
The compositional and functional differences appeared to be coherent on basis of both readouts as very strong correlations were found between the pathways and discriminating microbiota species (including the 9 species that were significantly different at baseline, Figure 8). F. prausnitzii abundance was strongly correlated with several L-arginine biosynthesis pathways and with putresceine biosynthesis, while several Blautia species (B. hansenii, Blautia producta, and Blautia argi), Roseburia intestinalis, and B. thetaiotaomicron showed strong positive correlations with chorismate biosynthesis, CDP-diacylglycerol biosynthesis, and flavin biosynthesis.
Correlations between the discriminating microbiota species and MetaCyc pathways significantly different between responders and non-responder at baseline (day 0). Heatmap shows Spearman’s rho values. Annotation on top of the heatmap shows the mean relative abundance of microbial species. Both pathways and species are positioned using hierarchical clustering (features with similar correlation profiles are placed closer together).
Citation: Beneficial Microbes 15, 4 (2024) ; 10.1163/18762891-bja00017
4 Discussion
In this study, the effects on gut microbiota composition and function of a dairy-based product (DP) containing whey protein and galacto-oligosaccharides (GOS), that was shown to improve sleep and stress in healthy subjects with moderate sleep disturbances, were assessed (Schaafsma et al., 2021).
A statistically significant shift in microbiota composition was observed in the treatment group, not in the placebo group. Species that showed a slight but significant decrease were P. resinovorans, Flintibacter sp. KGM00164, I. butyriciproducens, and F. plautii. Although the latter three are phylogenetically closely related and butyrate producers (Kläring et al., 2013; Louis et al., 2019), no decrease in faecal butyrate could be discerned. This could be due to a limitation of faecal SCFA measurements, reflecting the net production, consumption and absorption. On the genus level, Pseudomonas, of which the relative abundance in the colonic mucosa has been shown to be higher in short sleepers compared to normal sleepers, showed a decrease in the treatment group (Agrawal et al., 2021). As reported before (Schaafsma et al., 2021), an (non-significant) increase of Bifidobacterium in the treatment group was also observed. The prebiotic GOS, an ingredient of the DP, has been shown to result in an increased Bifidobacterium abundance and reduced stress (5.5 g daily for 4 weeks), although it did not significantly improve sleep quality (Johnstone et al., 2021) in a study population with on average lower PSQI scores. In studies with mice subjected to sleep deprivation/fragmentation lower levels of Bifidobacteriaceae were reported (Han et al., 2022) and the administration of Bifidobacterium strains were shown to improve sleep quality in several studies (Haarhuis et al., 2022). Analysis of specific microbiota functions/pathways that have the potential to interact with the brain, collected in the bioinformatic GMBs (Valles-Colomer et al., 2019), showed that the GMB Acetate Synthesis III (acetate formation from acetyl-CoA III) decreased slightly in the treatment group, but no significant effect was observed for two other acetate synthesis GMBs (Acetate Synthesis I and Acetate Synthesis II).
As the interindividual variance in microbiota composition (and potentially function) could have given rise to a heterogenous responsiveness of the subjects in the intervention group, we zoomed in on a subset of responders and non-responders. Remarkably, responder/non-responder explained 10% of the variance in Bray-Curtis dissimilarity at baseline, indicating a large difference in microbiota composition. The relative abundance of B. longum and B. adolescentis was about 3-7 times lower in responders as compared to non-responders. An increase over time within responders of the Bifidobacterium genus and specifically of B. adolescentis, but not of B. longum was observed. This finding suggests that a relatively low baseline Bifidobacterium abundance is a predictor for sleep improvement by the DP.
The effectiveness, however, seems to also depend on the relative abundance of additional microbiota species as another significantly distinct difference was found for the baseline relative abundance of F. prausnitzii, being about 3 times higher in responders. F. prausnitzii has shown its potential as an anxiety reducing probiotic in rats (Hao et al., 2019), supporting the hypothesis that a link between specifically this species and the brain exists. Also with respect to sleep, as patients with chronic insomnia where shown to have a lower abundance of Faecalibacterium as compared to healthy controls (Han et al., 2022; Li et al., 2020). The relative abundance of Faecalibacterium was also lower in children with autism spectrum disorder (ASD) and a sleep disorder, compared to ASD children with no sleep disorder (Han et al., 2022; Hua et al., 2020), and correlated with (lower) faecal melatonin concentration. We did not find differences in the abundance of the GMB for microbial synthesis of melatonin. However, melatonin and its precursor serotonin can also be produced by enterochromaffin cells in the gut (Chen et al., 2011) and gut microbes have been shown to be able to modulate their host’s serotonin production (Agus et al., 2018). Putatively, the microbiota composition (shift) in responders could positively modulate the intestinal production of serotonin and/or melatonin, as the DP contains tryptophan, for which it has been shown that it increases circulating melatonin levels after oral administration in animal studies (Chen et al., 2011).
On the functional level, 26 MetaCyc pathways were shown to be more abundant in responders at baseline. Most notable is the higher abundance of the 3 l-arginine- and putrescine biosynthesis pathways at baseline, that positively correlated with F. prausnitzii relative abundance. L-arginine, a precursor of nitric oxide (NO), can protect against REM sleep deprivation-induced hypertension and endothelial dysfunction in rats (Jiang et al., 2017), and decreased levels of circulating NO and L-arginine have been associated with sleep apnea (Lavie et al., 2003). Putrescine, that can be produced from arginine by the commensal microbiota (Nakamura et al., 2019), can serve as precursor for GABA synthesis by specific bacteria such as Escherichia coli (Wu et al., 2017) The correlation analysis between GMBs and microbiota species relative abundances indeed showed a correlation between GABA synthesis and E. coli, but not between GABA synthesis and Bifidobacterium spp. Nevertheless, Bifidobacterium species and strains have been reported to be capable of producing GABA in vitro (Barrett et al., 2012; Strandwitz et al., 2019; Yunes et al., 2016)). The only GMB that was significantly different between responders and non-responders was quinolinic acid degradation, being higher in the latter group. Interestingly, sleep loss has been associated with higher levels of inflammation and kynurenine metabolism which increases the formation of the neurotoxic quinolinic acid (Bhat et al., 2020). Higher microbial quinolinic acid degradation activity could result in lower faecal levels of quinolinic acid but this is highly speculative as we did not measure quinolinic acid in the faeces.
In summary, modest effects of the DP enriched with, amongst others, GOS and tryptophan were observed on gut microbiota composition and function. Remarkably, a significant difference in overall gut microbiota composition at baseline between responders and non-responders to the dietary intervention was revealed, which could be attributed mainly to a higher relative abundance of F. prausnitzii and a lower relative abundance of B. longum and B. adolescentis in responders. Only in responders, Bifidobacterium increased due to the supplementation, the relative abundance of F. prausnitzii did not change. This may suggest a (cross-feeding) role for Bifidobacterium in the positive response regarding sleep, when a sufficient amount of F. prausnitzii is present. These insights could give direction to the design of dedicated dietary interventions to improve sleep quality and in revealing underlying mechanisms in follow-up studies.
Corresponding author; e-mail: arjen.nauta@frieslandcampina.com
Supplementary material
Supplementary material is available online at: https://doi.org/10.6084/m9.figshare.25912324
Figure S1. LMM estimates for Shannon index as outcome.
Figure S2. LMM estimates for PSQI as outcome with Shannon index as a fixed effect.
Figure S3. Bray-Curtis dissimilarity Principal Coordinate Analysis (PCoA) plot stratified by treatment group.
Figure S4. Plot of Principal Coordinate Analysis (PCoA) of Bray-Curtis dissimilarity in subjects at day 0 stratified by PSQI-based sleep quality groups: ‘Good sleepers’ (PSQI scores lower than the median across all subjects at day 0), ‘Median sleepers’ (scores equal to the median), and ‘Bad sleepers’ (scores higher than median).
Figure S5. Plot of Principal Coordinate Analysis (PCoA) of MetaCyc pathways abundance in subjects at day 0 stratified by PSQI-based sleep quality groups: ‘Good sleepers’ (PSQI scores lower than the median across all subjects at day 0), ‘Median sleepers’ (scores equal to the median), and ‘Bad sleepers’ (scores equal higher than median).
Figure S6. Log10-transformed relative abundance of Bifidobacterium genus at day 0 and day.
Figure S7. Relative abundance of the Acetate synthesis III GBM at day 0 and day 21 stratified by treatment group.
Figure S8. PSQI scores at day 0 in responders compared to non-responders.
Figure S9. Relative abundance of the Quinolinic acid GBM at day 0 in responders and non-responders.
Acknowledgements
We would like to thank Andrei Prodan and Hernando Suarez for supporting the microbiome analyses. In addition, we would like to thank Alwine Kardinaal, Maartje van den Belt, Esther Floris and Jouke Veldman for their contribution to the preceding clinical trial, as well as all participants.
Authors’ contributions
All authors made a significant contribution to the work reported, whether that is in the conception, study design, execution, acquisition of data, analysis and interpretation, or in all these areas: took part in drafting, revising or critically reviewing the article; gave final approval of the version to be published; have agreed on the journal to which the article has been submitted; and agree to be accountable for all aspects of the work.
Conflict of interest
This research was funded by FrieslandCampina, Amersfoort, The Netherlands. FrieslandCampina holds a patent position on the dairy-based product that was applied during the cross-over intervention study (WO2020078718A1). Arjen Nauta, Anne Schaafsma, and Leonard Mallee are employees of FrieslandCampina.
Ethics approval and informed consent
The study was conducted according to the guidelines of the Declaration of Helsinki, and approved by the METC-Wageningen University, Wageningen, the Netherlands, on 6 September 2019. Dossier NL70673.081.19, METC nr 19/17 (Schaafsma et al., 2021).
Data availability
Raw sequencing data has been submitted to the European Nucleotide Archive (study accession PRJEB50505).
References
Agrawal, R., Ajami, N.J., Malhotra, S., Chen, L., White, D.L., Sharafkhaneh, A., Hoffman, K.L., Graham, D.Y., El-Serag, H.B., Petrosino, J.F. and Jiao, L., 2021. Habitual sleep duration and the colonic mucosa-associated gut microbiota in humans – a pilot study. Clocks & Sleep 3: 387-397.
Agus, A., Planchais, J. and Sokol, H., 2018. Gut microbiota regulation of tryptophan metabolism in health and disease. Cell Host Microbe 23: 716-724. https://doi.org/10.1016/j.chom.2018.05.003
Andrews, S., Krueger, F., Segonds-Pichon, A., Biggins, L., Krueger, C. and Wingett, S., 2010. FastQC a quality control tool for high throughput sequence data. Babraham Bioinformatics. Available at: https://www.scienceopen.com/book?vid=45910064-0c10-468b-8ac3-025edade0c9d
Aramaki, T., Blanc-Mathieu, R., Endo, H., Ohkubo, K., Kanehisa, M., Goto, S. and Ogata, H., 2020. KofamKOALA: KEGG Ortholog assignment based on profile HMM and adaptive score threshold. Bioinformatics 36: 2251-2252. https://doi.org/10.1093/bioinformatics/btz859
Barrett, E., Ross, R.P., O’Toole, P.W., Fitzgerald, G.F. and Stanton, C., 2012. gamma-Aminobutyric acid production by culturable bacteria from the human intestine. Journal of Applied Microbiology 113: 411-417. https://doi.org/10.1111/j.1365-2672.2012.05344.x
Bates, D., Mächler, M., Bolker, B. and Walker, S., 2015. Fitting linear mixed-effects models using lme4. Journal of Statistical Software 67: 1-48. https://doi.org/10.18637/jss.v067.i01
Beghini, F., McIver, L.J., Blanco-Miguez, A., Dubois, L., Asnicar, F., Maharjan, S., Mailyan, A., Manghi, P., Scholz, M., Thomas, A.M., Valles-Colomer, M., Weingart, G., Zhang, Y., Zolfo, M., Huttenhower, C., Franzosa, E.A. and Segata, N., 2021. Integrating taxonomic, functional, and strain-level profiling of diverse microbial communities with bioBakery 3. Elife 10: e65088. https://doi.org/10.7554/eLife.65088
Benedict, C., Vogel, H., Jonas, W., Woting, A., Blaut, M., Schurmann, A. and Cedernaes, J., 2016. Gut microbiota and glucometabolic alterations in response to recurrent partial sleep deprivation in normal-weight young individuals. Molecular Metabolism 5: 1175-1186. https://doi.org/10.1016/j.molmet.2016.10.003
Benjamini, Y. and Hochberg, Y., 1995. Controlling the false discovery rate: a practical and powerful approach to multiple testing. Journal of the Royal Statistical Society Series B 57: 289-300.
Bhat, A., Pires, A.S., Tan, V., Babu Chidambaram, S. and Guillemin, G.J., 2020. Effects of sleep deprivation on the tryptophan metabolism. International Journal of Tryptophan Research 13: 1178646920970902. https://doi.org/10.1177/1178646920970902
Chattu, V.K., Manzar, M.D., Kumary, S., Burman, D., Spence, D.W. and Pandi-Perumal, S.R., 2018. The global problem of insufficient sleep and its serious public health implications. Healthcare 7: 1. https://doi.org/10.3390/healthcare7010001
Chen, C.Q., Fichna, J., Bashashati, M., Li, Y.Y. and Storr, M., 2011. Distribution, function and physiological role of melatonin in the lower gut. World Journal of Gastroenterology 17: 3888-3898.
Chen, S., Zhou, Y., Chen, Y. and Gu, J., 2018. fastp: an ultra-fast all-in-one FASTQ preprocessor. Bioinformatics 34: i884-i890. https://doi.org/10.1093/bioinformatics/bty560
Cryan, J.F., O’Riordan, K.J., Cowan, C.S.M., Sandhu, K.V., Bastiaanssen, T.F.S., Boehme, M., Codagnone, M.G., Cussotto, S., Fulling, C., Golubeva, A.V., Guzzetta, K.E., Jaggar, M., Long-Smith, C.M., Lyte, J.M., Martin, J.A., Molinero-Perez, A., Moloney, G., Morelli, E., Morillas, E., O’Connor, R., Cruz-Pereira, J.S., Peterson, V.L., Rea, K., Ritz, N.L., Sherwin, E., Spichak, S., Teichman, E.M., van de Wouw, M., Ventura-Silva, A.P., Wallace-Fitzsimons, S.E., Hyland, N., Clarke, G. and Dinan, T.G., 2019. The microbiota-gut-brain axis. Physiological Reviews 99: 1877-2013. https://doi.org/10.1152/physrev.00018.2018
Darzi, Y., Falony, G., Vieira-Silva, S. and Raes, J., 2016. Towards biome-specific analysis of meta-omics data. ISME Journal 10: 1025-1028. https://doi.org/10.1038/ismej.2015.188
Dixon, P., 2003. VEGAN, A package of R functions for community ecology. Journal of Vegetation Science 14: 927-930.
Eddy, S.R., 2011. Accelerated profile HMM searches. PLoS Computational Biology 7: e1002195. https://doi.org/10.1371/journal.pcbi.1002195
Gommers, L.M.M., Ederveen, T.H.A., van der Wijst, J., Overmars-Bos, C., Kortman, G.A.M., Boekhorst, J., Bindels, R.J.M., de Baaij, J.H.F. and Hoenderop, J.G.J., 2019. Low gut microbiota diversity and dietary magnesium intake are associated with the development of PPI-induced hypomagnesemia. FASEB Journal 33: 11235-11246. https://doi.org/10.1096/fj.201900839R
Gu, Z., Eils, R. and Schlesner, M., 2016. Complex heatmaps reveal patterns and correlations in multidimensional genomic data. Bioinformatics 32: 2847-2849. https://doi.org/10.1093/bioinformatics/btw313
Haarhuis, J.E., Kardinaal, A. and Kortman, G.A.M., 2022. Probiotics, prebiotics and postbiotics for better sleep quality: a narrative review. Beneficial Microbes 13: 169-182. https://doi.org/10.3920/BM2021.0122
Han, M., Yuan, S. and Zhang, J., 2022. The interplay between sleep and gut microbiota. Brain Research Bulletin 180: 131-146. https://doi.org/10.1016/j.brainresbull.2021.12.016
Hao, Z., Wang, W., Guo, R. and Liu, H., 2019. Faecalibacterium prausnitzii (ATCC 27766) has preventive and therapeutic effects on chronic unpredictable mild stress-induced depression-like and anxiety-like behavior in rats. Psychoneuroendocrinology 104: 132-142.
Hua, X., Zhu, J., Yang, T., Guo, M., Li, Q., Chen, J. and Li, T., 2020. The gut microbiota and associated metabolites are altered in sleep disorder of children with autism spectrum disorders. Frontiers in Psychiatry 11: 855. https://doi.org/10.3389/fpsyt.2020.00855
Huerta-Cepas, J., Szklarczyk, D., Heller, D., Hernandez-Plaza, A., Forslund, S.K., Cook, H., Mende, D.R., Letunic, I., Rattei, T., Jensen, L.J., von Mering, C. and Bork, P., 2019. eggNOG 5.0: a hierarchical, functionally and phylogenetically annotated orthology resource based on 5090 organisms and 2502 viruses. Nucleic Acids Research 47: D309-D314. https://doi.org/10.1093/nar/gky1085
Jiang, J., Gan, Z., Li, Y., Zhao, W., Li, H., Zheng, J.P. and Ke, Y., 2017. REM sleep deprivation induces endothelial dysfunction and hypertension in middle-aged rats: Roles of the eNOS/NO/cGMP pathway and supplementation with L-arginine. PLoS ONE 12: e0182746. https://doi.org/10.1371/journal.pone.0182746
Johnstone, N., Milesi, C., Burn, O., van den Bogert, B., Nauta, A., Hart, K., Sowden, P., Burnet, P.W.J. and Cohen Kadosh, K., 2021. Anxiolytic effects of a galacto-oligosaccharides prebiotic in healthy females (18-25 years) with corresponding changes in gut bacterial composition. Science Reports 11: 8302. https://doi.org/10.1038/s41598-021-87865-w
Kläring, K., Hanske, L., Bui, N., Charrier, C., Blaut, M., Haller, D., Plugge, C.M. and Clavel, T., 2013. Intestinimonas butyriciproducens gen. nov., sp. nov., a butyrate-producing bacterium from the mouse intestine. International Journal of Systematic and Evolutionary Microbiology 63: 4606-4612.
Kuznetsova, A., Brockhoff, P.B. and Christensen, R.H.B., 2017. lmerTest package: tests in linear mixed effects models. Journal of Statistical Software 82: 1-26. https://doi.org/10.18637/jss.v082.i13
Lavie, L., Hefetz, A., Luboshitzky, R. and Lavie, P., 2003. Plasma levels of nitric oxide and L-arginine in sleep apnea patients: effects of nCPAP treatment. Journal of Molecular Neuroscience 21: 57-63. https://doi.org/10.1385/JMN:21:1:57
Li, D., Liu, C.M., Luo, R., Sadakane, K. and Lam, T.W., 2015. MEGAHIT: an ultra-fast single-node solution for large and complex metagenomics assembly via succinct de Bruijn graph. Bioinformatics 31: 1674-1676. https://doi.org/10.1093/bioinformatics/btv033
Li, H., Handsaker, B., Wysoker, A., Fennell, T., Ruan, J., Homer, N., Marth, G., Abecasis, G. and Durbin, R., 2009. The Sequence Alignment/Map format and SAMtools. Bioinformatics 25: 2078-2079. https://doi.org/10.1093/bioinformatics/btp352
Li, W., O’Neill, K.R., Haft, D.H., DiCuccio, M., Chetvernin, V., Badretdin, A., Coulouris, G., Chitsaz, F., Derbyshire, M.K., Durkin, A.S., Gonzales, N.R., Gwadz, M., Lanczycki, C.J., Song, J.S., Thanki, N., Wang, J., Yamashita, R.A., Yang, M., Zheng, C., Marchler-Bauer, A. and Thibaud-Nissen, F., 2021. RefSeq: expanding the Prokaryotic Genome Annotation Pipeline reach with protein family model curation. Nucleic Acids Research 49: D1020-D1028. https://doi.org/10.1093/nar/gkaa1105
Li, Y., Zhang, B., Zhou, Y., Wang, D., Liu, X., Li, L., Wang, T., Zhang, Y., Jiang, M., Tang, H., Amsel, L.V., Fan, F. and Hoven, C.W., 2020. Gut microbiota changes and their relationship with inflammation in patients with acute and chronic insomnia. Nature and Science of Sleep 12: 895-905. https://doi.org/10.2147/NSS.S271927
Louis, P., Lo, G., Kramer, T. and Duncan, S.H., 2019. Flintibacter, Bergey’s Manual of Systematics of Archaea and Bacteria, pp. 1-9. https://doi.org/10.1002/9781118960608.gbm01734
Lu, J., Breitwieser, F.P., Thielen, P. and Salzberg, S.L., 2017. Bracken: estimating species abundance in metagenomics data. PeerJ Computer Science 3: e104. https://doi.org/10.7717/peerj-cs.104
Martin, M., 2011. Cutadapt removes adapter sequences from high-throughput sequencing reads. EMBnet.journal 17: 10-12. https://doi.org/10.14806/ej.17.1.200
Matenchuk, B.A., Mandhane, P.J. and Kozyrskyj, A.L., 2020. Sleep, circadian rhythm, and gut microbiota. Sleep Medicine Reviews 53: 101340. https://doi.org/10.1016/j.smrv.2020.101340
Molder, F., Jablonski, K.P., Letcher, B., Hall, M.B., Tomkins-Tinch, C.H., Sochat, V., Forster, J., Lee, S., Twardziok, S.O., Kanitz, A., Wilm, A., Holtgrewe, M., Rahmann, S., Nahnsen, S. and Koster, J., 2021. Sustainable data analysis with Snakemake. F1000Research 10: 33. https://doi.org/10.12688/f1000research.29032.2
Nakamura, A., Ooga, T. and Matsumoto, M., 2019. Intestinal luminal putrescine is produced by collective biosynthetic pathways of the commensal microbiome. Gut Microbes 10: 159-171. https://doi.org/10.1080/19490976.2018.1494466
Paradis, E. and Schliep, K., 2019. ape 5.0: an environment for modern phylogenetics and evolutionary analyses in R. Bioinformatics 35: 526-528. https://doi.org/10.1093/bioinformatics/bty633
Quinlan, A.R. and Hall, I.M., 2010. BEDTools: a flexible suite of utilities for comparing genomic features. Bioinformatics 26: 841-842. https://doi.org/10.1093/bioinformatics/btq033
R_Core_Team, 2021. R: a language and environment for statistical computing. R Foundation for Statistical Computing, Vienna, Austria.
Rohart, F., Gautier, B., Singh, A. and Le Cao, K.A., 2017. mixOmics: An R package for ’omics feature selection and multiple data integration. PLoS Computational Biology 13: e1005752. https://doi.org/10.1371/journal.pcbi.1005752
Schaafsma, A., Mallee, L., van den Belt, M., Floris, E., Kortman, G., Veldman, J., van den Ende, D. and Kardinaal, A., 2021. The effect of a whey-protein and galacto-oligosaccharides based product on parameters of sleep quality, stress, and gut microbiota in apparently healthy adults with moderate sleep disturbances: a randomized controlled cross-over study. Nutrients 13: 2204. https://doi.org/10.3390/nu13072204
Smith, R.P., Easson, C., Lyle, S.M., Kapoor, R., Donnelly, C.P., Davidson, E.J., Parikh, E., Lopez, J.V. and Tartar, J.L., 2019. Gut microbiome diversity is associated with sleep physiology in humans. PLoS ONE 14: e0222394. https://doi.org/10.1371/journal.pone.0222394
Strandwitz, P., Kim, K.H., Terekhova, D., Liu, J.K., Sharma, A., Levering, J., McDonald, D., Dietrich, D., Ramadhar, T.R., Lekbua, A., Mroue, N., Liston, C., Stewart, E.J., Dubin, M.J., Zengler, K., Knight, R., Gilbert, J.A., Clardy, J. and Lewis, K., 2019. GABA-modulating bacteria of the human gut microbiota. Nature Microbiology 4: 396-403. https://doi.org/10.1038/s41564-018-0307-3
Tamames, J. and Puente-Sanchez, F., 2018. SqueezeMeta, a highly portable, fully automatic metagenomic analysis pipeline. Frontiers in Microbiology 9: 3349. https://doi.org/10.3389/fmicb.2018.03349
Tarasov, A., Vilella, A.J., Cuppen, E., Nijman, I.J. and Prins, P., 2015. Sambamba: fast processing of NGS alignment formats. Bioinformatics 31: 2032-2034. https://doi.org/10.1093/bioinformatics/btv098
Tatusov, R.L., Galperin, M.Y., Natale, D.A. and Koonin, E.V., 2000. The COG database: a tool for genome-scale analysis of protein functions and evolution. Nucleic Acids Research 28: 33-36. https://doi.org/10.1093/nar/28.1.33
Valles-Colomer, M., Falony, G., Darzi, Y., Tigchelaar, E.F., Wang, J., Tito, R.Y., Schiweck, C., Kurilshikov, A., Joossens, M., Wijmenga, C., Claes, S., Van Oudenhove, L., Zhernakova, A., Vieira-Silva, S. and Raes, J., 2019. The neuroactive potential of the human gut microbiota in quality of life and depression. Nature Microbiology 4: 623-632. https://doi.org/10.1038/s41564-018-0337-x
Wickham, H., 2016. Ggplot2: elegant graphics for data analysis. Springer-Verlag, New York, NY, USA.
Wood, D.E., Lu, J. and Langmead, B., 2019. Improved metagenomic analysis with Kraken 2. Genome Biology 20: 257. https://doi.org/10.1186/s13059-019-1891-0
Wu, Q., Tun, H.M., Law, Y.S., Khafipour, E. and Shah, N.P., 2017. Common distribution of gad operon in Lactobacillus brevis and its GadA contributes to efficient GABA synthesis toward cytosolic near-neutral pH. Frontiers in Microbiology 8: 206. https://doi.org/10.3389/fmicb.2017.00206
Yunes, R.A., Poluektova, E.U., Dyachkova, M.S., Klimina, K.M., Kovtun, A.S., Averina, O.V., Orlova, V.S. and Danilenko, V.N., 2016. GABA production and structure of gadB/gadC genes in Lactobacillus and Bifidobacterium strains from human microbiota. Anaerobe 42: 197-204. https://doi.org/10.1016/j.anaerobe.2016.10.011
